Key Stats for COST Stock
- Past week’s performance: Consolidating
- 52-week range: $844 to $1,097
- Valuation model target price: $1158
- Implied upside: 22.9% over the next 2.2 years
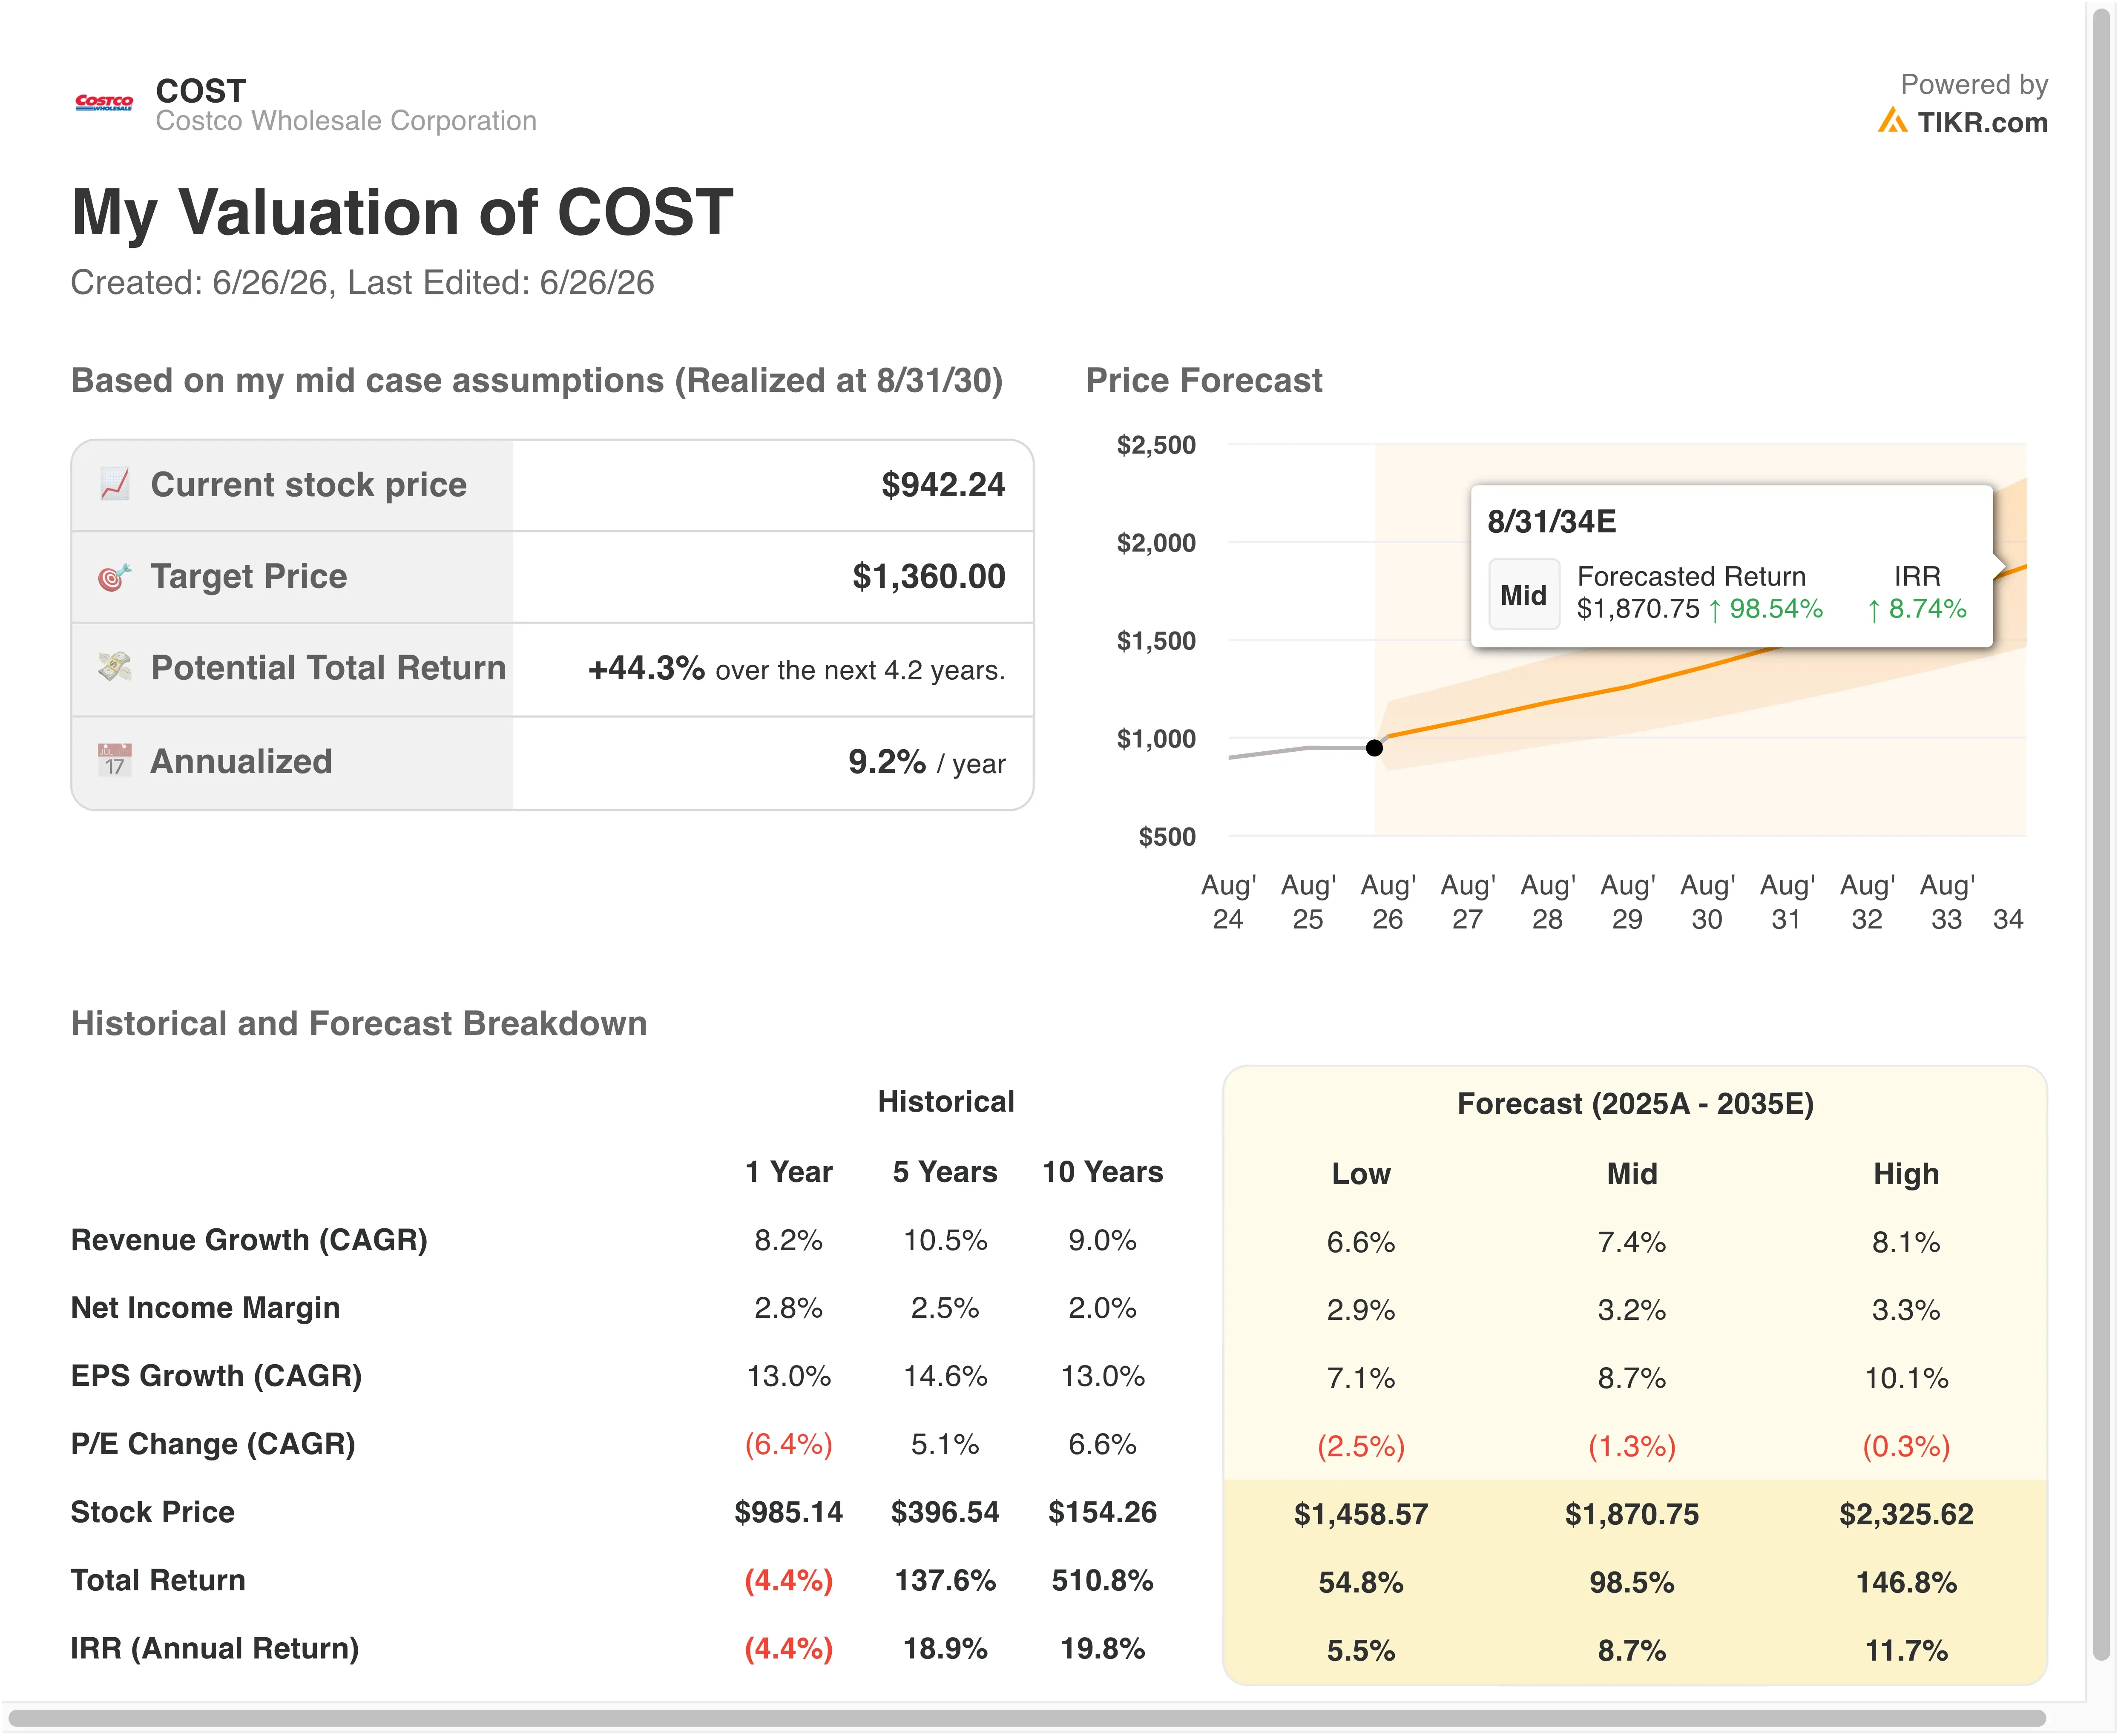
Value your favorite stocks like COST with 5 years of analysts’ forecasts using TIKR’s new Valuation Model (It’s free) >>>
Strong Sales, a New Legal Overhang
Costco Wholesale Corporation (COST) is the third-largest retailer in the world. The company operates a members-only warehouse club model where shoppers pay an annual fee for access to bulk merchandise at deeply discounted prices. That fee income is the engine of the business model, and it makes any headline touching legal liability worth watching closely.

Costco’s fiscal Q3 2026 results, reported on May 28 and May 29, showed net income climbing 15.2% to $2.19 billion. Net sales rose 11.6% to $69.15 billion. May net sales alone jumped 14.5% to $24.01 billion. Those numbers point to a business running well. But the stock pulled back modestly, and the legal backdrop explains part of why.
In June, Costco disclosed that four class action lawsuits were filed against it in March. The suits seek refunds for tariffs paid under IEEPA, which stands for the International Emergency Economic Powers Act, the legal authority used to impose emergency tariff schedules. Costco is urging a federal judge to reject the case. The company argues it has no obligation to pass those costs back to consumers, but the lawsuit adds a novel legal risk to a stock already trading at a premium multiple.
Management commentary on the quarter was constructive. Costco’s gas stations are drawing more value-conscious Americans as fuel prices bite, reinforcing the company’s value proposition beyond core merchandise. Going forward, COST stock will hinge on whether the lawsuit gains traction and whether membership fee income continues to grow even as the consumer environment shifts.
See Costco’s consensus estimates and analyst targets on TIKR (It’s free) >>>
Is Costco Stock Overvalued at Current Levels?

Under valuation model assumptions realized through 8/31/28, the stock is modeled using:
- Revenue Growth (CAGR): 8.3%
- Operating Margins: 4.0%
- Exit P/E Multiple: 43.1x
Based on these inputs, the model estimates a target price of $1,158, implying 22.9% total upside from the current share price of $942 and a 9.9% annualized return over the next 2.2 years.
A 9.9% annualized return sits right at the threshold where a stock is considered reasonably attractive rather than clearly cheap. The NTM P/E of 43.1x is well above the stock’s 10-year historical average, which hovered closer to 30x to 35x for most of the last decade.
The 8.3% revenue CAGR assumption is consistent with Costco’s recent execution. The business has compounded net sales at 9.0% over the past decade and 10.5% over the past five years, so the forecast is not heroic. But it is also not an assumption that leaves margin for error.
The 4.0% operating margin assumption is slightly above Costco’s current 3.6% trailing margin and its five-year average of 3.3%. Costco has historically expanded margins slowly and deliberately, so this assumption is grounded. Gross margin has held remarkably steady even through tariff periods, partly because Costco sources a meaningful portion of its merchandise domestically and partly because the bulk-purchasing model insulates it better than general merchandise peers.
At 43.1x exit P/E, the model assumes investors still value Costco at a significant premium to the market. That premium reflects the membership moat, the inventory efficiency, and the decades of trust built with the consumer. It is defensible, but it narrows the margin of safety considerably compared to a stock trading at 20x or 25x.
Compare Costco’s valuation to retailers on TIKR using the Guided Valuation Model >>>
Walmart and Target Cannot Match Costco’s Membership Engine
Costco’s closest structural comparables are Walmart (WMT) and Target (TGT), but the comparison quickly reveals why Costco commands a premium. Walmart trades at roughly 35x forward earnings versus Costco’s 43x, but Walmart’s revenue base is far larger, and its growth is structurally slower. Target has faced persistent margin compression and traffic declines, with Q1 FY26 same-store sales disappointing investors and shares lagging the broader sector.

The key differentiator is membership fee income. Costco generated approximately $4.8 billion in membership fees over the trailing twelve months. That stream is essentially risk-free revenue, because members pay upfront and renewal rates consistently exceed 90%. Neither Walmart nor Target can replicate that dynamic, and it is the reason Costco’s operating margin of 3.8% is worth more to investors than it looks on paper.
BJ’s Wholesale Club (BJ) is a more direct model comparison, but the scale gap is enormous. BJ’s operates roughly 250 warehouses in the eastern United States, while Costco runs over 900 globally. Costco’s international membership base, particularly in Asia, is a growth avenue that BJ’s does not have. On operating margins, BJ’s runs closer to 3.5% to 4.0%, similar to Costco, but its revenue growth rate is slower, and its brand carries significantly less pricing power.
The tariff litigation is an interesting risk in the competitive context. If courts require retailers to seek and pass on tariff refunds, Costco’s pricing model faces a compliance burden its competitors would share equally. But Costco’s legal team has moved quickly to challenge the lawsuit, and the membership structure gives it more pricing flexibility than most. No outcome here is likely to change the underlying competitive positioning.
Estimate a company’s fair value instantly (Free with TIKR) >>>
What’s Driving COST Stock Going Forward?
Membership fee growth is the first catalyst to watch. Costco raised its annual membership fee in January 2025, and that increase is still flowing through the revenue base. Each additional warehouse opened globally generates a new cohort of fee-paying members, and renewal rates above 90% mean the economics compound over time. Management has signaled continued international expansion, particularly in Asia-Pacific markets where the club model has significant room to grow.
The tariff refund litigation is the most immediate legal risk on the horizon. Costco urged a federal judge to reject a consumer class action over tariff refunds in May 2026, and the outcome will set a precedent that affects the entire retail sector. A ruling against Costco would not be catastrophic to earnings, but it could require process changes and create ongoing compliance costs.
Same-store sales momentum has been strong, but the comparison base becomes harder in the back half of fiscal 2026. Costco’s April net sales rose 13%, and March net sales rose 11.3%, both solid prints. But year-over-year comparisons tighten as the business laps strong 2025 performance, which means even a healthy business could see reported growth rates moderate.
The fiscal Q4 2026 earnings report, scheduled for September 24, will be the next major reset for the stock. Investors will be looking for evidence that membership renewal rates held through the tariff noise, that operating margins are tracking toward the 4.0% target, and that the international pipeline remains on schedule. A strong Q4 would likely push the stock back toward the high end of its 52-week range and close the gap to the street target of $1,082.
Estimate a company’s fair value instantly (Free with TIKR) >>>
Should You Invest in Costco?
The only way to really know is to look at the numbers yourself. TIKR gives you free access to the same institutional-quality financial data that professional analysts use to answer exactly that question.
Pull up COST, and you’ll see years of historical financials, what Wall Street analysts expect for revenue and earnings in the quarters ahead, how valuation multiples have moved over time, and whether price targets are trending up or down.
You can build a free watchlist to track COST alongside every other stock on your radar. No credit card required. Just the data you need to decide for yourself.
Analyze COST stock on TIKR Free→
Looking for New Opportunities?
- See what stocks billionaire investors are buying so you can follow the smart money.
- Analyze stocks in as little as 5 minutes with TIKR’s all-in-one, easy-to-use platform.
- The more rocks you overturn… the more opportunities you’ll uncover. Search 100K+ global stocks, global top investor holdings, and more with TIKR.
Disclaimer:
Please note that the articles on TIKR are not intended to serve as investment or financial advice from TIKR or our content team, nor are they recommendations to buy or sell any stocks. We create our content based on TIKR Terminal’s investment data and analysts’ estimates. Our analysis might not include recent company news or important updates. TIKR has no position in any stocks mentioned. Thank you for reading, and happy investing!