Key Takeaways
- Microsoft lowered its calendar 2026 capex guide from about $190 billion to about $175 billion in July, but management said spending expectations are unchanged and the drop comes from how future data center leases are counted.
- Capex jumped about 80% to $115.95 billion in fiscal 2026 while cash from operations rose about 34% to $182.94 billion, so calculated free cash flow slipped from $71.61 billion to $66.99 billion.
- Microsoft’s NTM Market Cap / Free Cash Flow reads 116.92x against a 42.44x average, even though the stock is up only about 7% this year.
Microsoft’s capex guide dropped about $15 billion without a dollar of spending cut. Track Microsoft’s cash flow on TIKR for free →
Microsoft’s $15 Billion Capex Cut Moved Spending Instead of Trimming It
On the Q4 2026 earnings call, Amy Hood spent a short stretch on what sounded like accounting housekeeping. Starting in fiscal 2027, Microsoft would stretch the estimated useful life of its data centers and office buildings from 15 years to 25.
The consequence arrived a few sentences later. More future data center leases will be treated as operating leases instead of finance leases, and Microsoft counts finance leases in capital expenditures but not operating leases. “Outside of this useful life impact, our calendar year 2026 CapEx investment expectations remain unchanged,” Hood said. The guide fell from about $190 billion in April to about $175 billion. The spending did not.
The cost has to land somewhere, and operating lease payments run through operating cash flow. Hood pointed to it herself when describing Q4, where cash from operations rose 30% to $55.4 billion, “partially offset by an increase in operating lease payments.” Free cash flow fell 23% to $19.6 billion.

The full-year pattern is starker. Capex went from $44.48 billion in fiscal 2024 to $115.95 billion in fiscal 2026, and its share of operating cash flow climbed from 38% to 63%. Calculated free cash flow fell from $74.07 billion to $66.99 billion over that stretch, even as operating cash flow rose from $118.55 billion to $182.94 billion. Depreciation and amortization, at $39.00 billion, has grown far more slowly than the spending behind it, and longer asset lives will stretch that gap further.
Management called the fiscal 2027 operating income benefit minimal. The bigger effect is on how capex reads.
Microsoft’s capex rose about 80% in fiscal 2026 while free cash flow slipped. Compare Microsoft’s capex and operating cash flow on TIKR for free →
Microsoft’s Free Cash Flow Multiple Now Carries the Bet
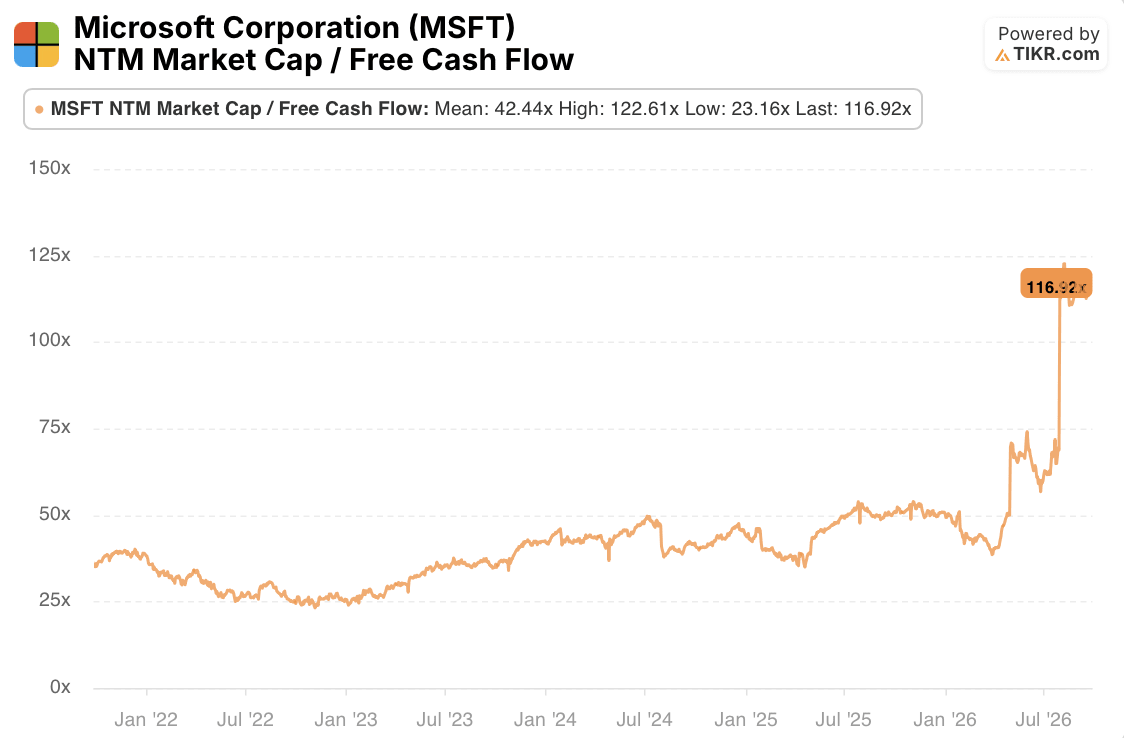
The market has noticed. TIKR’s NTM Market Cap / Free Cash Flow for Microsoft reads 116.92x, against a mean of 42.44x, a low of 23.16x and a high of 122.61x.
The stock did not double to get there. Reuters put it up roughly 7% year to date in late September, so the jump looks like the denominator shrinking, meaning forward free cash flow expectations falling. That is an inference, since the chart shows the multiple and not the estimates behind it.
Demand is not the worry. Azure grew 43% and is guided to about 45% growth next quarter, commercial remaining performance obligation reached $678 billion, and Hood said on the same call “customer demand continues to exceed available capacity.” The open question is how much cash that capacity consumes on the way. Management’s own language is modest: it expects to “remain free cash flow positive” in fiscal 2027, with capex growing and Q1 spending “over $50 billion.”
The evidence supports a narrow judgment. Microsoft’s growth is real, but the lower guide flatters the cash picture, and at 116.92x the market is paying for a free cash flow recovery that management has only promised will stay above zero. The main risk is a repeat of fiscal 2026, when capex grew about 80% against about 34% for operating cash flow, and forward free cash flow estimates keep sliding.
The fiscal Q1 report is the next test, and the first to carry the new lease treatment. Free cash flow above Q4’s $19.6 billion would suggest the squeeze is stabilizing. Below it would suggest lease payments and heavier capex are absorbing operating cash faster than it grows. Q4 is a reference point, not a company target.
Microsoft’s Q1 report will show how leases and capex hit free cash flow. Monitor Microsoft’s quarterly cash flow on TIKR for free →
Disclaimer:
Please note that the articles on TIKR are not intended to serve as investment or financial advice from TIKR or our content team, nor are they recommendations to buy or sell any stocks. We create our content based on TIKR Terminal’s investment data and analysts’ estimates. Our analysis might not include recent company news or important updates. TIKR has no position in any of the stocks mentioned. Thank you for reading, and happy investing!