
Key Takeaways for CoStar Group Stock as of September 2026
- YTD Slide: CoStar Group stock is down 53% since January, sliding from $67 to $31.
- Target Capitulation: Analysts cut CoStar Group stock’s mean price target from $48 to $37 between June and September, a 21% reduction that arrived after the stock had already bottomed.
- Ratings Split: Wall Street currently carries 8 buys, 4 outperforms, 8 holds, and 1 sell on CoStar Group stock, putting the $37 mean target 21% above the $31 close.
- Model Upside: TIKR’s mid-case model values CoStar Group stock at $57 by December 2030, implying an 86% total return and 15% annualized.
Why CoStar Group Stock Has Lost More Than Half Its Value in 2026
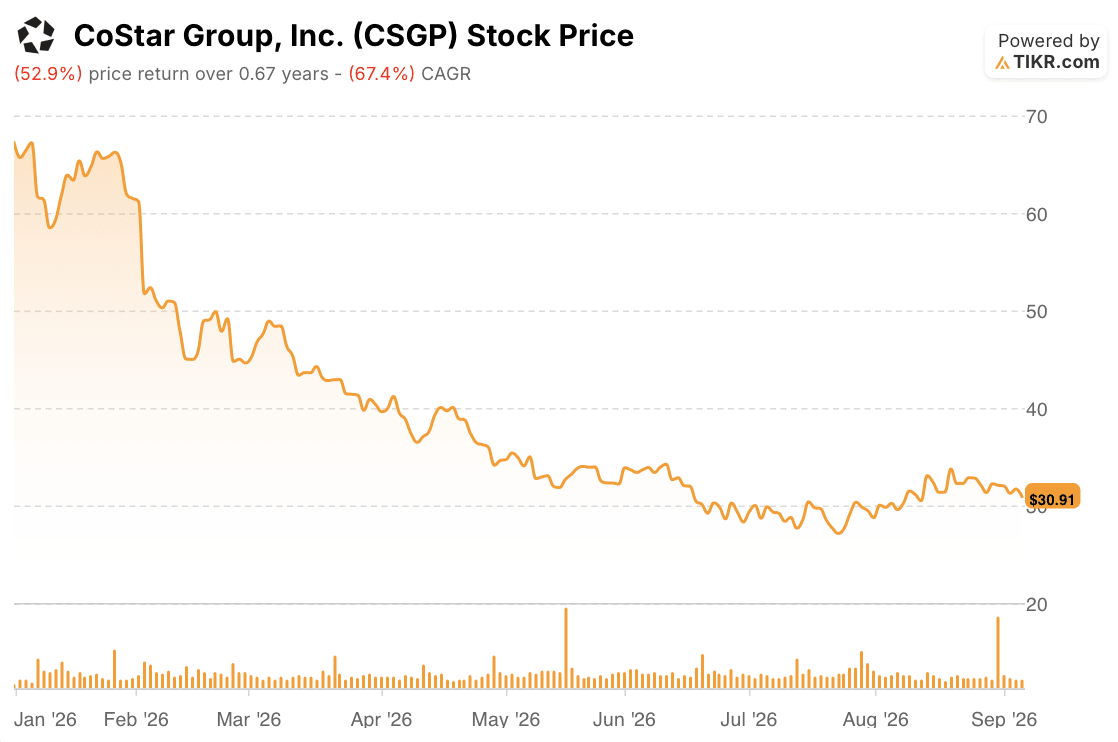
CoStar Group (CSGP) stock has fallen 53% since the start of the year, dropping from a $67 close on December 31 to $31 on September 4. The slide didn’t arrive in one move. It built in stages, each tied to the same fight: how much profit CoStar should sacrifice to keep growing Homes.com.
The first stage hit on February 25, when CoStar Group’s fourth-quarter report came with a first-quarter guide investors hadn’t priced in: adjusted EBITDA of $95 million to $115 million, well below what the prior cost base implied. Shares fell that day and kept falling, closing the first quarter at $40, down 40% in three months. Margin pressure from Homes.com’s marketing spend and the newly folded-in Domain business in Australia was the stated cause, and it recurred all year.
Competitive noise kept the pressure on. When Google expanded its Local Services Ads home-search tool nationwide on June 11, CoStar Group stock fell another 4% on fears that a dominant search engine competing directly for homebuyer traffic could undercut Homes.com’s lead-generation model before it ever turns a profit. The stock bottomed near $28 at the end of June.
Then came the pivot. On the July 28 second-quarter call, CoStar Group cut its full-year revenue guidance to $3.715 billion to $3.755 billion after net new bookings fell 26% year over year, driven largely by a deliberate 21% cut to the Homes.com sales force.
CFO Christian Lown used the same call to defend the trade: “As a result of our stringent focus on expense management, we are affirming the adjusted EBITDA guidance that we provided last quarter, which calls for adjusted EBITDA to range from $780 million to $820 million. This is an increase at the midpoint of $30 million from our 2026 guidance provided on our February earnings call.” Growth slowed. Profit guidance went up anyway.
That’s the tension sitting underneath CoStar Group stock’s 53% decline: a market that sold first and is still deciding whether a smaller, higher-margin Homes.com is worth more than the faster-growing one it replaced.
The Zillow Antitrust Settlement Adds a New Wrinkle to CoStar’s Rental Fight
CoStar Group’s rental business is fighting on two fronts, and the second front shifted on August 24, when Zillow settled with the FTC and five states over the $100 million it paid Redfin to stay out of apartment rental advertising. The settlement requires Redfin to rebuild its rental advertising business within six months, reopening a market CoStar Group has described as already stressed by heavy discounting.
On the July call, CEO Andy Florance pointed to the same dynamic, telling analysts CoStar Group is “maintaining our price integrity” against “a competitor trying to buy share with pricing, with really low pricing.” A rebuilt Redfin rental arm means the Apartments.com side of CoStar Group stock’s thesis now faces three rivals instead of two, not fewer.
CoStar Group Stock’s Analyst Targets Finally Catch Up to the Selloff
Wall Street currently rates CoStar Group stock 8 buys, 4 outperforms, 8 holds, and 1 sell, spread across 20 analysts publishing price targets, up from 16 a year ago. The mean target sits at $37, 21% above the $31 close on September 4.
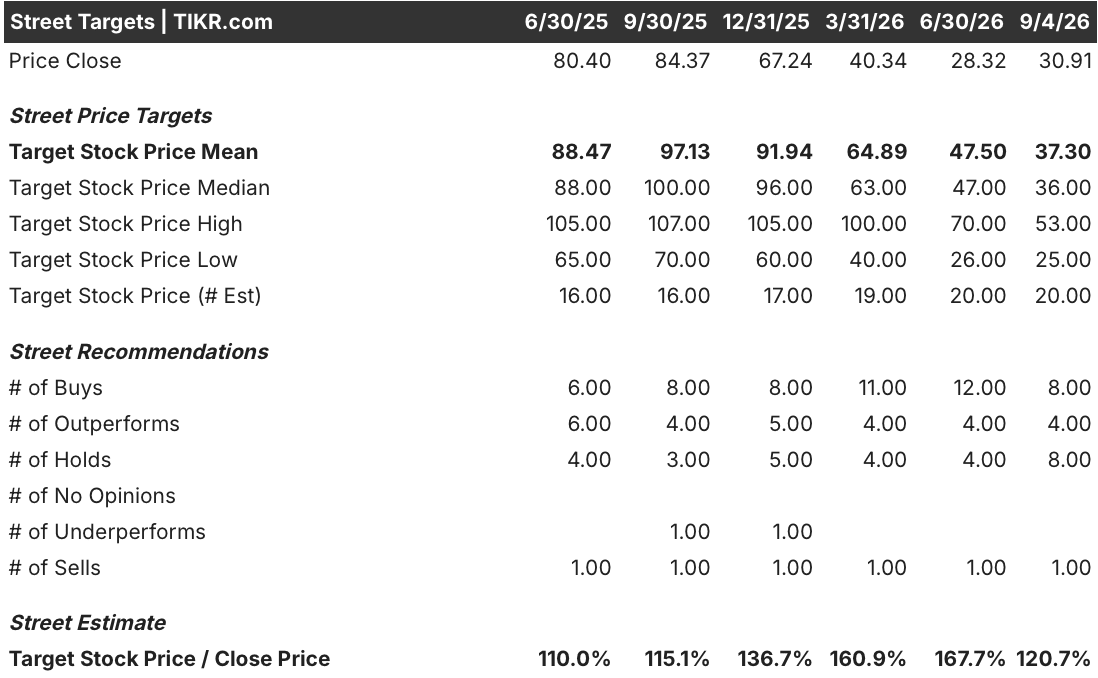
That gap used to be much wider. Analysts trimmed their mean target more slowly than the stock fell through the first half of the year: the target dropped from $92 to $65 as the price fell from $67 to $40 in the first quarter, pushing implied upside from 37% to 61%. By June 30, with the stock down to $28, the mean target still sat at $48, pricing in 68% upside, the widest gap of the year. Then, between June and September, analysts cut the mean target 21%, from $48 to $37, even as the stock recovered 9% off its low. The Street didn’t call the bottom. It caught up to it after the fact.
The ratings shift matches the target move. Buy ratings on CoStar Group stock peaked at 12 in the June quarter, when the stock traded cheapest against the old target, and have since fallen to 8. Holds doubled from 4 to 8 over the same stretch, while the one sell rating hasn’t moved all year. Coverage itself keeps expanding, from 16 analysts a year ago to 20 now, even as the target math resets lower.
TIKR Values CoStar Group Stock at $57, Pricing In an 86% Rebound
TIKR’s mid-case model values CoStar Group stock at $57 by December 2030, implying an 86% total return from the current price of $31, or 15% annualized over 4.3 years.
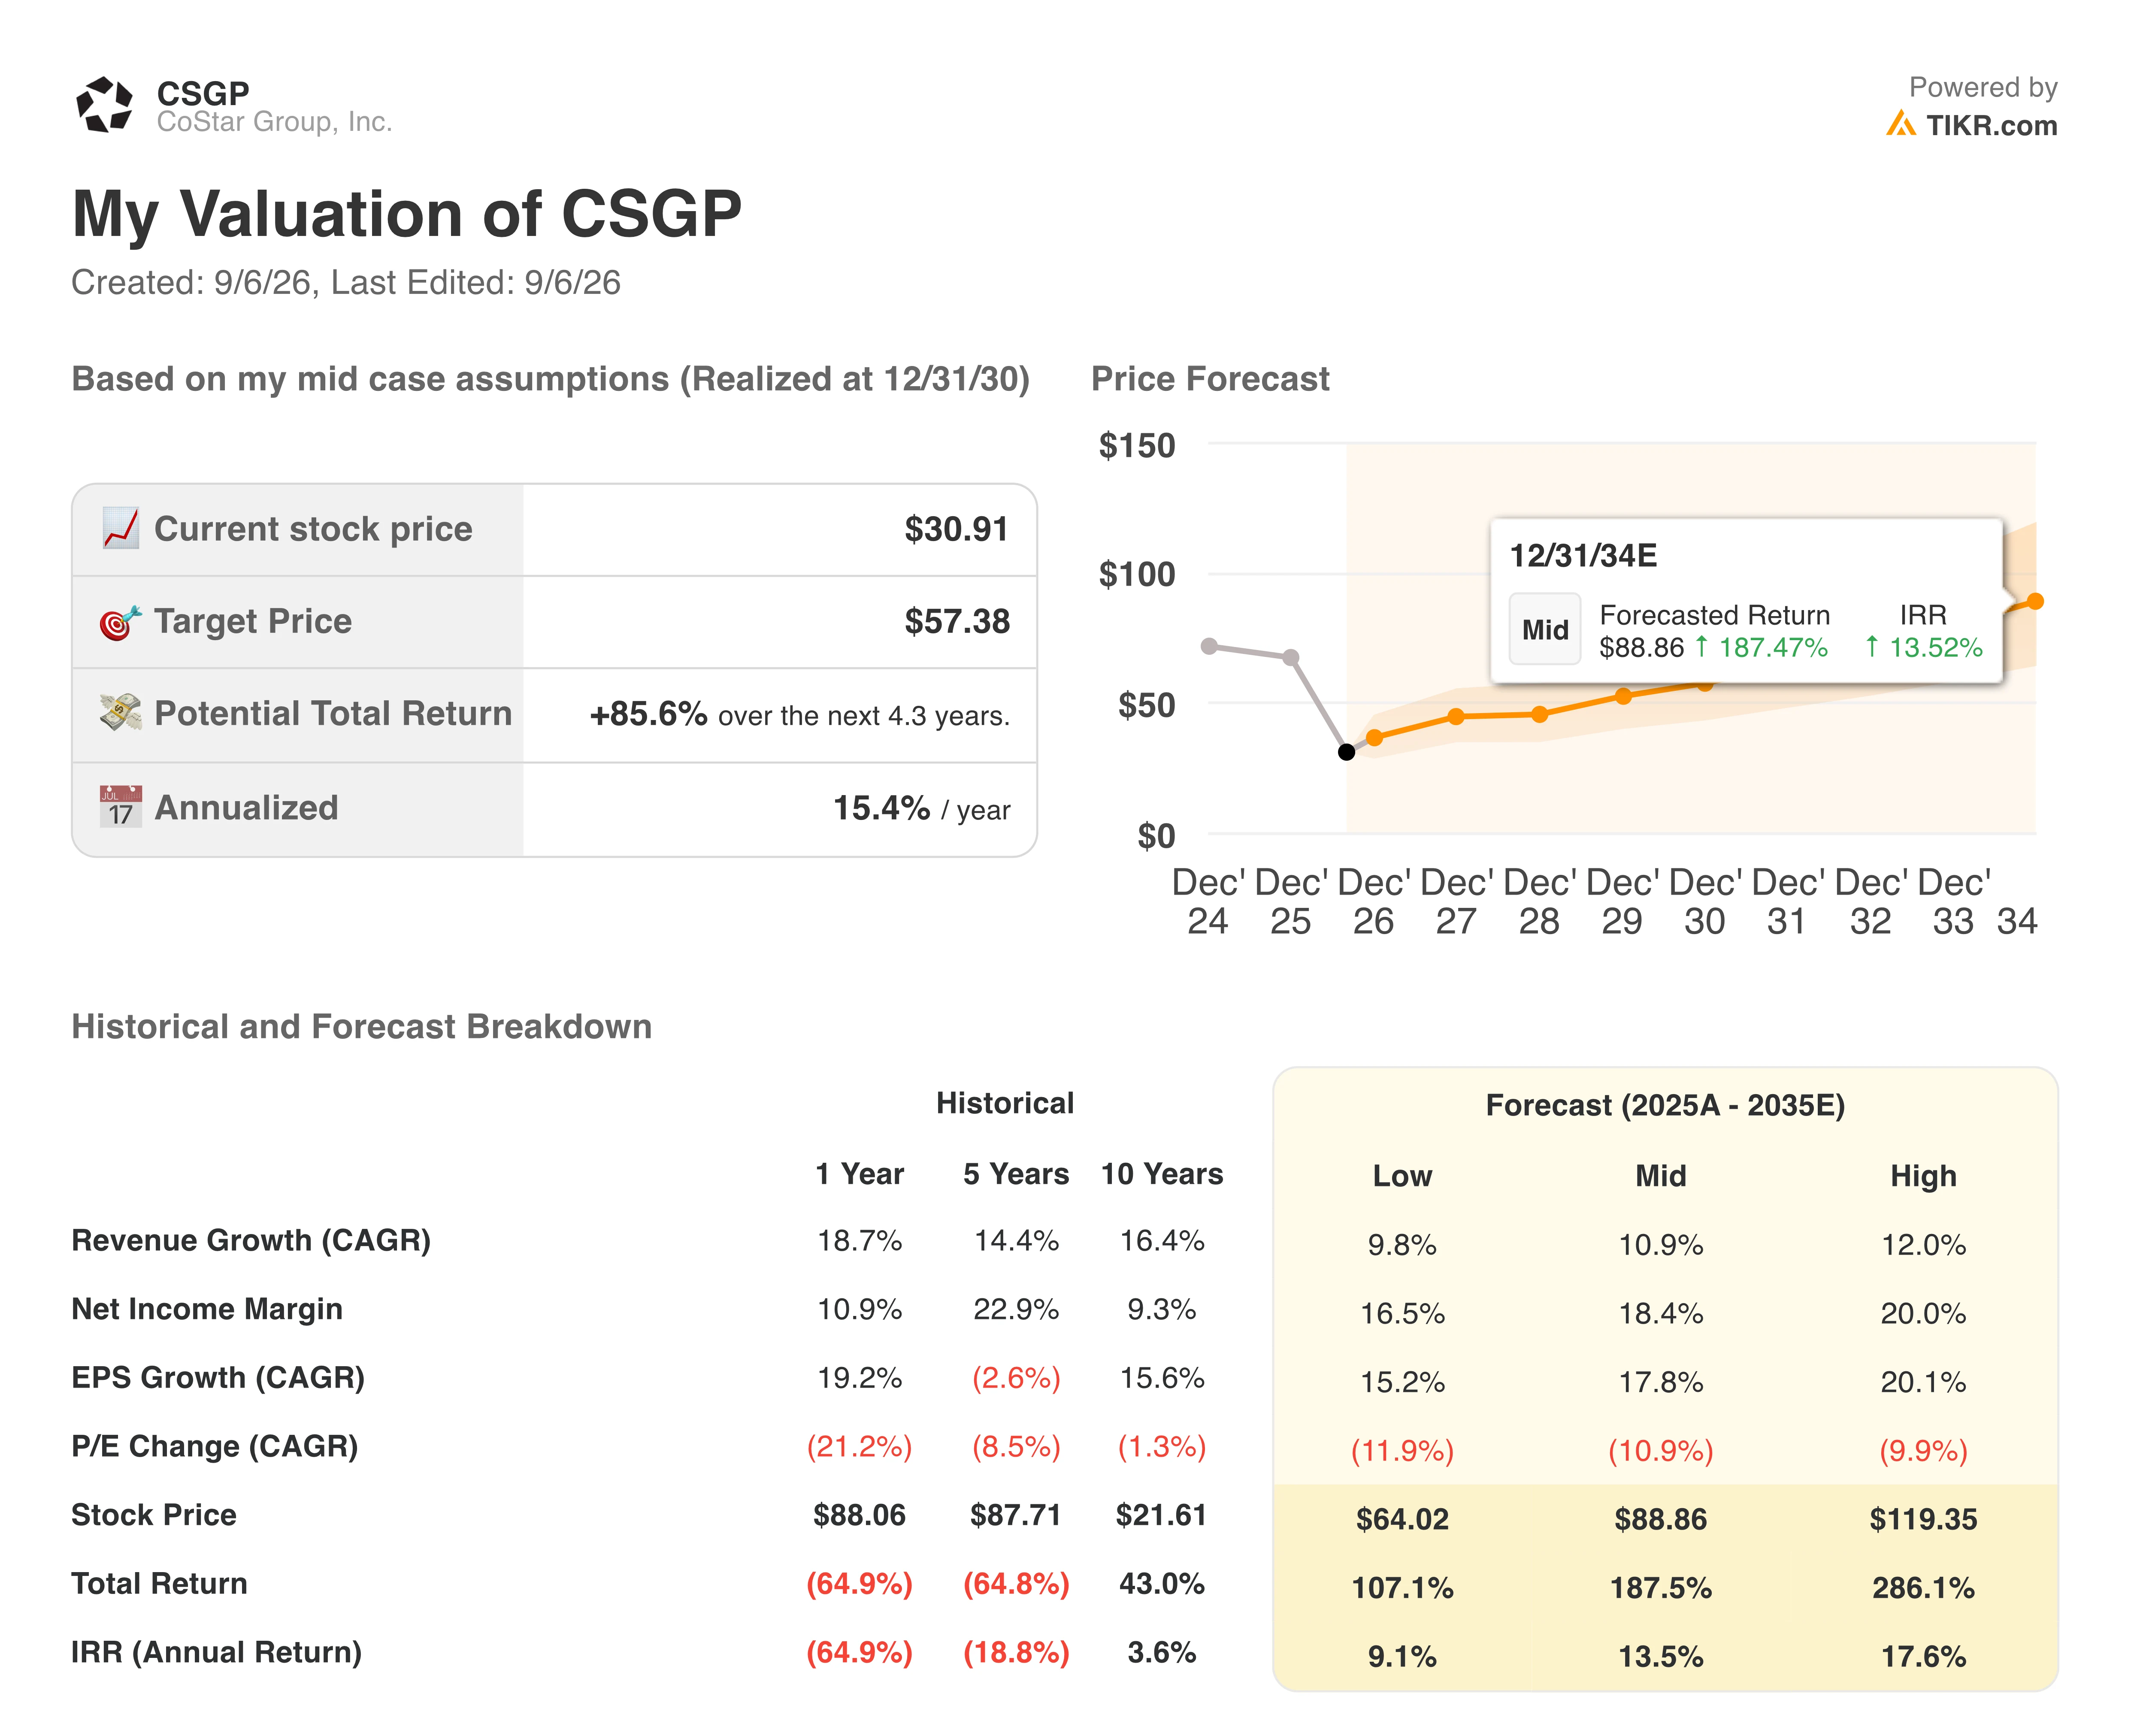
That return profile places CoStar Group stock among the more aggressive re-rating bets in the sector, a function of how far the price fell rather than a richer earnings outlook.
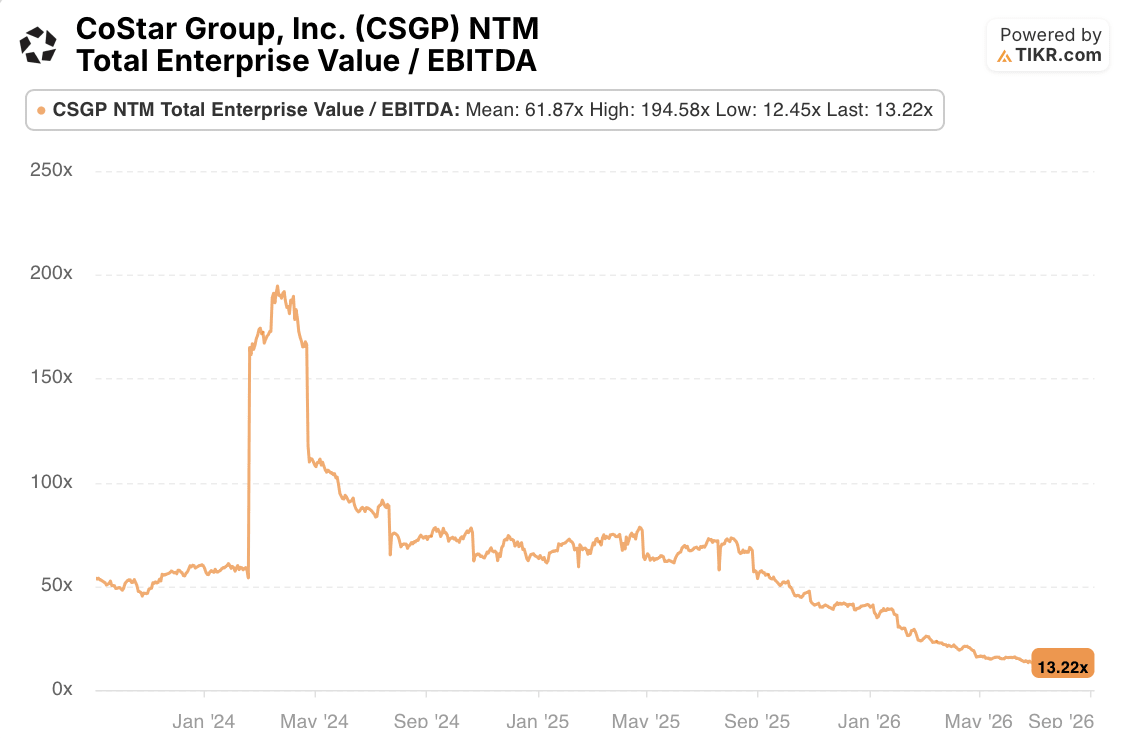
CoStar Group stock’s NTM EV/EBITDA multiple has fallen from 67.7x on June 30, 2025 to 13.2x now, nearly touching its five-year low of 12.5x and sitting well below the 61.9x five-year mean. That’s the hard number behind the “aggressive re-rating” claim: the stock trades near the cheapest multiple it has carried in five years, exactly the compression TIKR’s model needs to reverse for CoStar Group stock to reach $57 by 2030.
The case for reaching $57 rests on the same trade management made in July: an EBITDA guide that rose even as revenue guidance fell, alongside a Street whose own target cut this summer shows it was behind the business’s margin trajectory, not ahead of it. CoStar Group stock’s 53% decline priced in a growth story breaking. The model bets on a smaller, higher-margin Homes.com replacing it instead.
Should You Invest in CoStar Group, Inc.?
The only way to really know is to look at the numbers yourself. TIKR gives you free access to the same institutional-quality financial data that professional analysts use to answer exactly that question.
Pull up CoStar Group, Inc. stock and you’ll see years of historical financials, what Wall Street analysts expect for revenue and earnings in the quarters ahead, how valuation multiples have moved over time, and whether price targets are trending up or down.
You can build a free watchlist to track CoStar Group, Inc. alongside every other stock on your radar. No credit card required. Just the data you need to decide for yourself.
Access Professional Tools to Analyze CSGP stock on TIKR for Free →
Looking for New Opportunities?
- See what stocks billionaire investors are buying so you can follow the smart money.
- Analyze stocks in as little as 5 minutes with TIKR’s all-in-one, easy-to-use platform.
- The more rocks you overturn… the more opportunities you’ll uncover. Search 100K+ global stocks, global top investor holdings, and more with TIKR.
Disclaimer:
Please note that the articles on TIKR are not intended to serve as investment or financial advice from TIKR or our content team, nor are they recommendations to buy or sell any stocks. We create our content based on TIKR Terminal’s investment data and analysts’ estimates. Our analysis might not include recent company news or important updates. TIKR has no position in any stocks mentioned. Thank you for reading, and happy investing!