
Key Stats for Carvana Stock
- 52-Week Range: $54.46 – $97.38
- Current Price: $70.58
- Street Target Price: ~$83
- NTM P/E: ~34x
- YTD Return: -14.6%
- Market Cap: ~$49B
Now Live: Discover how much upside your favorite stocks could have using TIKR’s new Valuation Model (It’s free)>>>
From Near-Bankruptcy to Record Quarterly Results
Carvana (CVNA) sells used cars entirely online. Customers browse inventory, arrange financing, and have a vehicle delivered to their driveway without ever visiting a dealership, sometimes the same day. Since launching in 2013, the platform has served more than 4 million customers and built a national infrastructure of reconditioning facilities, last-mile logistics hubs, and proprietary technology.
In 2022, the company nearly collapsed. An overextended balance sheet carrying close to $9 billion in debt collided with a used-car market that had peaked, with volumes falling and a cost structure too large for the revenue base. The stock fell from over $370 to under $4.
Most observers wrote Carvana off entirely. What followed instead was one of the more remarkable corporate turnarounds in recent memory, aggressive debt restructuring, cost discipline, rebuilt unit economics, and a return to growth without raising significant new equity.
Q2 2026 was Carvana’s 10th consecutive quarter of growth and profitability. Revenue reached $7.376 billion, up 52% year over year. Retail units sold hit 197,325, up 38%. Net income came in at $513 million with a 7% net margin.
Adjusted EBITDA of $769 million represented a 10.4% EBITDA margin, both all-time records. Full-year 2026 EBITDA guidance was raised to $2.7-$3.0 billion, up from $2.24 billion in 2025. CEO Ernie Garcia noted the company still represents just 1.5% of the U.S. automotive market.
The operating income chart captures just how far the business has traveled.

Operating income was negative $104 million in 2021 and crashed to negative $1.447 billion in 2022 at the crisis peak. The restructuring brought it nearly to breakeven at negative $65 million in 2023, then turned sharply positive: $1.002 billion in 2024, $1.884 billion in 2025.
Generating $1.9 billion in annual operating income from a business that was losing $1.4 billion three years earlier, on a balance sheet now carrying just $2.6 billion in net debt at under 1x EBITDA, is a genuine transformation.
See analysts’ growth forecasts and price targets for Carvana stock (It’s free) >>>
Beating Estimates Every Quarter and Selling Off Anyway
The Beats and Misses table reveals something worth pausing on. Over five consecutive quarters, Carvana has beaten revenue estimates by 5-11% each time. EBITDA beats in four of five. EPS beats in four of five. The stock has declined on earnings day in four of those five reports.
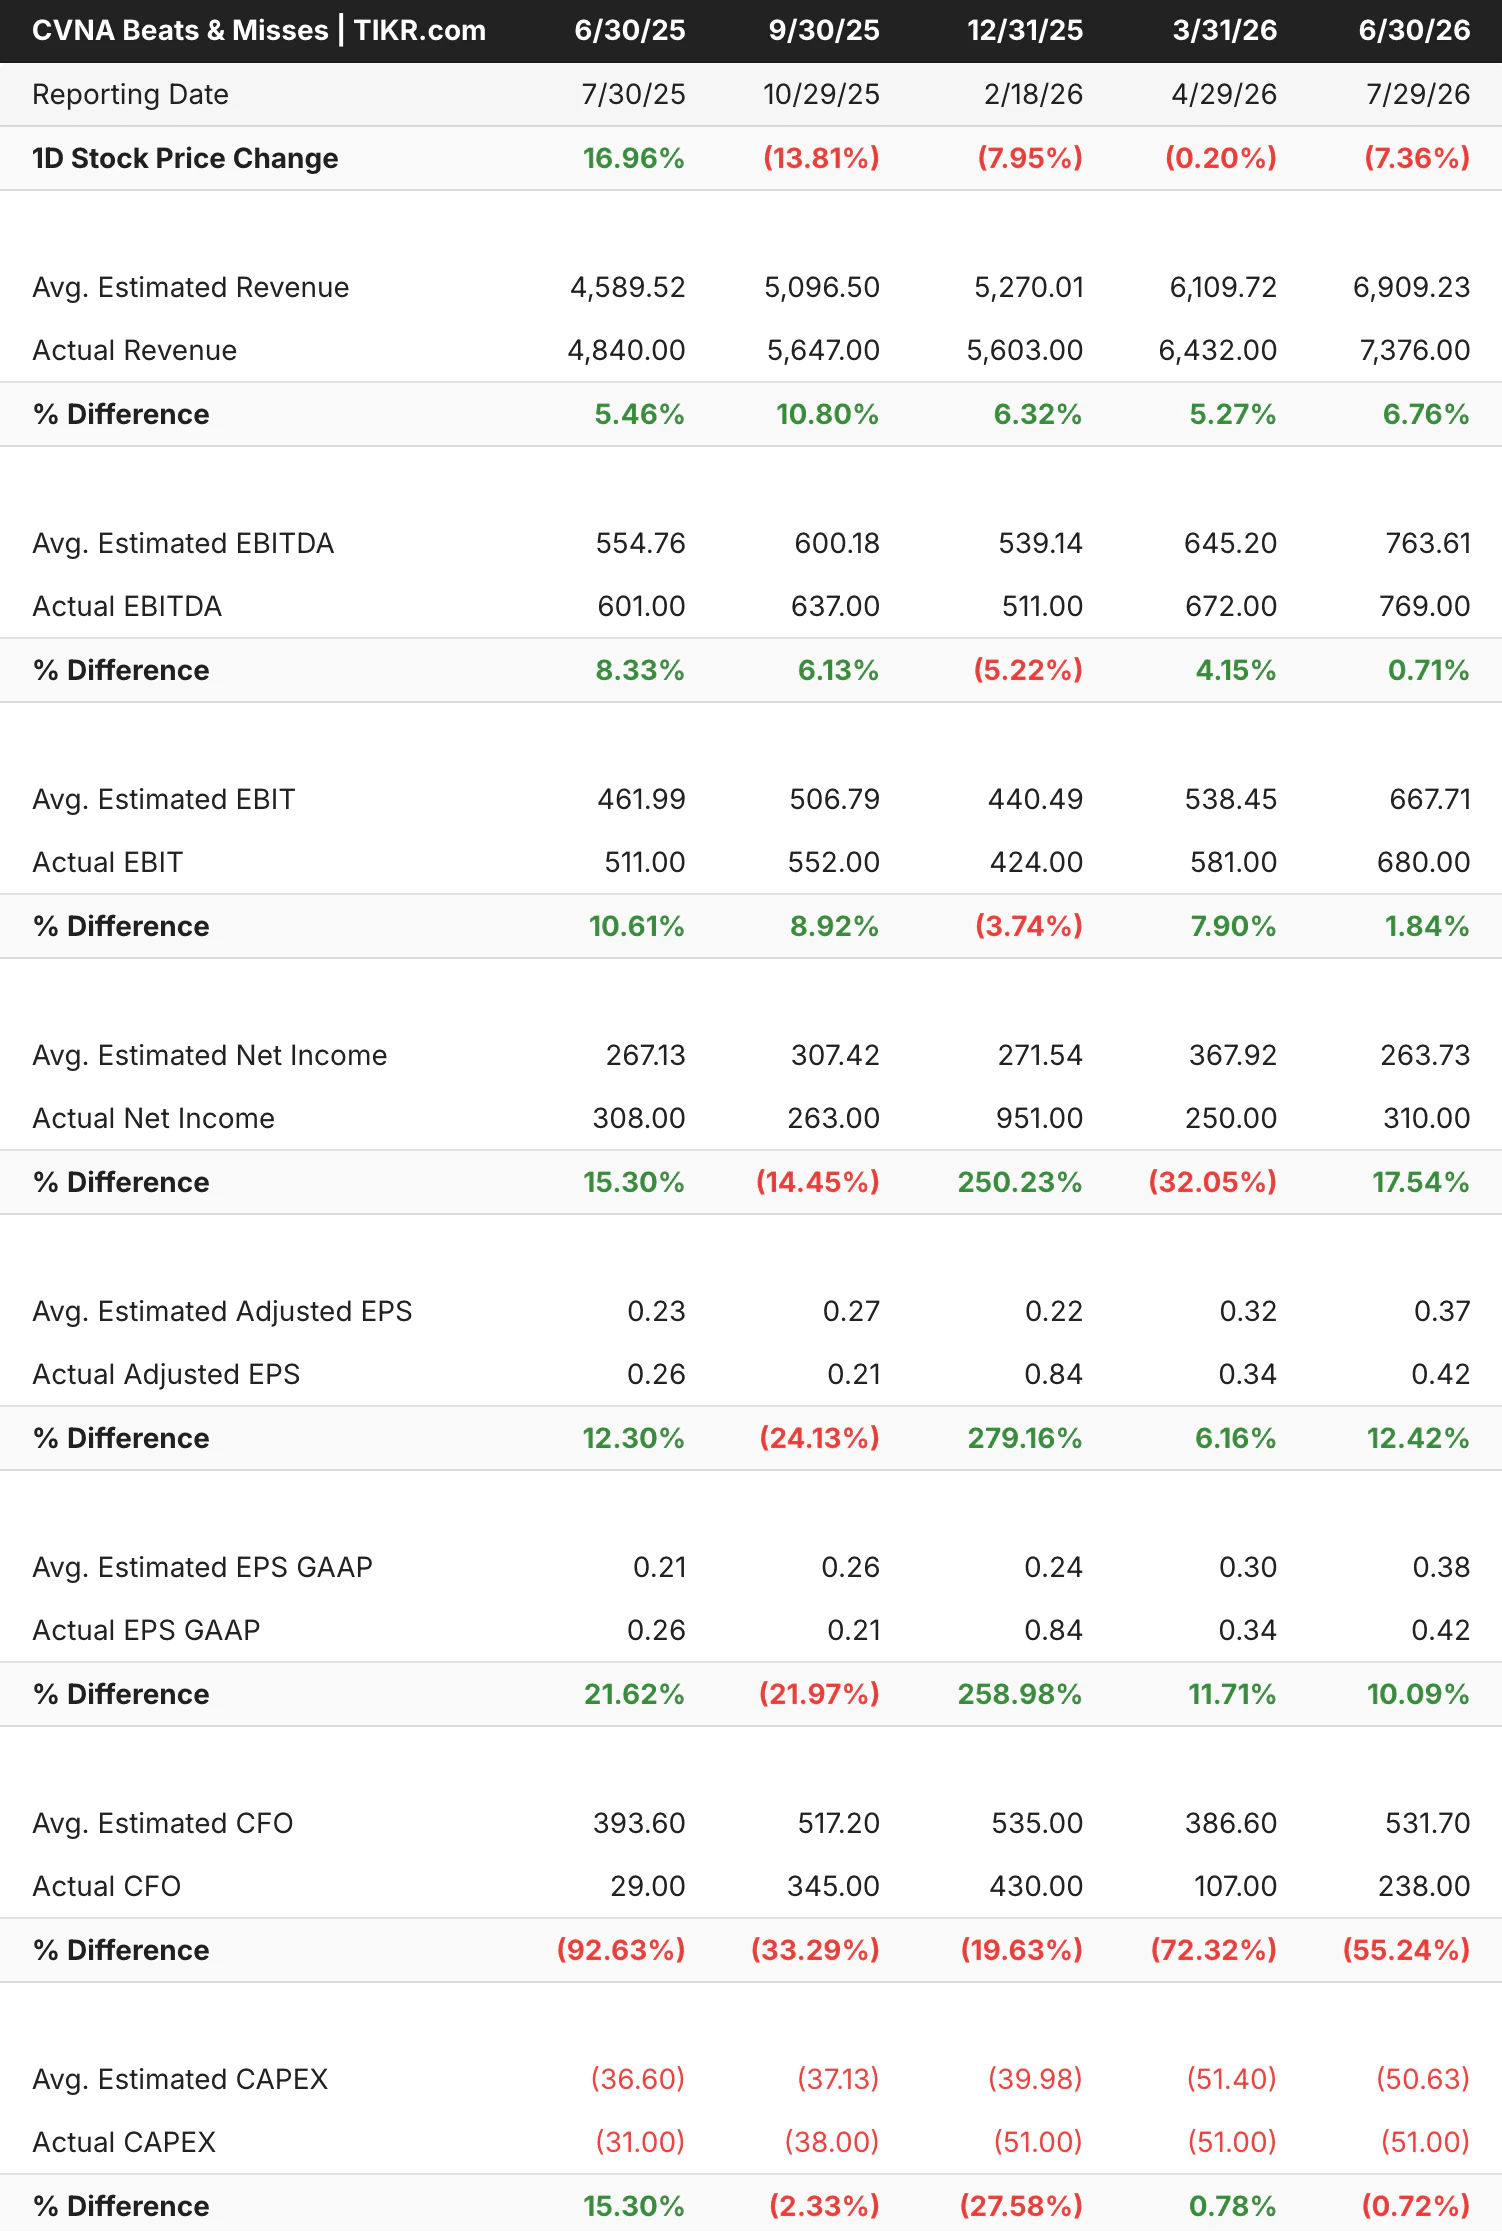
A few things explain the pattern. Expectations have been rising fast enough that even strong beats produce modest absolute surprises. Operating cash flow has consistently missed estimates, actual CFO ran 55-93% below analyst forecasts in most quarters, because the company is converting income statement profits into vehicle inventory and financing receivables faster than cash hits the bank.
And at 34 times forward earnings, the stock was priced for perfection near $97, leaving little margin for any narrative friction. The result is a company with genuinely strong operational momentum, yet its stock has dropped 27% despite the business continuing to execute.
See Carvana’s full consensus estimates and price target history on TIKR for free →
What the Valuation Model Says About Carvana Stock
The TIKR valuation model mid-case target comes out to around $124, representing a potential total return of roughly 81% at around 14% annualized over 4.4 years.
The model assumes revenue growing at around 15% annually, net income margins expanding to roughly 5%, and EPS compounding at around 11% per year. Multiple compression of about 7% per year is embedded as the P/E normalizes from a growth-stock premium toward a more mature multiple.
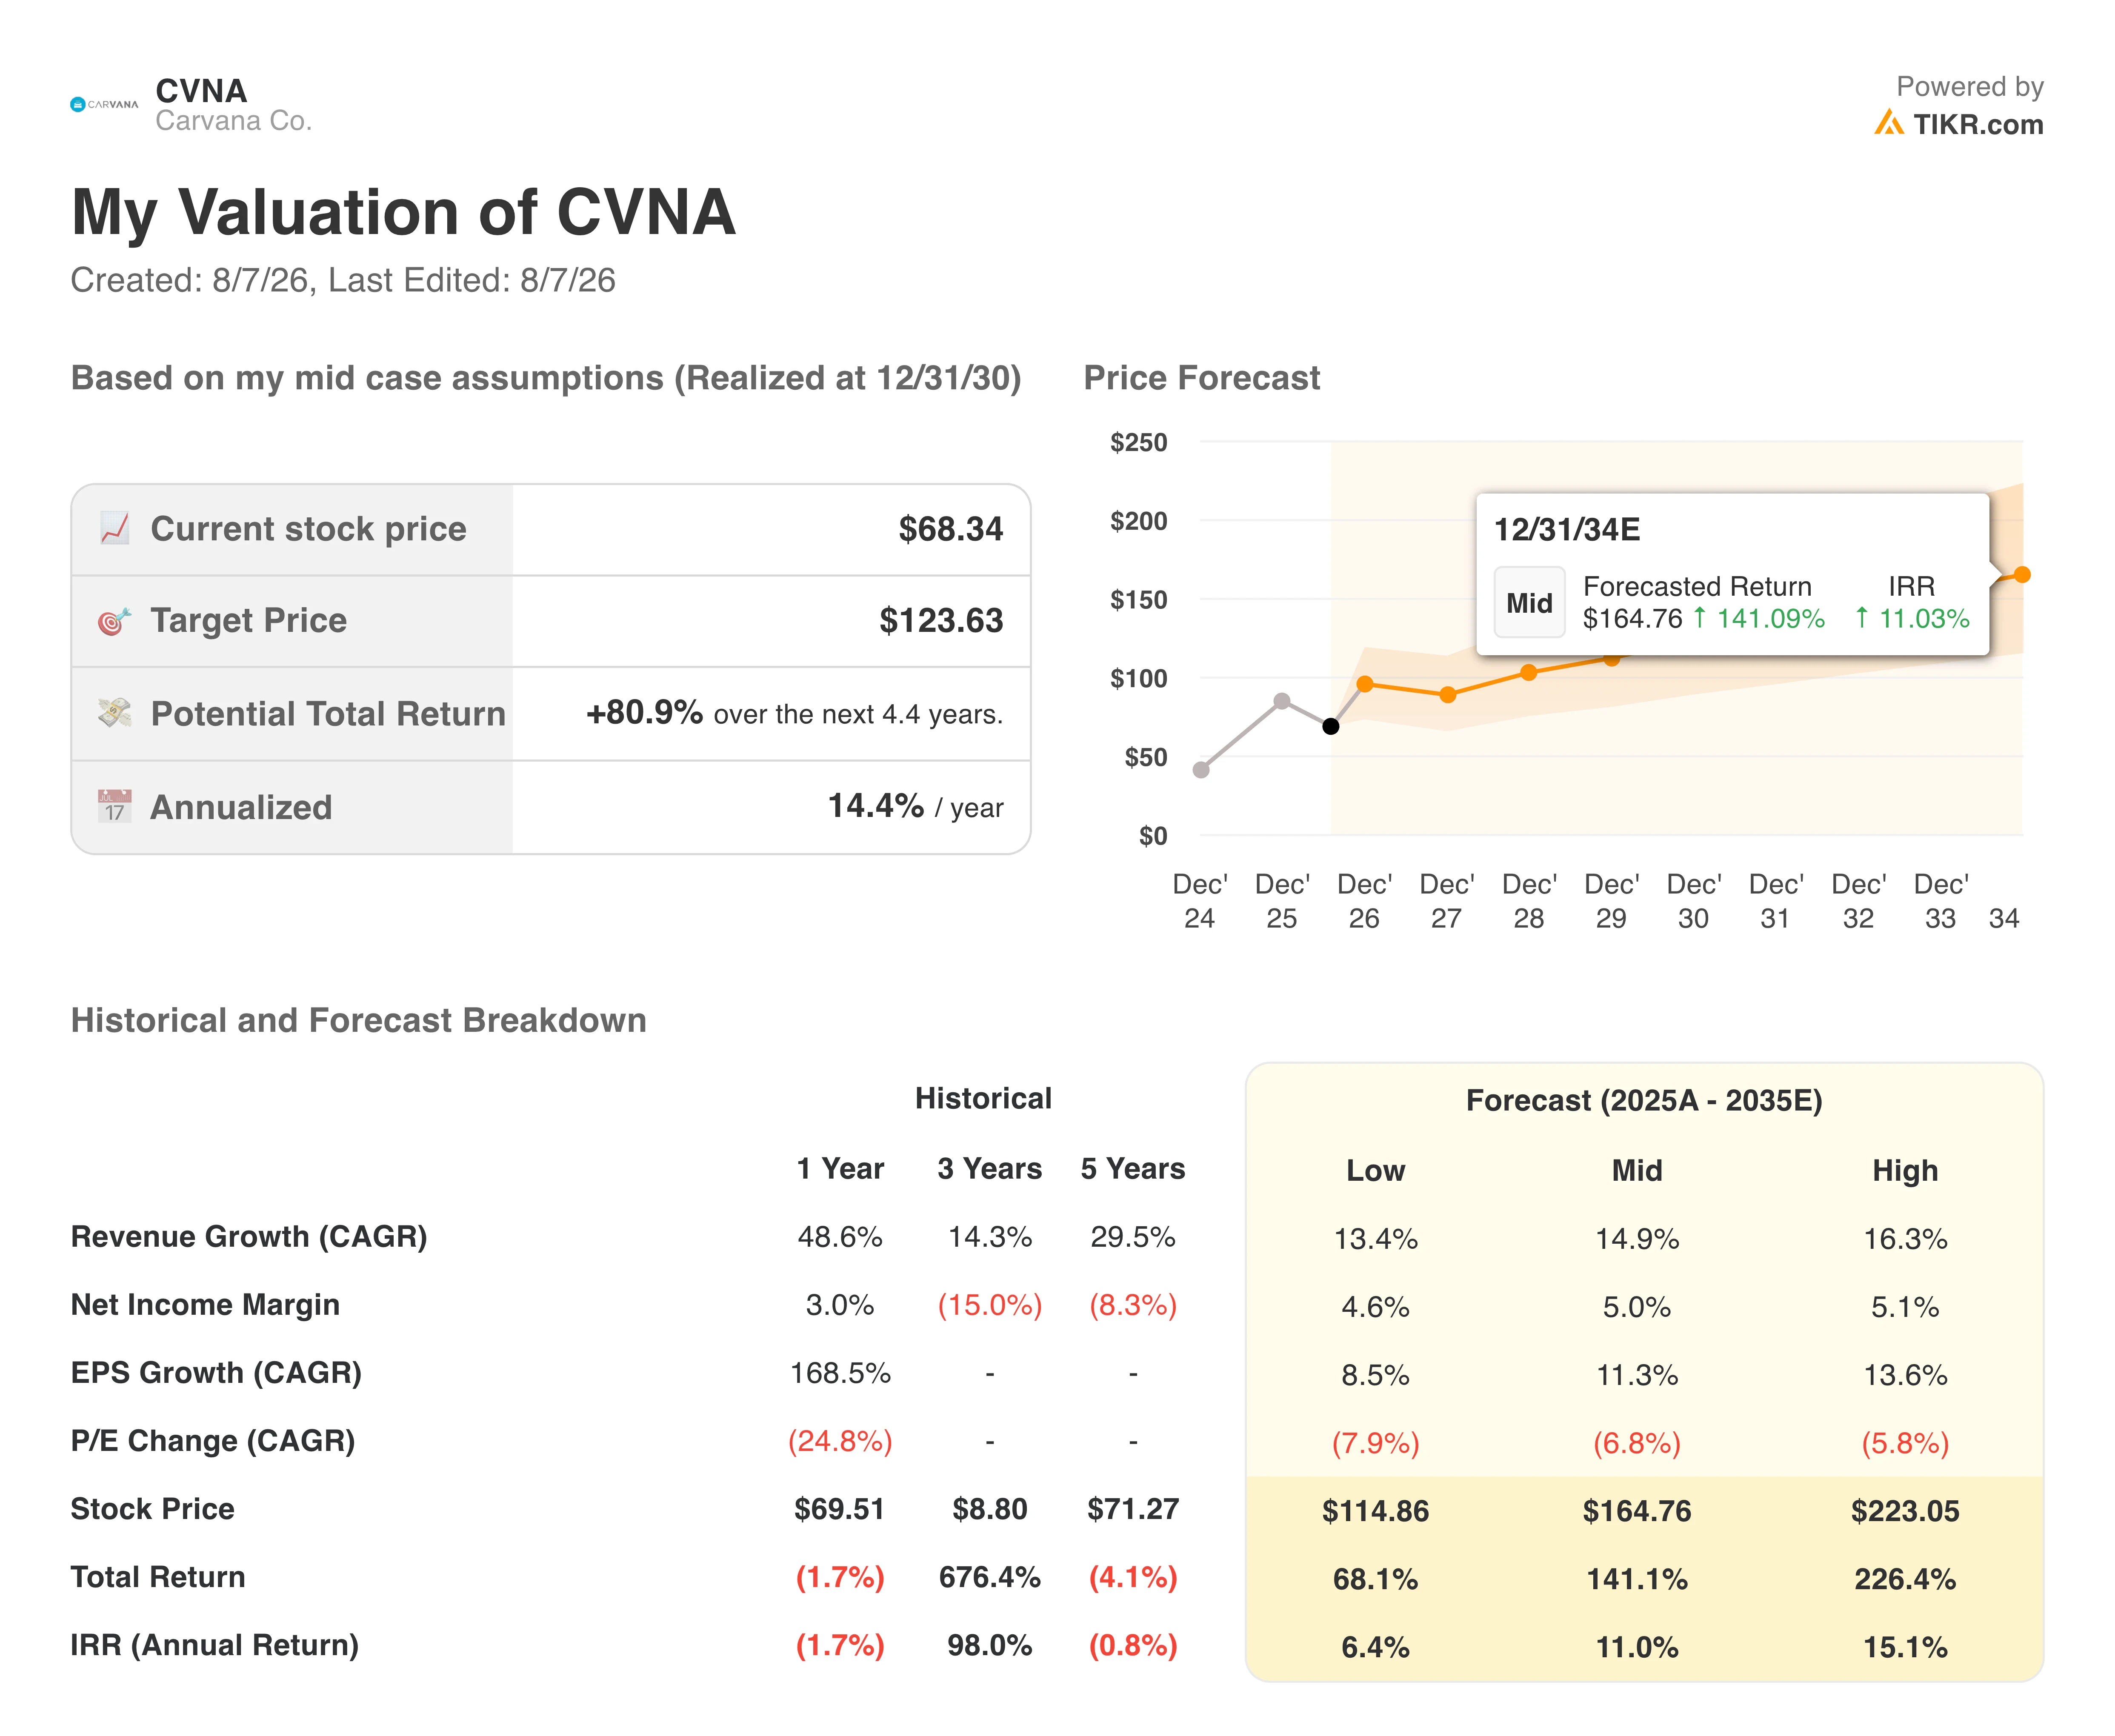
The Street consensus target of around $83 implies roughly 18% upside from current levels. The high case reaches around $223 at roughly 15% annualized, while the low case still reaches around $115 at roughly 6%.
Should You Buy Carvana Stock?
Ten consecutive quarters of growth and profitability is a track record that is hard to dismiss, and the market opportunity in used cars remains enormous given how fragmented the industry is.
The honest counterpoint is that 34 times forward earnings on a business with 5% net income margins and a used car market sensitive to interest rates and consumer confidence is not a conservative entry point.
The pullback from $97 to $70 has made the setup more interesting than it was earlier this year. Investors should understand what they are paying for, though, before acting on the operational momentum alone.
Estimate a company’s fair value instantly (Free with TIKR) >>>
Looking for New Opportunities?
- See which stocks billionaire investors are buying to follow the smart money.
- Analyze stocks in as little as 5 minutes with TIKR’s all-in-one, easy-to-use platform.
- The more rocks you overturn… the more opportunities you’ll uncover. Search 100K+ global stocks, global top investor holdings, and more with TIKR.
Disclaimer:
Please note that the articles on TIKR are not intended to serve as investment or financial advice from TIKR or our content team, nor are they recommendations to buy or sell any stocks. We create our content based on TIKR Terminal’s investment data and analysts’ estimates. Our analysis might not include recent company news or important updates. TIKR has no position in any of the stocks mentioned. Thank you for reading, and happy investing!