
Key Stats for Carnival Stock
- 52-Week Range: $23.45 – $34.03
- Current Price: $28.79
- Street Target Price: ~$35.55
- NTM P/E: ~12x
- YTD Return: -6.9%
- Dividend Yield: 2.3%
- Market Cap: ~$39B
Now Live: Discover how much upside your favorite stocks could have using TIKR’s new Valuation Model (It’s free)>>>
Record Demand, a Raised Guidance, and a Quarter That Was Still Mixed
Carnival (CCL) operates nine cruise brands, including Carnival Cruise Line, Princess Cruises, Holland America, and Cunard, across more than 90 ships and roughly 250,000 lower berths. Fill the ships, charge passengers for cabins and onboard spending, generate EBITDA, and use that cash to pay down the debt that funded survival through the pandemic shutdown.
The distance between where the business operates and where the stock trades is why this stock keeps coming up in investor conversations.
Q2 FY2026, the quarter ended May 31, 2026, was genuinely mixed. Revenue came in at $5.81 billion, essentially flat year over year, and adjusted EPS of $1.18 came in below the $1.27 delivered in Q2 FY2025 as new ship deliveries added capacity ahead of the revenue those ships will eventually generate. The more important signals were underneath those numbers.
Net per diems, revenue per passenger per day, the best indicator of pricing power, rose 5% in constant currency. Record booking volumes were reported across multiple brands. Full-year revenue guidance was raised to approximately $25.3-$25.5 billion, and full-year adjusted EBITDA guidance was lifted to $6.7-$6.8 billion.
The revenue chart puts the scale of the recovery in context.
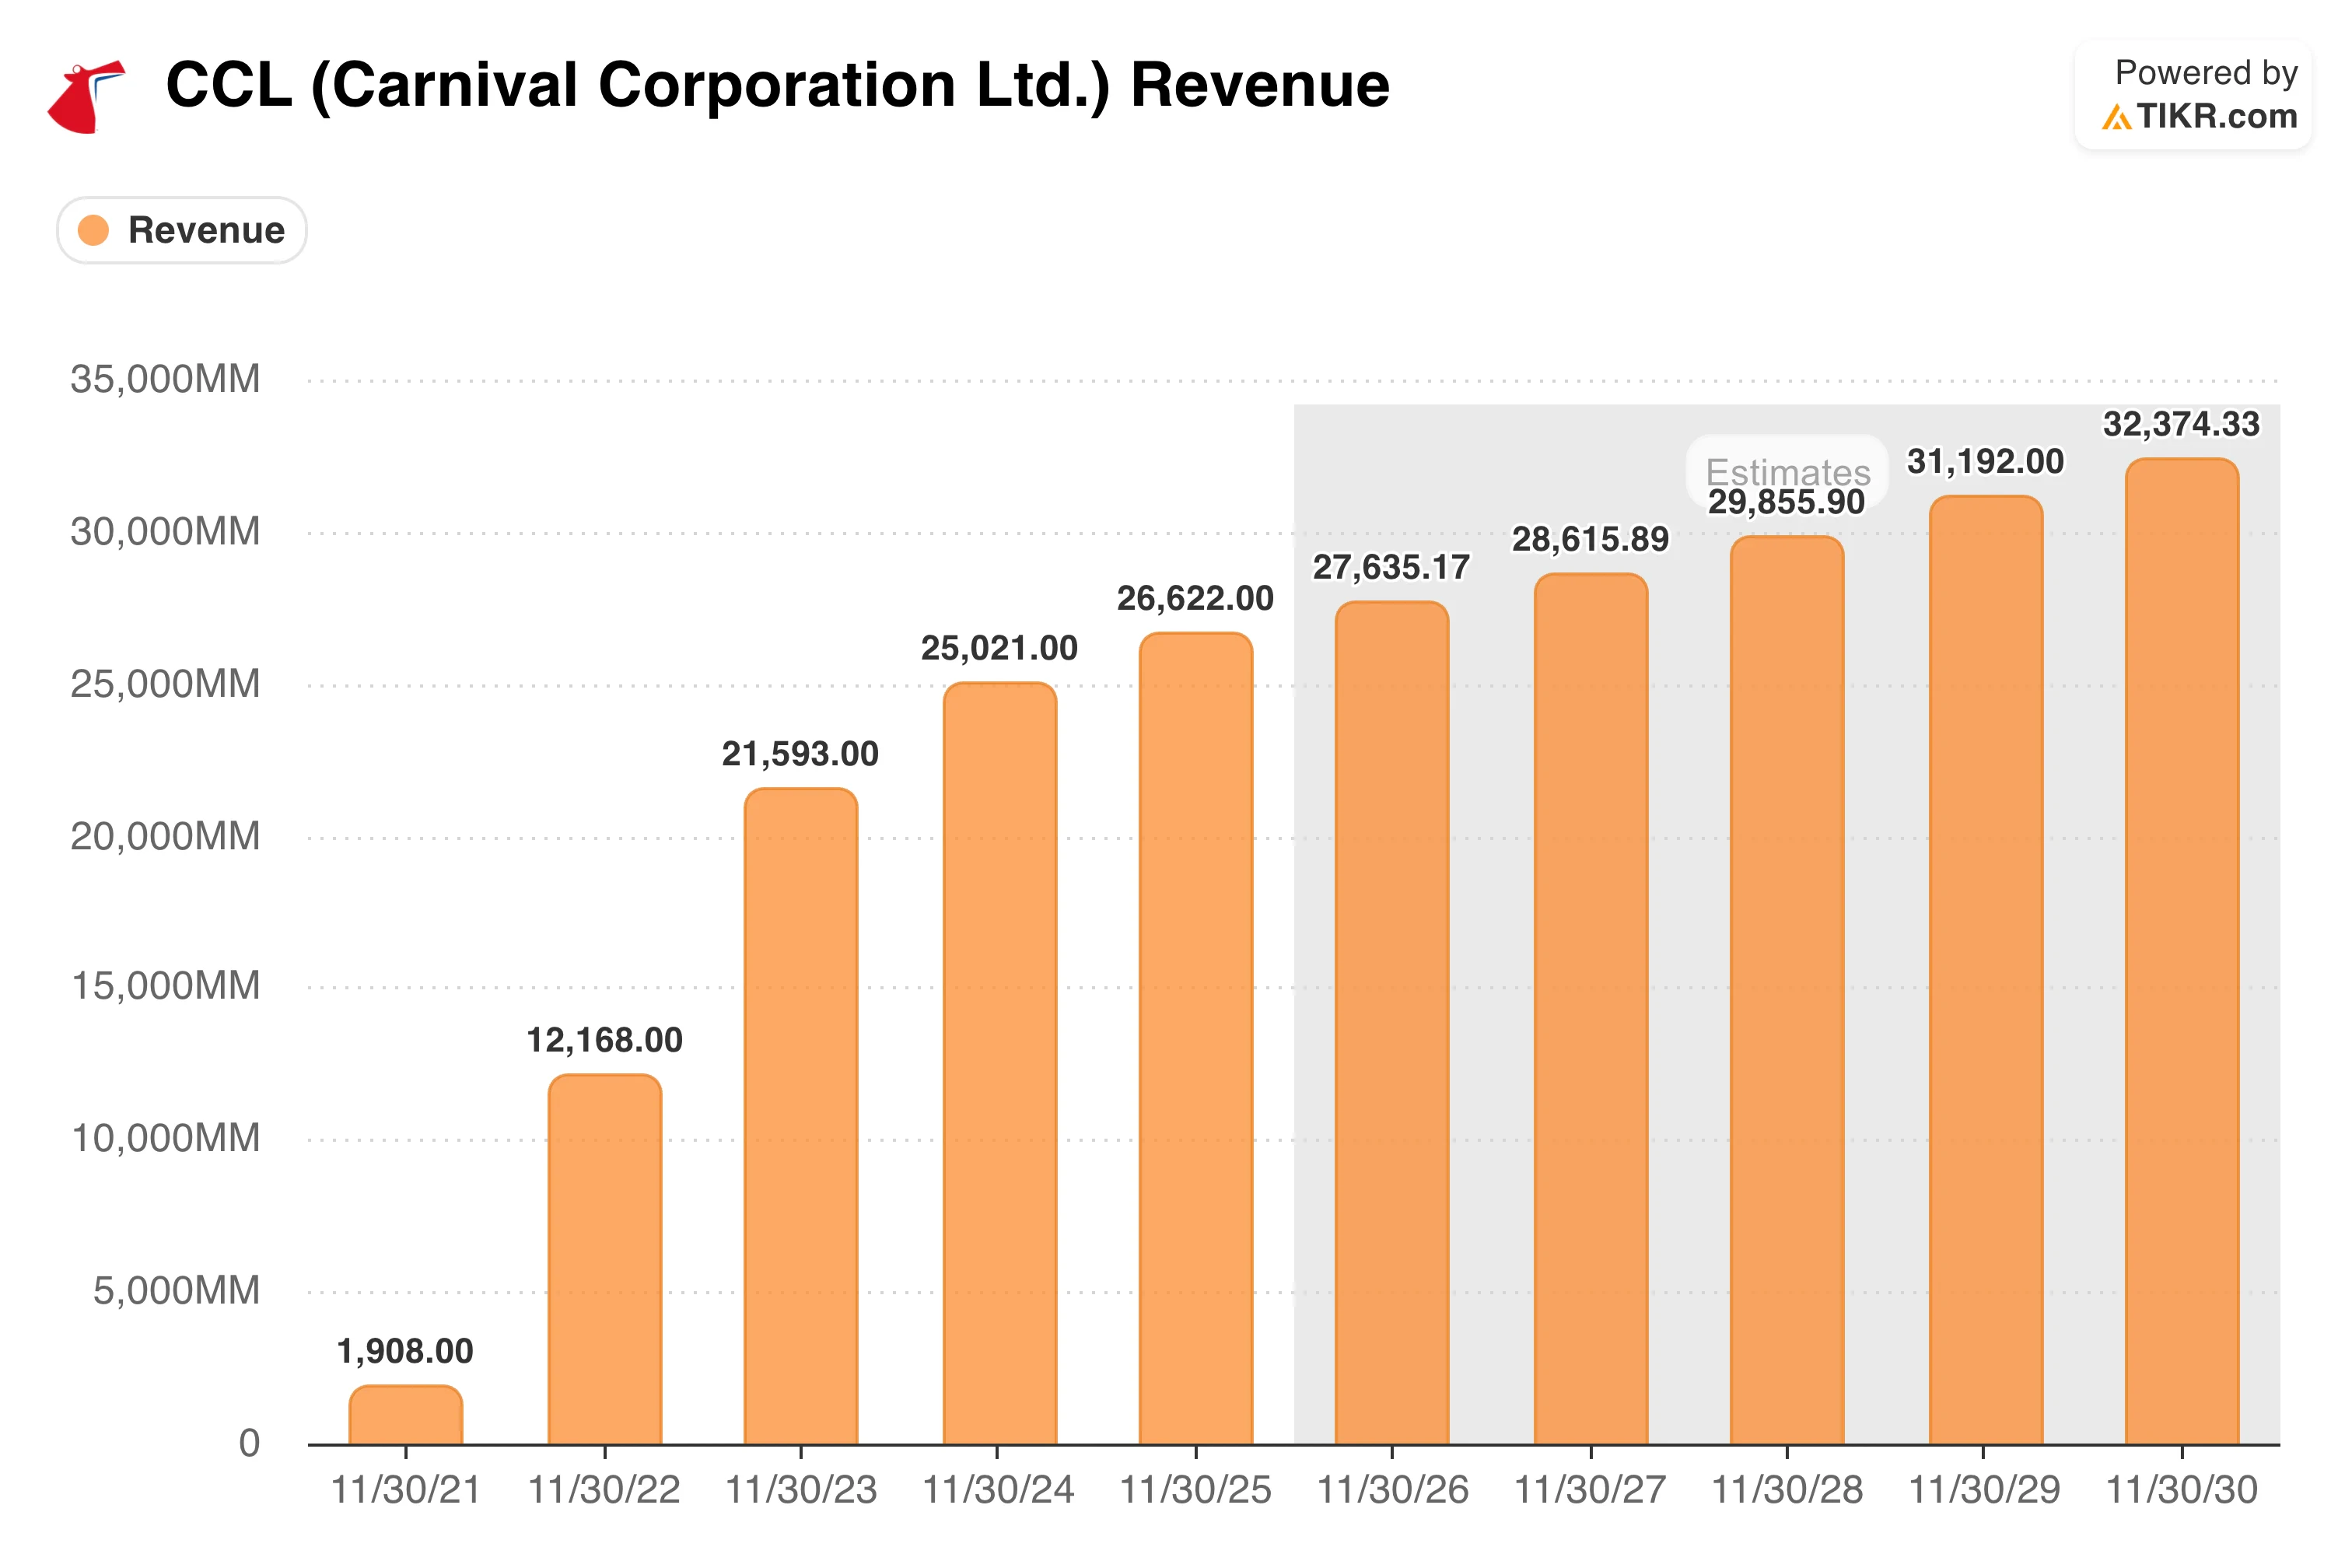
Revenue was just $1.9 billion in FY2021 when ships operated under pandemic restrictions. The ramp since has been among the most dramatic in large-cap history: $12.2 billion in FY2022, $21.6 billion in FY2023, $25.0 billion in FY2024, $26.6 billion in FY2025.
Estimates point to $27.6 billion in FY2026 and $32.4 billion by FY2030. Growth is normalizing from the triple-digit recovery years into a steadier 3-4% annually, the signature of a business that has largely completed its post-pandemic rebuild and entered a more mature phase.
See historical and forward estimates for Carnival stock (It’s free!) >>>
How the Business Economics Have Changed
Revenue growing 14-fold in four years is the headline, but the gross margin chart tells the more important story about what that revenue actually means for the business.

Gross margin was negative 42.4% in FY2021, when ships sat at minimal capacity but still incurred full fuel, crew, port, and maintenance costs. The recovery has been steady: 31.3% in FY2022, 50.1% in FY2023, 53.5% in FY2024, and 55.6% in FY2025.
Rising occupancy and pricing power have improved the economics each year, and the line is still moving. Pre-pandemic, Carnival ran in the 57-60% gross margin range, meaning there is still room to recover before the business fully normalizes.
The debt is the other side of the ledger. Carnival borrowed heavily to survive the shutdown, and the balance sheet has not fully healed. Net debt stands at $23.9 billion at 3.1 times LTM EBITDA.
Management is paying it down steadily, $1.27 billion in operating cash flow in Q2 alone, but the leverage means any demand softening or fuel cost spike hits harder than it would on a cleaner balance sheet.
See how Carnival performs against its peers in TIKR (It’s free!) >>>
What the Valuation Model Says About Carnival Stock
The TIKR valuation model mid-case target comes out to around $53, representing a potential total return of roughly 83% at around 15% annualized over 4.3 years.
The model assumes revenue growing at around 4% annually, net income margins expanding to roughly 13%, and EPS compounding at around 9% per year. A modest P/E re-rating of about 1.5% per year is embedded as debt declines and the market assigns a slightly higher multiple to earnings.
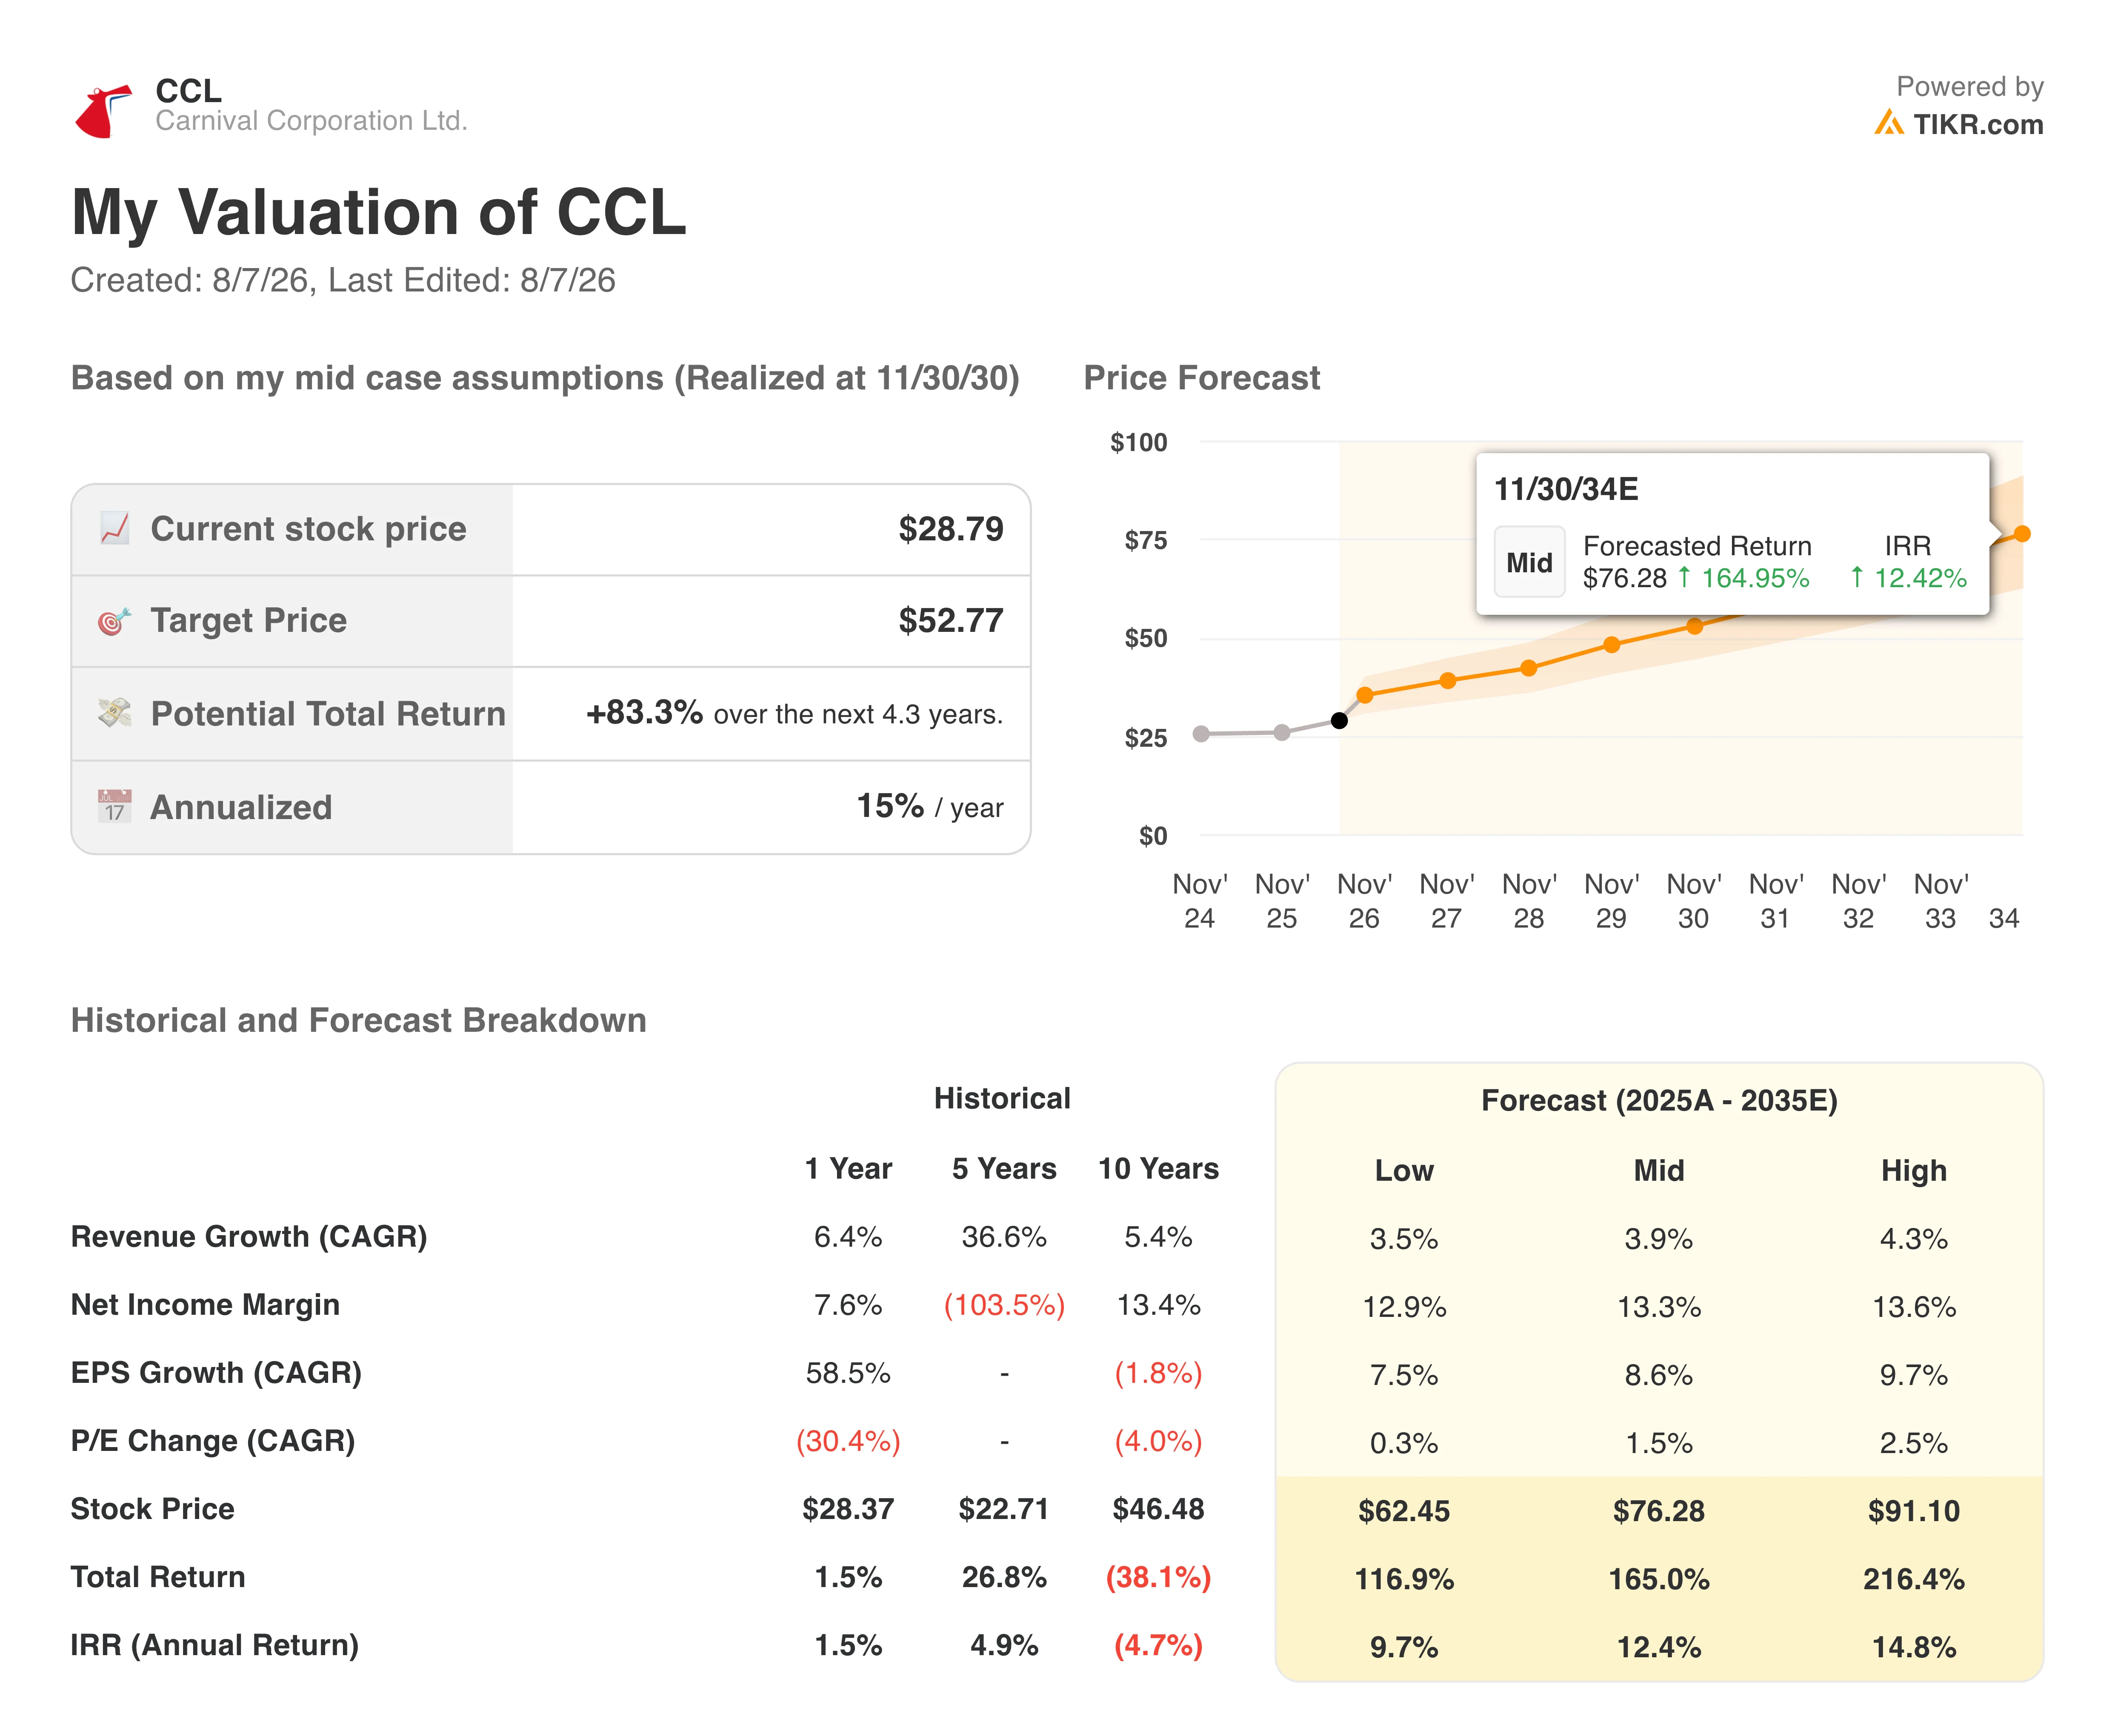
The Street consensus target of around $35.55 implies roughly 24% upside from current levels. The high case reaches around $91 at roughly 14.8% annualized, requiring simultaneous margin recovery to pre-pandemic levels and meaningful debt reduction. The low case still reaches around $62 at roughly 9.7% annualized.
Should You Buy Carnival Stock?
Carnival’s operational recovery is real, with record bookings, rising net per diems, improving margins, and a management team that has raised guidance consistently.
At roughly 12 times forward earnings with a declining debt load and a gross margin that has not yet returned to its pre-pandemic peak, the stock offers a credible path to meaningful returns.
The risks are the debt, fuel cost exposure, and the sensitivity of cruise demand to consumer confidence and geopolitical events. None of those are small, but they appear well understood and already embedded in a valuation the Street thinks is roughly 24% below fair value.
See analysts’ growth forecasts and price targets for Carnival stock (It’s free!) >>>
Looking for New Opportunities?
- See which stocks billionaire investors are buying to follow the smart money.
- Analyze stocks in as little as 5 minutes with TIKR’s all-in-one, easy-to-use platform.
- The more rocks you overturn… the more opportunities you’ll uncover. Search 100K+ global stocks, global top investor holdings, and more with TIKR.
Disclaimer:
Please note that the articles on TIKR are not intended to serve as investment or financial advice from TIKR or our content team, nor are they recommendations to buy or sell any stocks. We create our content based on TIKR Terminal’s investment data and analysts’ estimates. Our analysis might not include recent company news or important updates. TIKR has no position in any of the stocks mentioned. Thank you for reading, and happy investing!