Key Stats for Target Stock
- 52-Week Range: $83.44 – $150.07
- Current Price: $147.08
- Street Target Price: ~$137
- NTM P/E: ~17x
- 1-Yr Return: +39.6%
- Dividend Yield: 3.2%
- Market Cap: ~$67B
Now Live: Discover how much upside your favorite stocks could have using TIKR’s new Valuation Model (It’s free)>>>
A Big EPS Beat, Falling Comparable Sales, and a Tariff Cloud Ahead
Target (TGT) is one of America’s largest general merchandise retailers, selling groceries, household essentials, apparel, home goods, and electronics across roughly 1,960 stores.
The business sits between Walmart on price and specialty retailers on style, a positioning that works well when consumers feel confident and less well when they pull back on discretionary spending, which is precisely the environment Target has been navigating for two years.
Q1 FY2027, the quarter ended May 3, 2026, clearly reflected that tension. Revenue came in at $23.8 billion, down 2.8% year over year, with comparable sales falling 3.8%. Traffic declined, and digital comparable sales also slipped.
What saved the quarter was cost discipline. Adjusted EPS of $2.27 came in well ahead of the $1.72 consensus, as gross margin held at 28.2% and operating expenses were tightly controlled. Full-year adjusted EPS guidance was maintained at $8.80-$9.80.
The bigger overhang is what comes next. Target sources a meaningful share of its discretionary merchandise, apparel, home goods, and seasonal items from China, making it one of the most tariff-exposed large retailers in the country. Management flagged tariff impacts as expected to be significant in the second half of the fiscal year. How significant it is depends on how trade policy evolves, but the exposure is real and difficult to avoid quickly given Target’s supply chain structure.
The gross margin chart shows why the margin trajectory matters so much to this particular story.
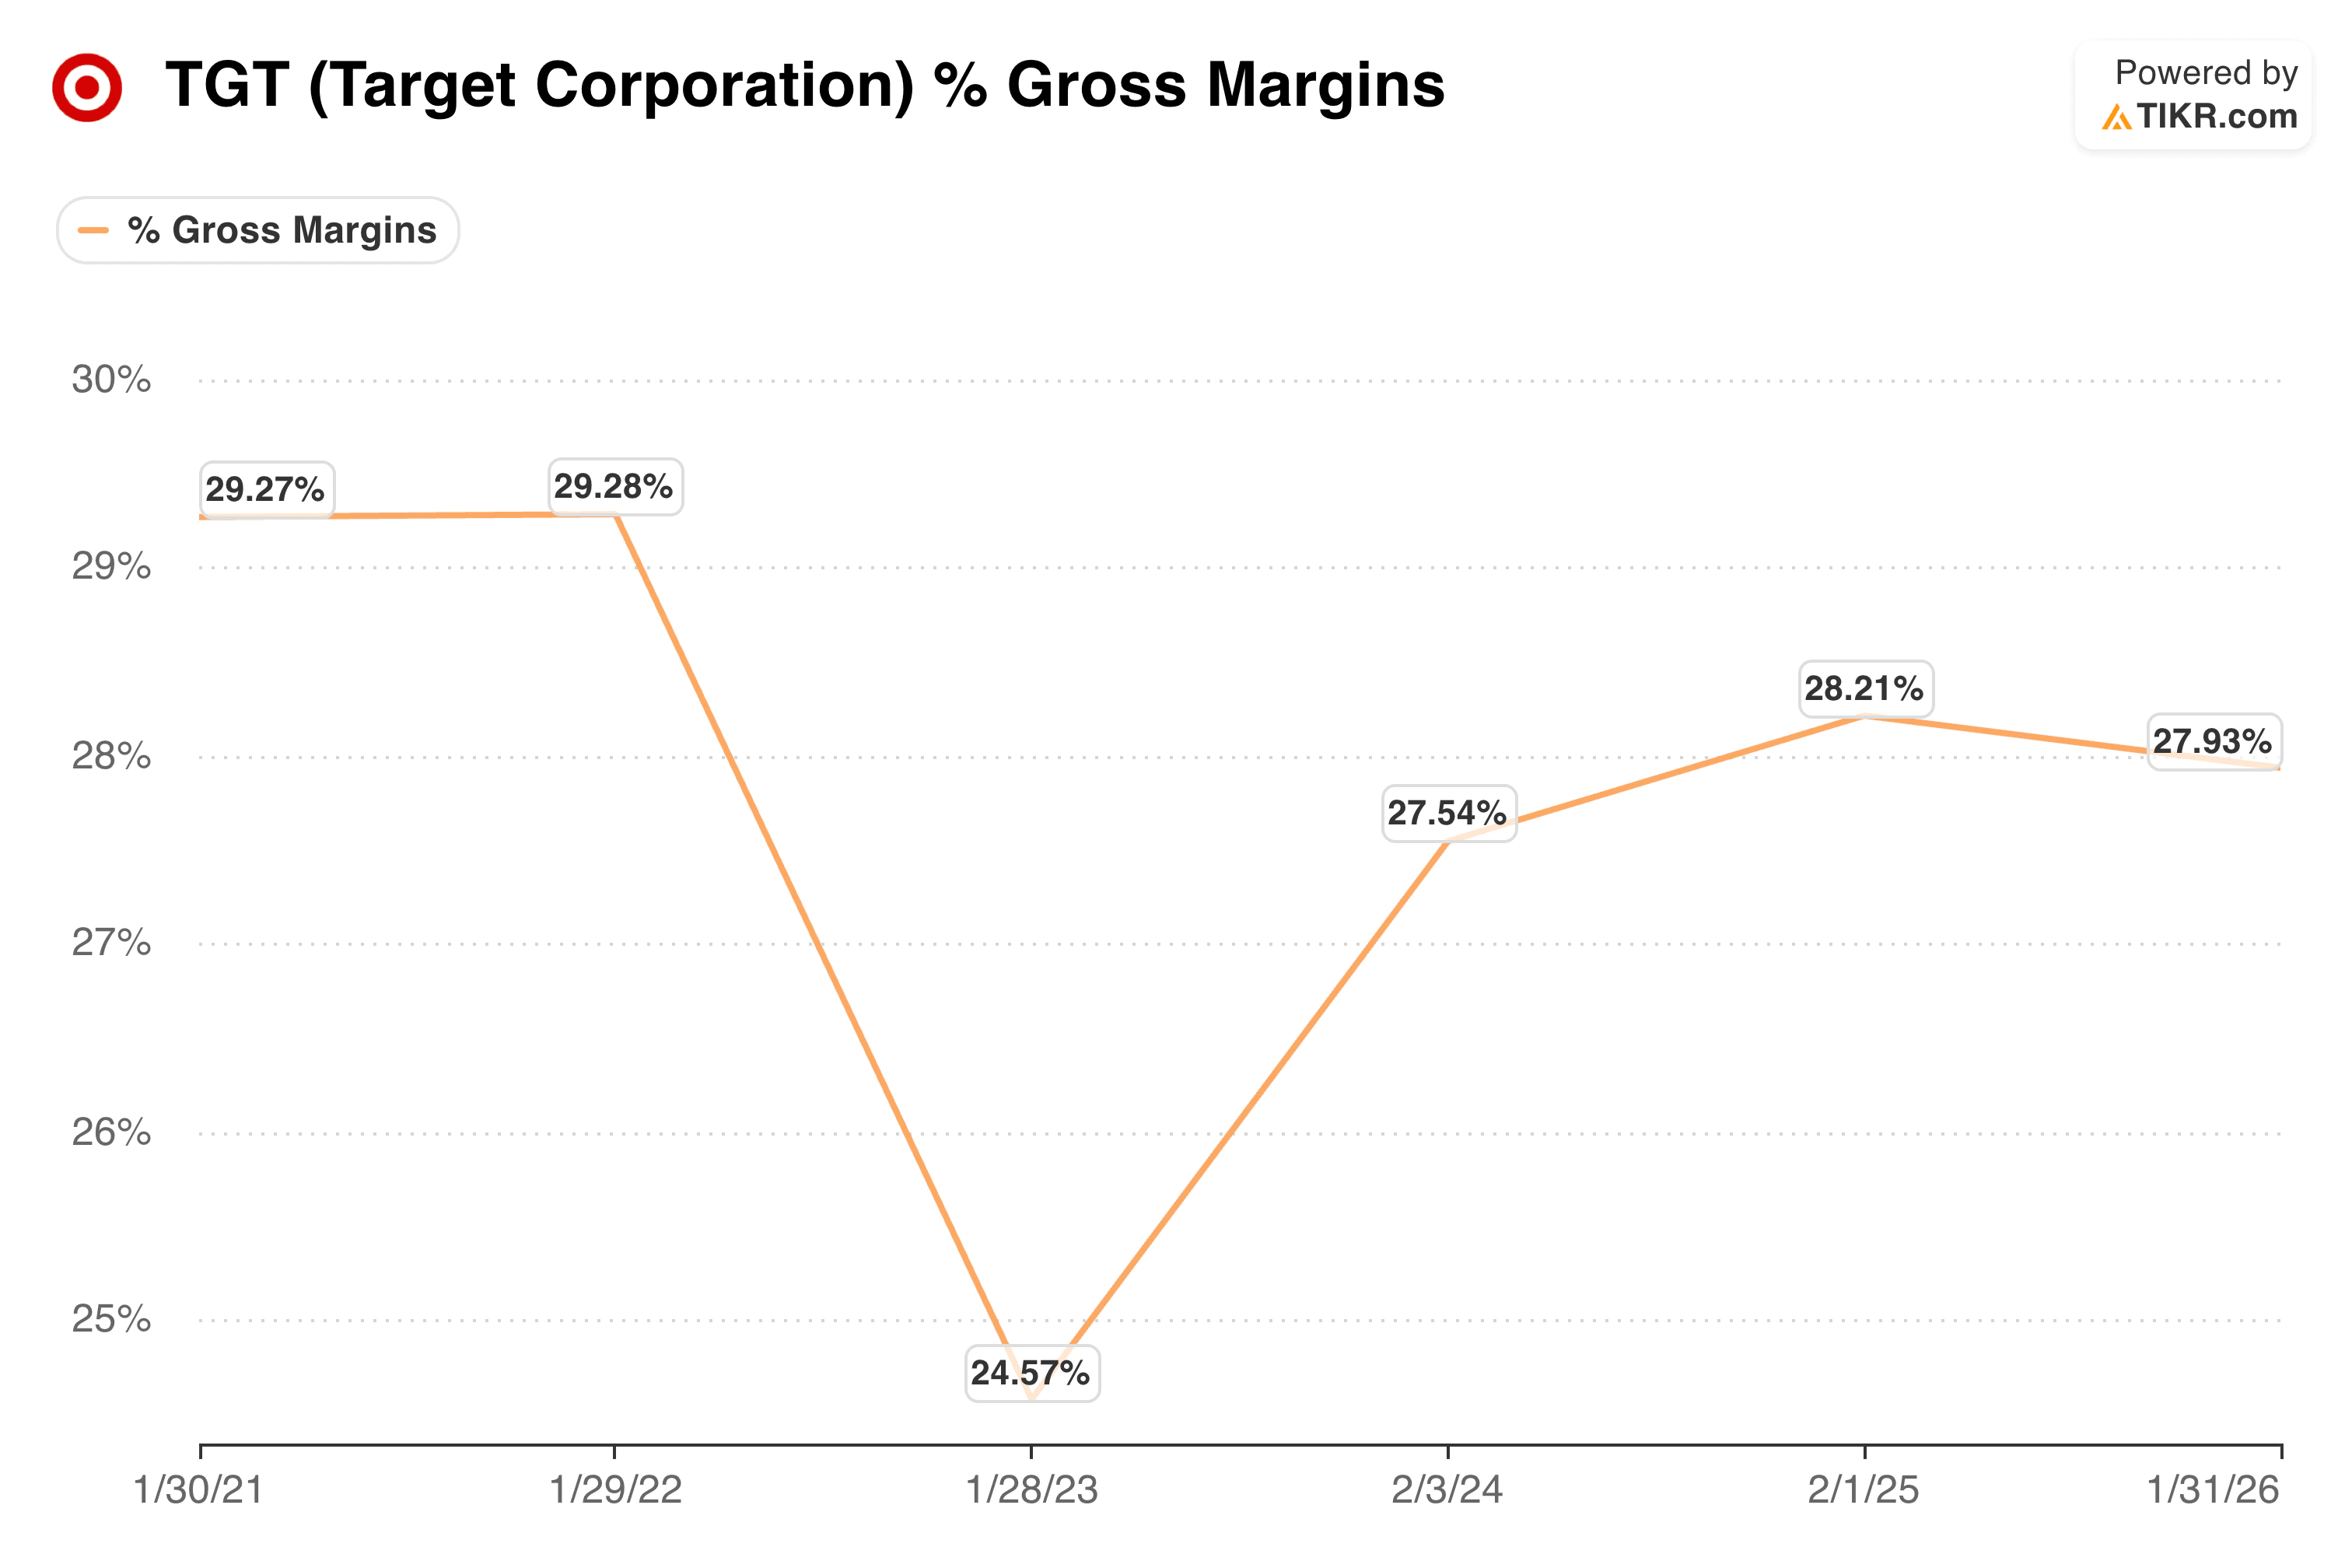
Gross margin ran near 29% in FY2021 and FY2022 before collapsing to 24.6% in FY2023, when Target had aggressively ordered discretionary merchandise that consumers stopped buying and had to be marked down sharply.
Recovery to 28.2% in FY2025 reflects genuine operational improvement, but the current margin still sits roughly 130 basis points below its pre-crisis level. Tariff pressure in the back half of this fiscal year creates real risk that the recovery stalls before it completes.
See historical and forward estimates for Target Corporation stock (It’s free!) >>>
The Earnings Picture That Makes the Valuation Hard to Justify
Here is the uncomfortable math for Target bulls at $147. Current-year adjusted EPS guidance midpoints around $9.30, putting the stock at roughly 16 times current earnings. At first glance, that sounds reasonable. The EPS chart adds necessary context.

EPS peaked at $13.56 in FY2022, collapsed to $6.02 in FY2023, and has recovered slowly to $8.94 in FY2024, $8.86 in FY2025, and then stepped down again to $7.57 in FY2026. The current guidance of $8.80-$9.80 represents a recovery, but still implies Target earning less than it did in FY2021. Consensus estimates show EPS reaching $11.12 by FY2031, only then approaching the prior peak.
Paying 17 times current earnings on a business with declining comparable sales, meaningful tariff exposure, and an earnings trajectory still working back toward previous highs is the core of the valuation concern, and the Street agrees, with a consensus target of around $137, which sits below the current price.
Value your favorite stocks like TGT with 5 years of analysts’ forecasts using TIKR’s new Valuation Model (It’s free) >>>
What the Valuation Model Says About Target Stock
The TIKR valuation model mid-case target comes out to around $183, representing a potential total return of roughly 25% at around 5% annualized over 4.5 years.
The model assumes revenue growing at around 3% annually, net income margins near 3.9%, and EPS compounding at around 6% per year. Multiple expansion is flat in the mid-case, meaning returns are driven almost entirely by modest earnings growth.

Adding the 3.2% dividend yield lifts the total annual return toward 8%, which is more defensible but not a standout case given the risks involved. The high case reaches around $281 at roughly 7.9% annualized, requiring both margin recovery and revenue reacceleration simultaneously.
The low case produces around $195 at just 3.4% annualized, barely ahead of the dividend alone.
Should You Buy Target Stock?
Target’s cost discipline is genuine, the dividend is well-covered, and if tariff headwinds prove more manageable than feared and consumer discretionary spending recovers, earnings could surprise to the upside.
At $147, though, investors are paying a premium multiple on below-peak earnings for a business with negative comparable sales, real tariff exposure, and a Street consensus that already thinks the stock has overshot. The one-year chart looks impressive. The setup underneath it is more complicated.
See the exact moment Wall Street upgrades a stock before the rest of the market piles in — track analyst rating changes in real time with TIKR for free →
Looking for New Opportunities?
- See which stocks billionaire investors are buying to follow the smart money.
- Analyze stocks in as little as 5 minutes with TIKR’s all-in-one, easy-to-use platform.
- The more rocks you overturn… the more opportunities you’ll uncover. Search 100K+ global stocks, global top investor holdings, and more with TIKR.
Disclaimer:
Please note that the articles on TIKR are not intended to serve as investment or financial advice from TIKR or our content team, nor are they recommendations to buy or sell any stocks. We create our content based on TIKR Terminal’s investment data and analysts’ estimates. Our analysis might not include recent company news or important updates. TIKR has no position in any of the stocks mentioned. Thank you for reading, and happy investing!