Key Takeaways
- W. P. Carey yields 6.0% and Healthpeak Properties yields 6.7%, and both raised their 2026 guidance with their second-quarter results.
- Both dividends are well-covered today, at 73% and 72% of fiscal 2025 AFFO, but analysts expect that coverage to move in opposite directions in fiscal 2026.
- Healthpeak’s interest coverage was 1.5x over the last twelve months, against 3.2x for W. P. Carey.
- Both dividends are smaller than they were in fiscal 2020, so how fast each is growing now matters more than its five-year record.
W. P. Carey (WPC) raised its 2026 AFFO guidance on July 28. A week later, Healthpeak Properties (DOC) raised its own 2026 guidance.
That’s good news for anyone hunting income, because both yield more than 6%: 6.0% for W. P. Carey, and 6.7% for Healthpeak, which pays monthly.
But both dividends are smaller than they were in fiscal 2020. So which is the better high-yield dividend stock today?
| Metric | W. P. Carey (WPC) | Healthpeak (DOC) |
|---|---|---|
| Dividend yield | 6.0% | 6.7% |
| Dividend growth, fiscal 2020 to fiscal 2025 | -2.8% a year | -3.8% a year |
| AFFO payout ratio, fiscal 2025 | 73% | 72% |
| AFFO payout ratio, fiscal 2026 consensus | 71% | 78% |
| Net debt/EBITDA (LTM) | 5.69x | 5.44x |
| Interest coverage (LTM) | 3.24x | 1.49x |
| Price/AFFO (NTM) | 11.9x | 12.2x |
W. P. Carey’s dividend is growing again
W. P. Carey’s dividend fell from $4.24 a share in fiscal 2022 to $3.49 in fiscal 2024. It paid $3.62 in fiscal 2025, up 3.7%, and on June 11, 2026, the company raised its quarterly payment to $0.94 a share, 4.4% above the $0.90 it paid a year earlier. On Sept. 18, it raised again, to $0.950, its third raise of 2026.
Management expects the dividend to “continue to grow in line with our AFFO growth while maintaining a conservative payout ratio,” and the record supports that. In fiscal 2020, W. P. Carey paid $4.17 a share against $4.74 of AFFO, an 88% payout ratio. In fiscal 2025, it paid $3.62 against $4.97, a well-covered 73%.
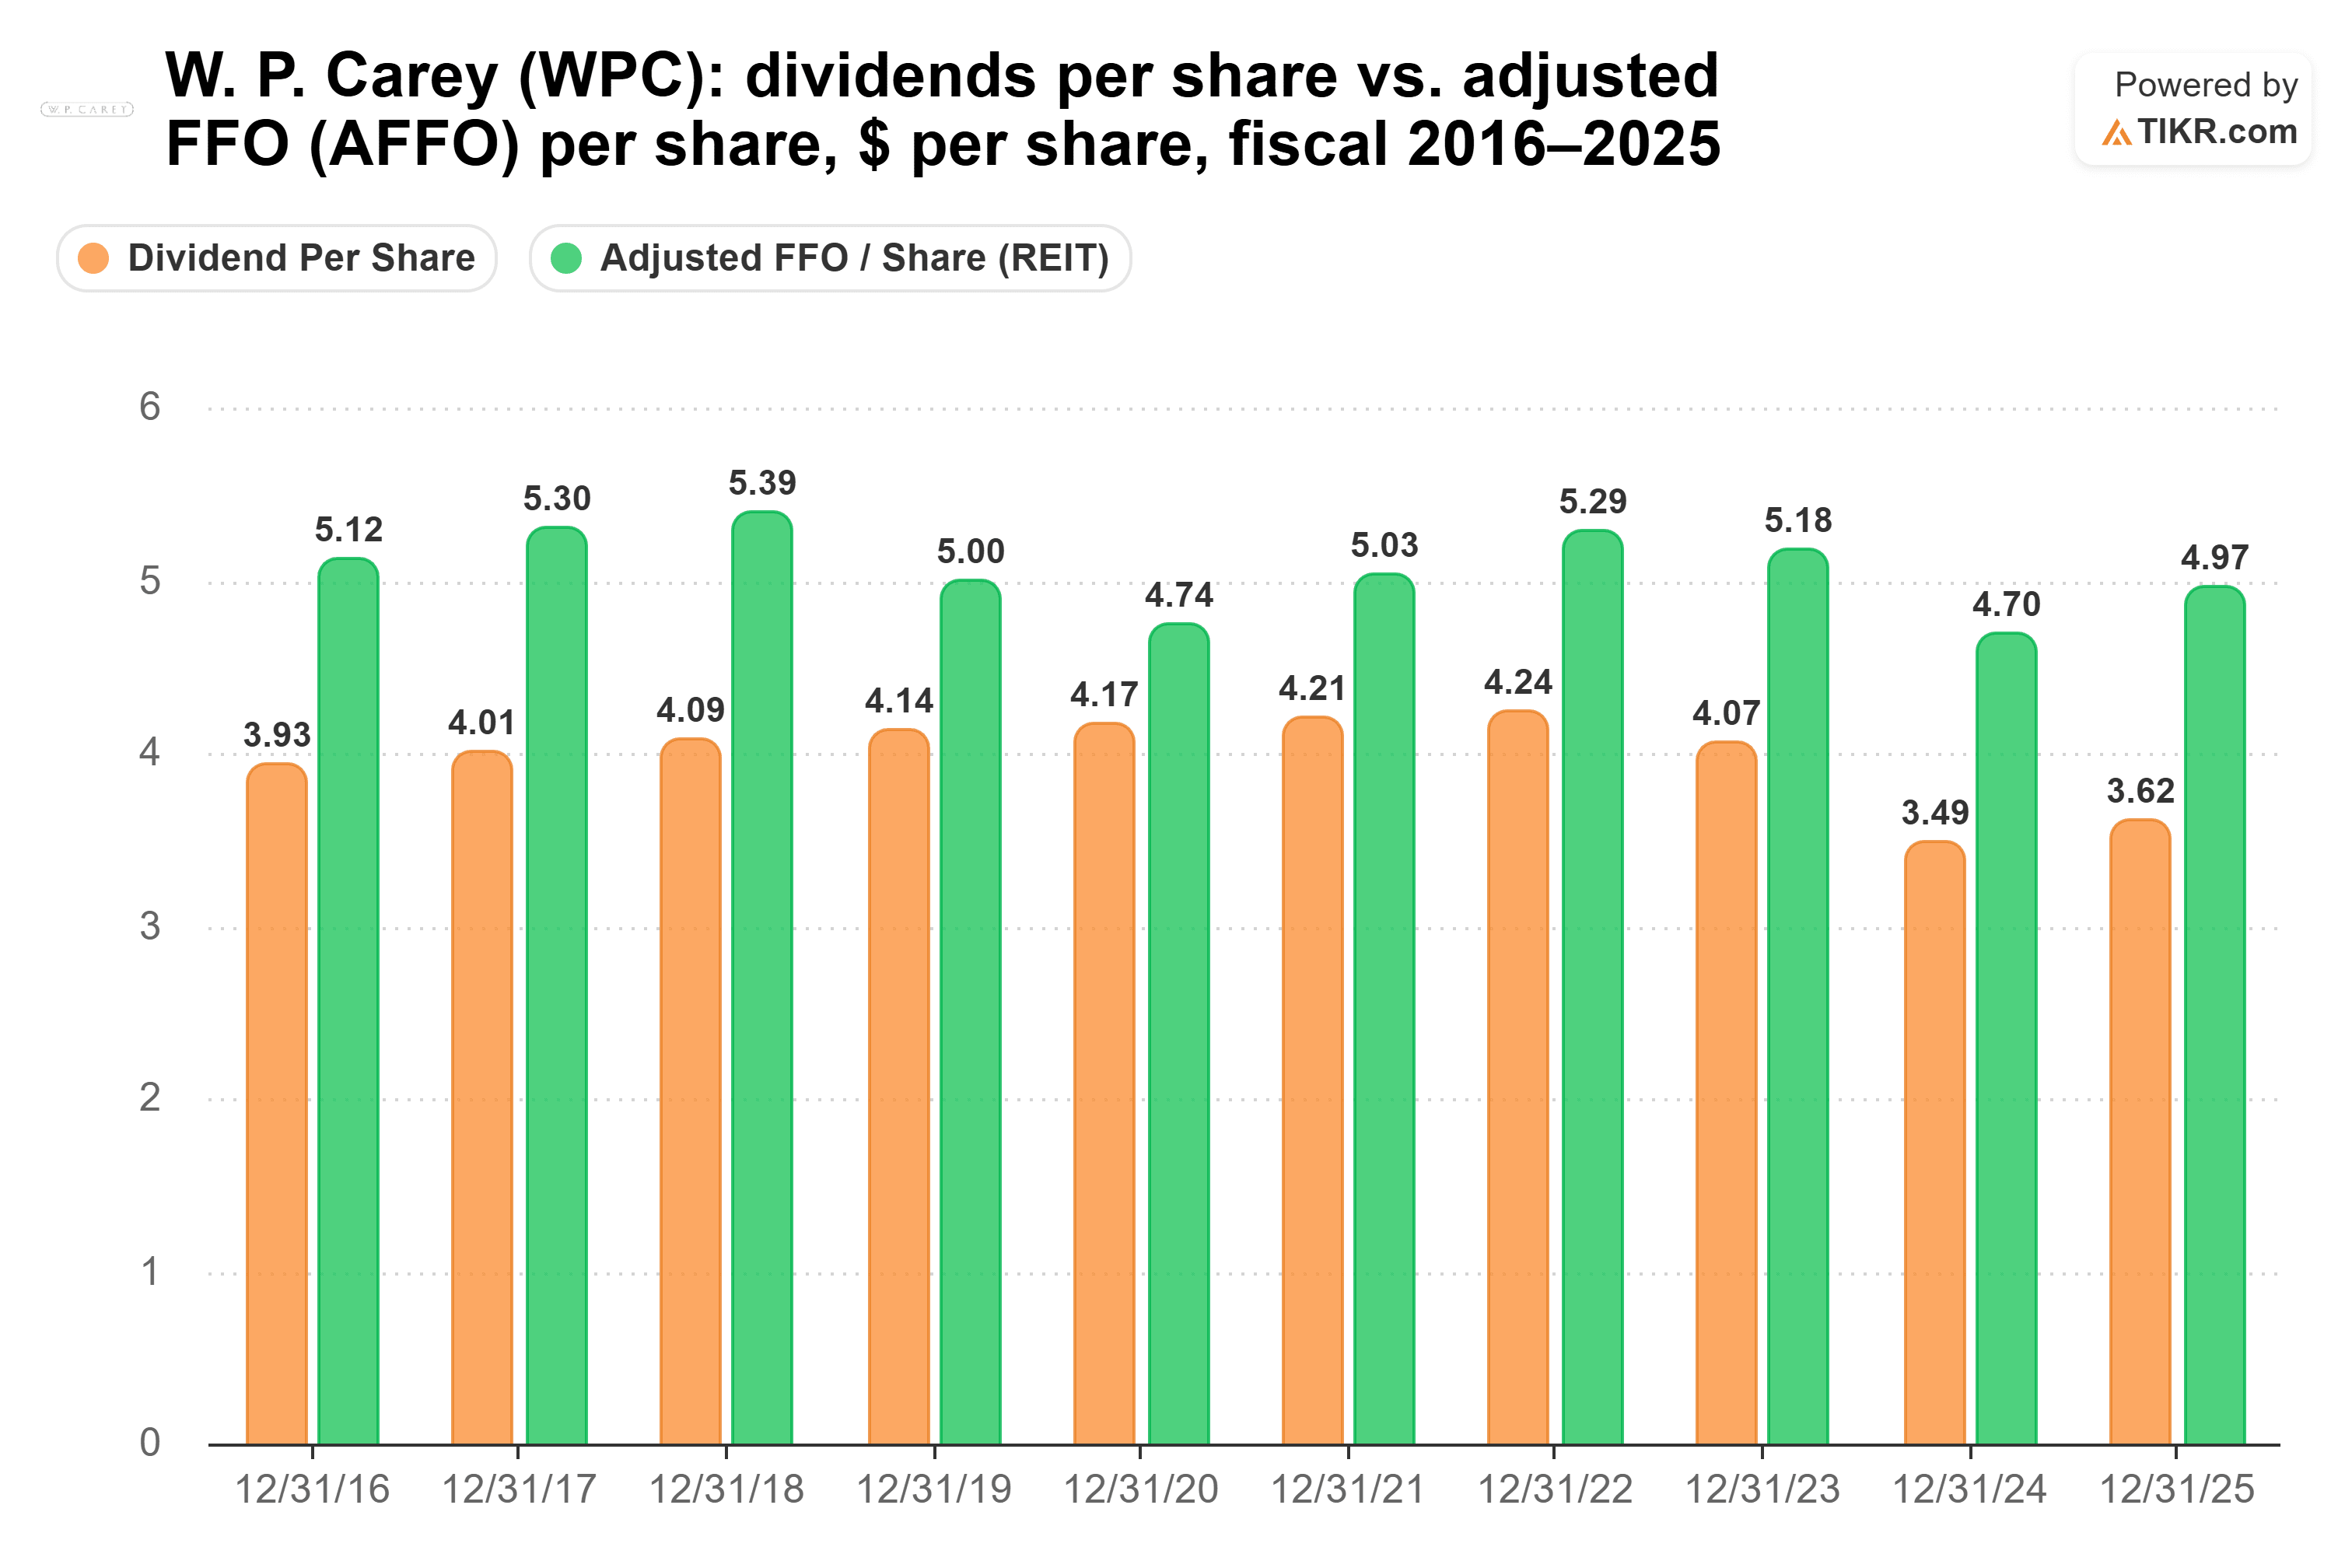
The business is growing too. AFFO rose 4.7% to $1.34 a share in the second quarter of 2026, from $1.28 a year earlier. Management now guides to $5.19 to $5.27 for 2026, which is 5.2% growth at the midpoint. Analysts’ $5.26 consensus would bring the payout ratio down to 71% in fiscal 2026.
The main risk is tenant credit. Hellweg filed for insolvency, although W. P. Carey has already cut its exposure from 35 stores to 16. By Sept. 10, it had signed new leases for about 64% of Hellweg’s rent, and it expects the new rent on the stores it’s re-leasing to come close to what Hellweg paid.
Healthpeak rebuilt its cushion the hard way
Healthpeak’s dividend has had a rougher road than W. P. Carey’s. In fiscal 2020, it paid $1.48 a share against $1.45 of AFFO, a 102% payout ratio. It cut the dividend to $1.20 in fiscal 2021.
Since then, AFFO has climbed from $1.35 a share in fiscal 2021 to $1.69 in fiscal 2025, while the dividend went from $1.20 to $1.22. That brought the payout ratio down to a comfortable 72% in fiscal 2025…

Senior housing is growing fast: revenue at Janus Living rose 45% year over year in the second quarter of 2026. Same-store NOI in lab fell 3.2% year over year in that quarter, though lab occupancy rose 80 basis points from the first quarter to 78.5%.
Analysts expect AFFO to slip to $1.57 a share in fiscal 2026, from $1.69, which would lift the payout ratio to 78%.
The main risk is debt. Healthpeak’s interest coverage was 1.49x over the last twelve months, under half of W. P. Carey’s 3.24x.
So which dividend wins?
W. P. Carey is the better high-yield dividend stock. Analysts expect its AFFO to grow in fiscal 2026 while Healthpeak’s slips, and its dividend is also rising faster.
Healthpeak pays more today: $10,000 buys $670 a year of income, against $600 from W. P. Carey. But both five-year rates include a cut, so the current pace is the better guide. At each dividend’s fiscal 2025 rise, 3.7% for W. P. Carey and 1.7% for Healthpeak, W. P. Carey’s income would pass Healthpeak’s in about 5.5 years, around 2032. In year 10, W. P. Carey would pay about $834 against about $777 from Healthpeak. Call that an 8.3% yield on today’s $10,000.
You don’t pay up for that growth, either. W. P. Carey trades at 11.9x forward price/AFFO. That’s below its 13.5x average over the last five years and well off its 16.9x high in July 2022.

That isn’t to say Healthpeak’s dividend is in trouble. It pays the bigger check, every month, and even the 78% payout ratio analysts expect for fiscal 2026 leaves room. It’s just that W. P. Carey has more of what keeps a dividend growing: rising AFFO, and the interest coverage to carry its debt.
Of course, W. P. Carey said on Sept. 10 that its AFFO is on track to end 2026 above the midpoint of its guidance. If its third-quarter report doesn’t bear that out, Healthpeak’s bigger monthly check gets harder to pass up.
So what is W. P. Carey stock actually worth?
TIKR lets you forecast the future price of any stock in less than a minute. Just enter a few assumptions into TIKR’s valuation model and see what W. P. Carey could be worth. Start from Wall Street consensus estimates, or adjust the inputs to reflect your own view of the business. It’s free to use.
Disclaimer:
Please note that the articles on TIKR are not intended to serve as investment or financial advice from TIKR or our content team, nor are they recommendations to buy or sell any stocks. We create our content based on TIKR Terminal’s investment data and analysts’ estimates. Our analysis might not include recent company news or important updates. TIKR has no position in any of the stocks mentioned. Thank you for reading, and happy investing!