Key Stats for AppLovin Stock
- Pre-Market Price change for AppLovin stock: -14%
- $APP Stock Price as of Aug. 5: $418
- 52-Week High: $746
- $APP Stock Price Target: $656
Now Live: Discover how much upside your favorite stocks could have using TIKR’s new Valuation Model (It’s free)>>>
What Happened?
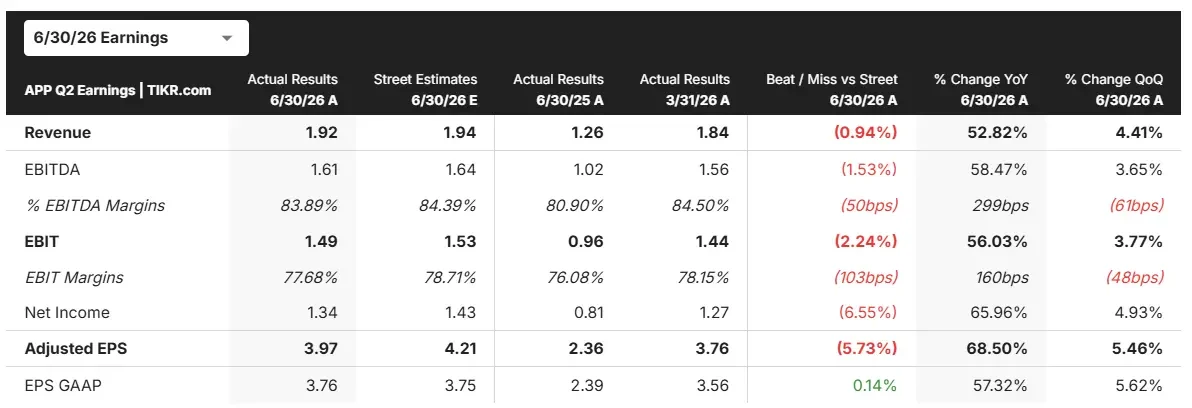
AppLovin (APP) guided Q3 adjusted EBITDA to a range of $1.71 billion to $1.74 billion. Analysts polled by StreetAccount had expected $1.75 billion, so even the high end of the company’s own range fell short. Q2 revenue also came in just slightly below expectations.
Still, the actual numbers for the quarter showed real growth.
- Q2 revenue was $1.92 billion, up from $1.26 billion a year ago, and it was just short of the estimate of $1.94 billion.
- Net income came in at $1.27 billion, compared to $820 million in the same quarter last year.
- Diluted earnings per share rose to $3.76, up from $2.39 a year ago. This was in line with the analyst estimates.
- For the first six months of 2026, revenue totaled $3.77 billion, versus $2.42 billion in the same period last year, with net income climbing to $2.47 billion from $1.40 billion.
So why did AppLovin stock fall so hard despite those growth numbers? The answer comes down to timing on the company’s core advertising technology.
CEO Adam Foroughi explained that AppLovin’s gaming ad business grows mainly through improvements to its underlying models. Better models let advertisers spend more while still hitting their return targets.
This past quarter, those model improvements were smaller and slower than usual, and the next meaningful upgrade landed just after the quarter ended rather than during it.
Foroughi was clear that this wasn’t a sign of weaker demand. He pointed out that publisher earnings on AppLovin’s ad platform grew by double digits from the prior quarter, and the company’s share of publisher ad space stayed steady.
The consumer advertising business, which includes e-commerce clients, actually had a standout quarter. Spending from consumer advertisers hit a record, finishing 28% above the peak levels seen in the Q4 of 2025.
Looking ahead, AppLovin expects Q3 revenue between $2.055 billion and $2.085 billion, which would represent 46% to 48% year-over-year growth.
That guidance already factors in the model improvements that have since gone live, along with higher costs tied to training and running more complex AI systems.
Free cash flow for Q2 came in at $863 million, and the company said cash conversion should improve again in Q3.
See analysts’ growth forecasts and price targets for AppLovin stock (It’s free) >>>
What the Market Is Telling Us About AppLovin Stock
The sharp drop in AppLovin stock shows how much weight investors put on forward guidance, even when trailing results look strong.
A modest miss on Q3 EBITDA expectations was enough to spook the market, despite year-over-year revenue and profit numbers that grew substantially.

Management framed the shortfall as a timing issue tied to when new model improvements rolled out, rather than any change in demand or competitive pressure.
Whether investors accept that explanation will likely depend on whether growth reaccelerates in the current quarter, as the company has forecast.
Estimate a company’s fair value instantly (Free with TIKR) >>>
How Much Upside Does AppLovin Stock Have From Here?
With TIKR’s new Valuation Model tool, you can estimate a stock’s potential share price in under a minute.
All it takes is three simple inputs:
- Revenue Growth
- Operating Margins
- Exit P/E Multiple
If you’re not sure what to enter, TIKR automatically fills in each input using analysts’ consensus estimates, giving you a quick, reliable starting point.
From there, TIKR calculates the potential share price and total returns under Bull, Base, and Bear scenarios so you can quickly see whether a stock looks undervalued or overvalued.
See a stock’s true value in under 60 seconds (Free with TIKR) >>>
Looking for New Opportunities?
- See what stocks billionaire investors are buying so you can follow the smart money.
- Analyze stocks in as little as 5 minutes with TIKR’s all-in-one, easy-to-use platform.
- The more rocks you overturn… the more opportunities you’ll uncover. Search 100K+ global stocks, global top investor holdings, and more with TIKR.
Disclaimer:
Please note that the articles on TIKR are not intended to serve as investment or financial advice from TIKR or our content team, nor are they recommendations to buy or sell any stocks. We create our content based on TIKR Terminal’s investment data and analysts’ estimates. Our analysis might not include recent company news or important updates. TIKR has no position in any stocks mentioned. Thank you for reading, and happy investing!