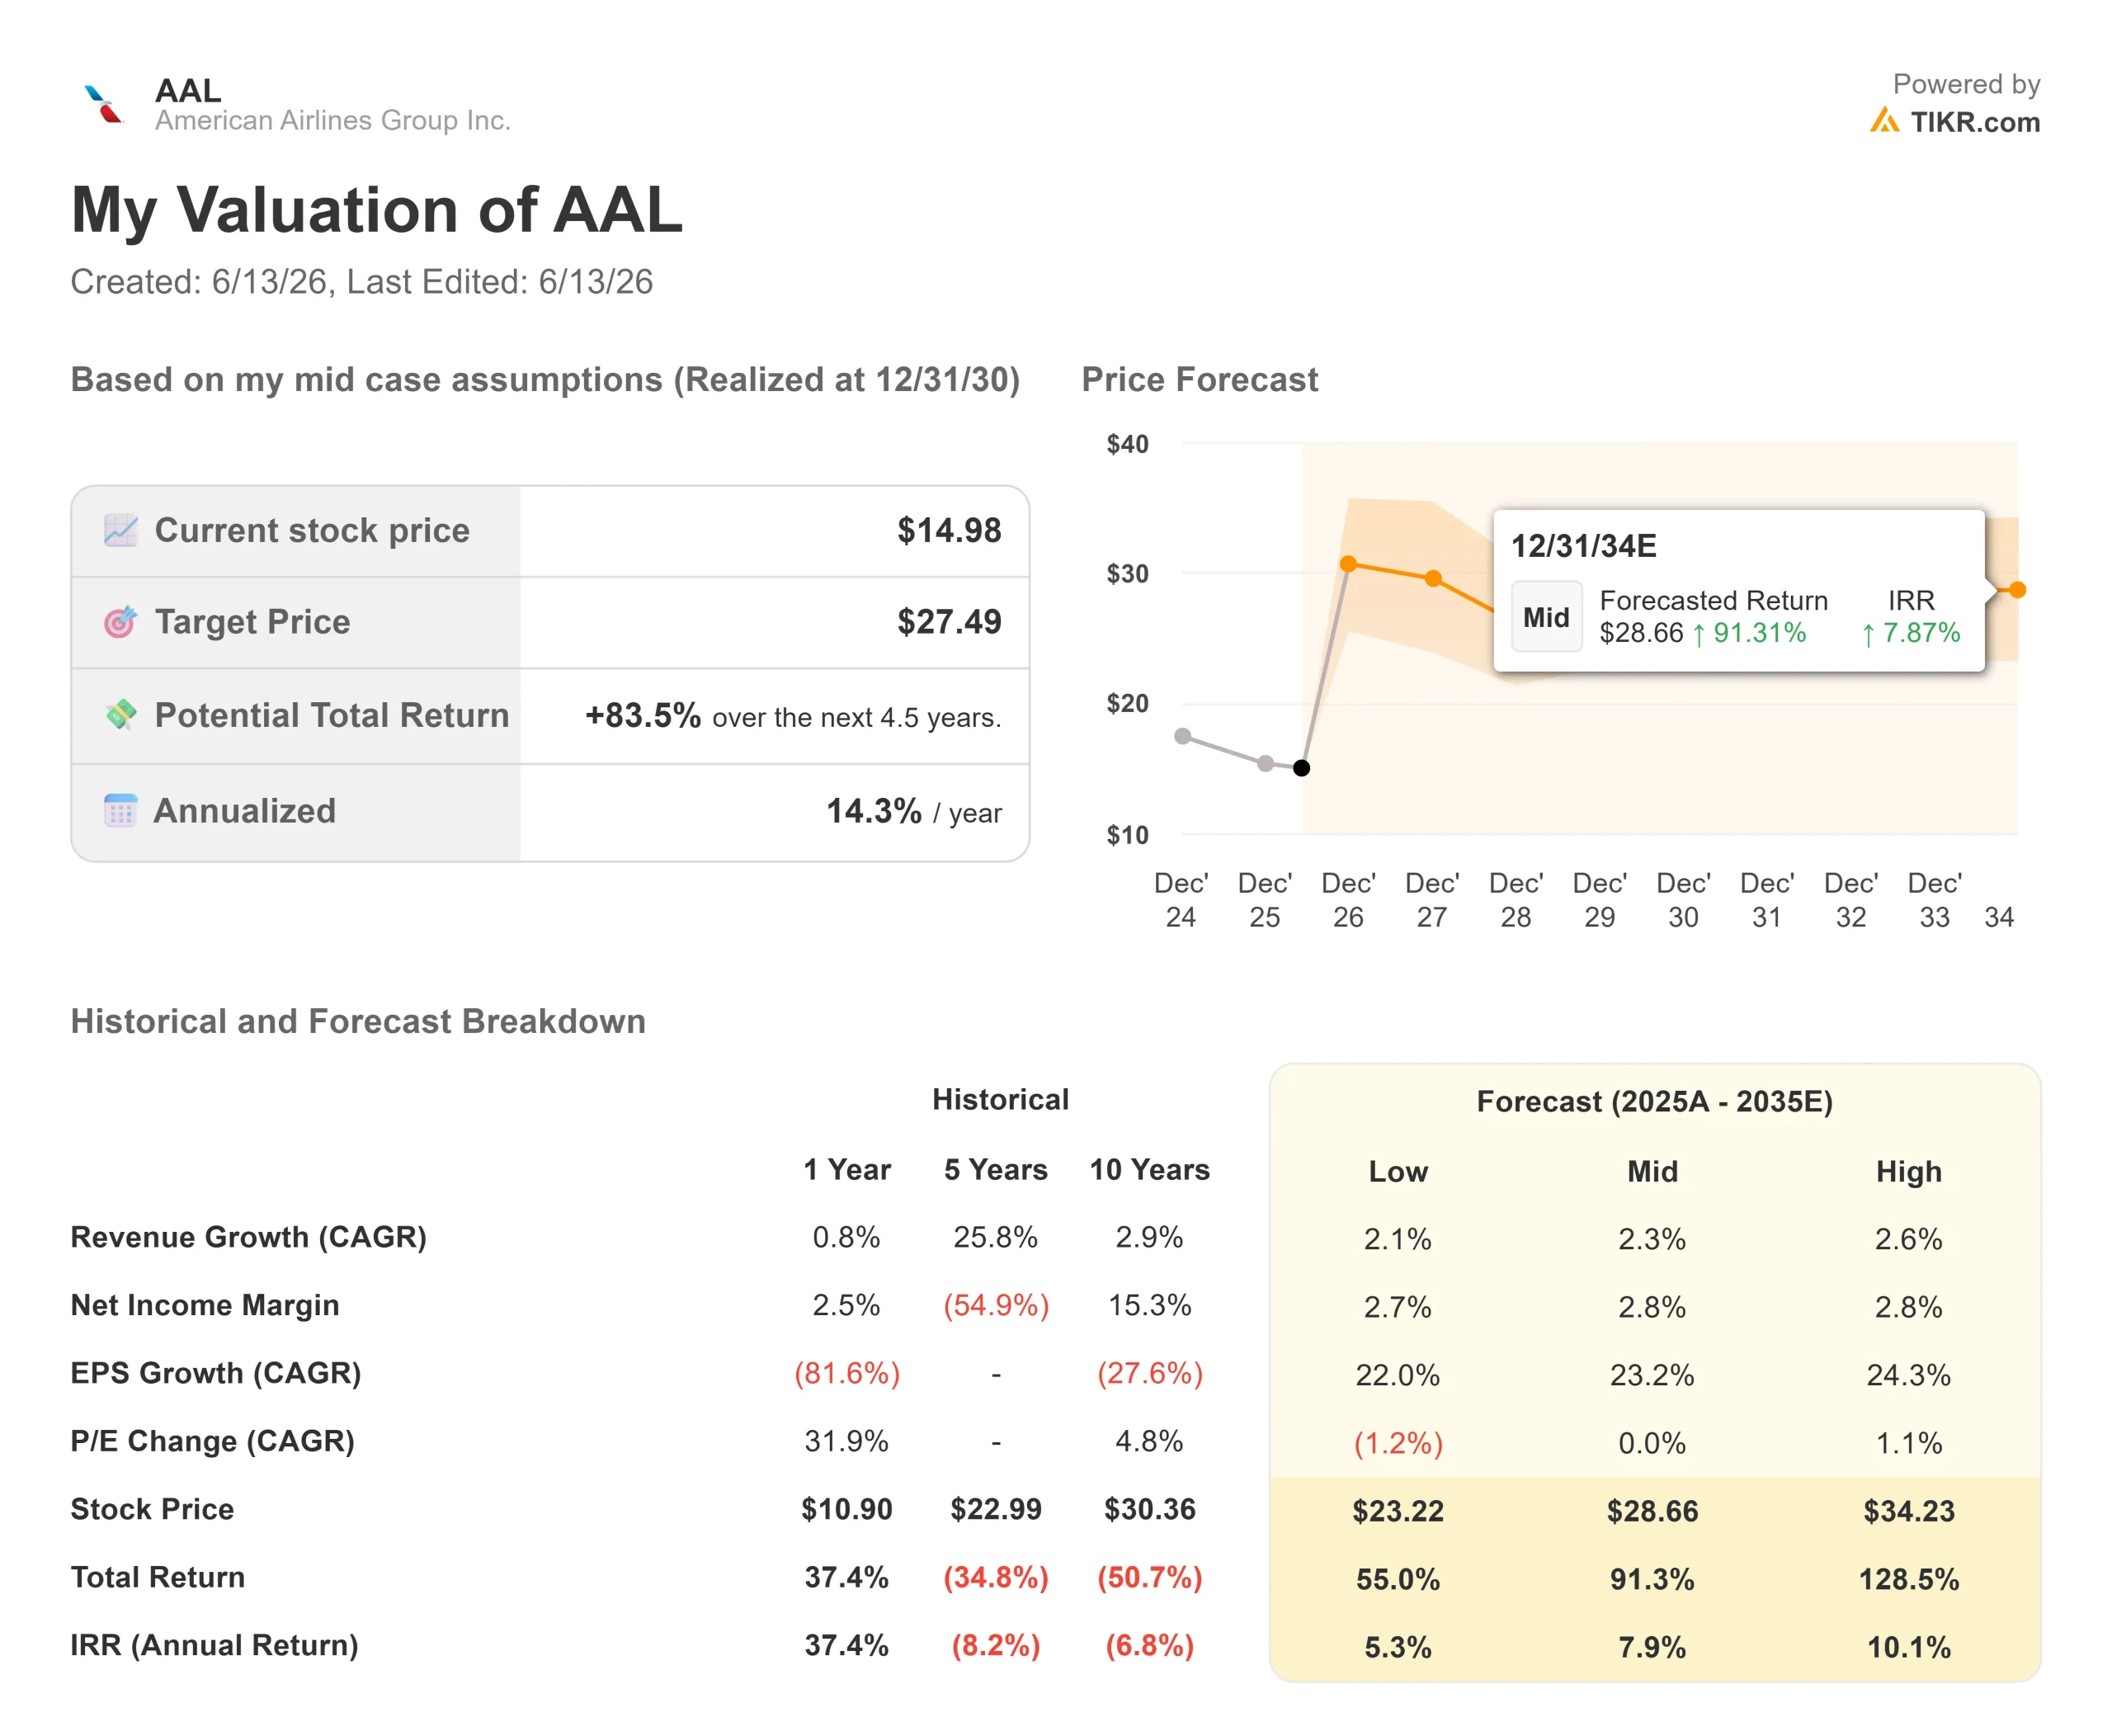
Key Stats for American Airlines Stock
- Current Price: $14.98 (June 12, 2026 close)
- Target Price (Mid): ~$27
- Street Target: ~$16
- Potential Total Return: ~84%
- Annualized IRR: ~14% / year
- Earnings Reaction: +2.72% (April 23, 2026)
- Max Drawdown: 37.39% (March 30, 2026)
Now Live: Discover how much upside your favorite stocks could have using TIKR’s new Valuation Model (It’s free) >>>
What Happened?
American Airlines Group Inc. (AAL) has clawed back nearly half its value since spring, closing at $14.98 after bottoming near its 52-week low of $10.09. Yet the tape is confusing. As the stock recovered, the bad headlines kept coming.
In late May, S&P Dow Jones Indices removed American from the Dow Jones Transportation Average, replacing it with FedEx Freight over the airline’s low share price. On June 10, CFRA cut the stock to Sell with a $12 target, citing fuel exposure and aggressive capacity growth. The same week, the International Air Transport Association cut its 2026 industry profit forecast as the Iran conflict pushed jet fuel higher.
So why has the stock held up? Because bulls and bears are fighting over one number: normalized earnings power.
What the CEO Actually Said
At the June 10 annual meeting, CEO Robert Isom made the bull case in plain math. He said American’s original 2026 guidance implied roughly $2.20 in earnings per share and about $2 billion in pretax profit. “At current valuation multiples, that level of performance would suggest a stock price of around $20 per share,” he told shareholders.
The reason it isn’t, by his account, is fuel. Isom said rising jet fuel prices are now expected to add more than $5 billion to expenses year over year, leaving 2026 earnings roughly flat to 2025. American’s April guidance had pegged the increase at more than $4 billion, so the meeting figure reflects a higher fuel curve. His argument: strip out the fuel spike, and the commercial engine is already delivering.
That engine is American’s four priorities: elevating the customer experience, growing the network, driving premium revenue, and leading in loyalty.
The Merger Door Just Closed
Isom also shut down the United merger speculation that spiked the stock in April. He said American engaged regulators across multiple levels of government and heard consistent feedback that “such a transaction would be a nonstarter.” That matters because the April merger chatter had been treated by some traders as a hidden floor under the stock. With it gone, AAL is a standalone turnaround story or nothing.
The fundamentals show why this is a leveraged bet. American carries about $27 billion in net debt at 2.99x EBITDA, with a thin 3.3% operating margin. That leverage cuts both ways. Small margin gains move the equity hard, but a prolonged fuel spike leaves little cushion. Analysts are split, with 13 buy-equivalent ratings against 11 holds and 2 sell-side calls, and the Street target near $16 sits just above today’s price.


See historical and forward estimates for American Airlines stock (It’s free!) >>>
TIKR Advanced Model Analysis
- Current Price: $14.98
- Target Price (Mid): ~$27
- Potential Total Return: ~84%
- Annualized IRR: ~14% / year
See analysts’ growth forecasts and price targets for American Airlines stock (It’s free!) >>>
The TIKR Valuation Model uses the mid case, realized at year-end 2030, and points to a target of around $27. The two revenue drivers are modest network revenue growth of roughly 2% to 3% a year and rising high-margin loyalty income as the new co-brand deal scales. The margin driver is operating-margin recovery as fuel normalizes off 2026 highs, which the model expects to lift earnings per share at roughly 23% a year.
The upside: if fuel eases and premium plus loyalty revenue holds, the stock compounds toward the high-$20s. The downside: with leverage near 3x and margins this thin, a sustained fuel shock pushes earnings toward breakeven and the equity with them. The primary risk is fuel.
Conclusion
The thesis turns on domestic unit revenue at the Q2 report this summer. Management guided for double-digit domestic RASM (revenue per available seat mile) growth. If that lands and fuel recapture tracks management’s plan, the path back toward Isom’s $20 gets credible. If domestic unit revenue disappoints while fuel stays elevated, the bears who pushed AAL out of the Dow look right.
See what stocks billionaire investors are buying so you can follow the smart money with TIKR.
Should You Invest in American Airlines?
The only way to really know is to look at the numbers yourself. TIKR gives you free access to the same institutional-quality financial data that professional analysts use to answer exactly that question.
Pull up American Airlines, and you’ll see years of historical financials, what Wall Street analysts expect for revenue and earnings in the quarters ahead, how valuation multiples have moved over time, and whether price targets are trending up or down.
You can build a free watchlist to track American Airlines alongside every other stock on your radar. No credit card required. Just the data you need to decide for yourself.
Analyze American Airlines on TIKR Free →
Looking for New Opportunities?
- See what stocks billionaire investors are buying so you can follow the smart money.
- Analyze stocks in as little as 5 minutes with TIKR’s all-in-one, easy-to-use platform.
- The more rocks you overturn… the more opportunities you’ll uncover. Search 100K+ global stocks, global top investor holdings, and more with TIKR.
Disclaimer:
Please note that the articles on TIKR are not intended to serve as investment or financial advice from TIKR or our content team, nor are they recommendations to buy or sell any stocks. We create our content based on TIKR Terminal’s investment data and analysts’ estimates. Our analysis might not include recent company news or important updates. TIKR has no position in any stocks mentioned. Thank you for reading, and happy investing!