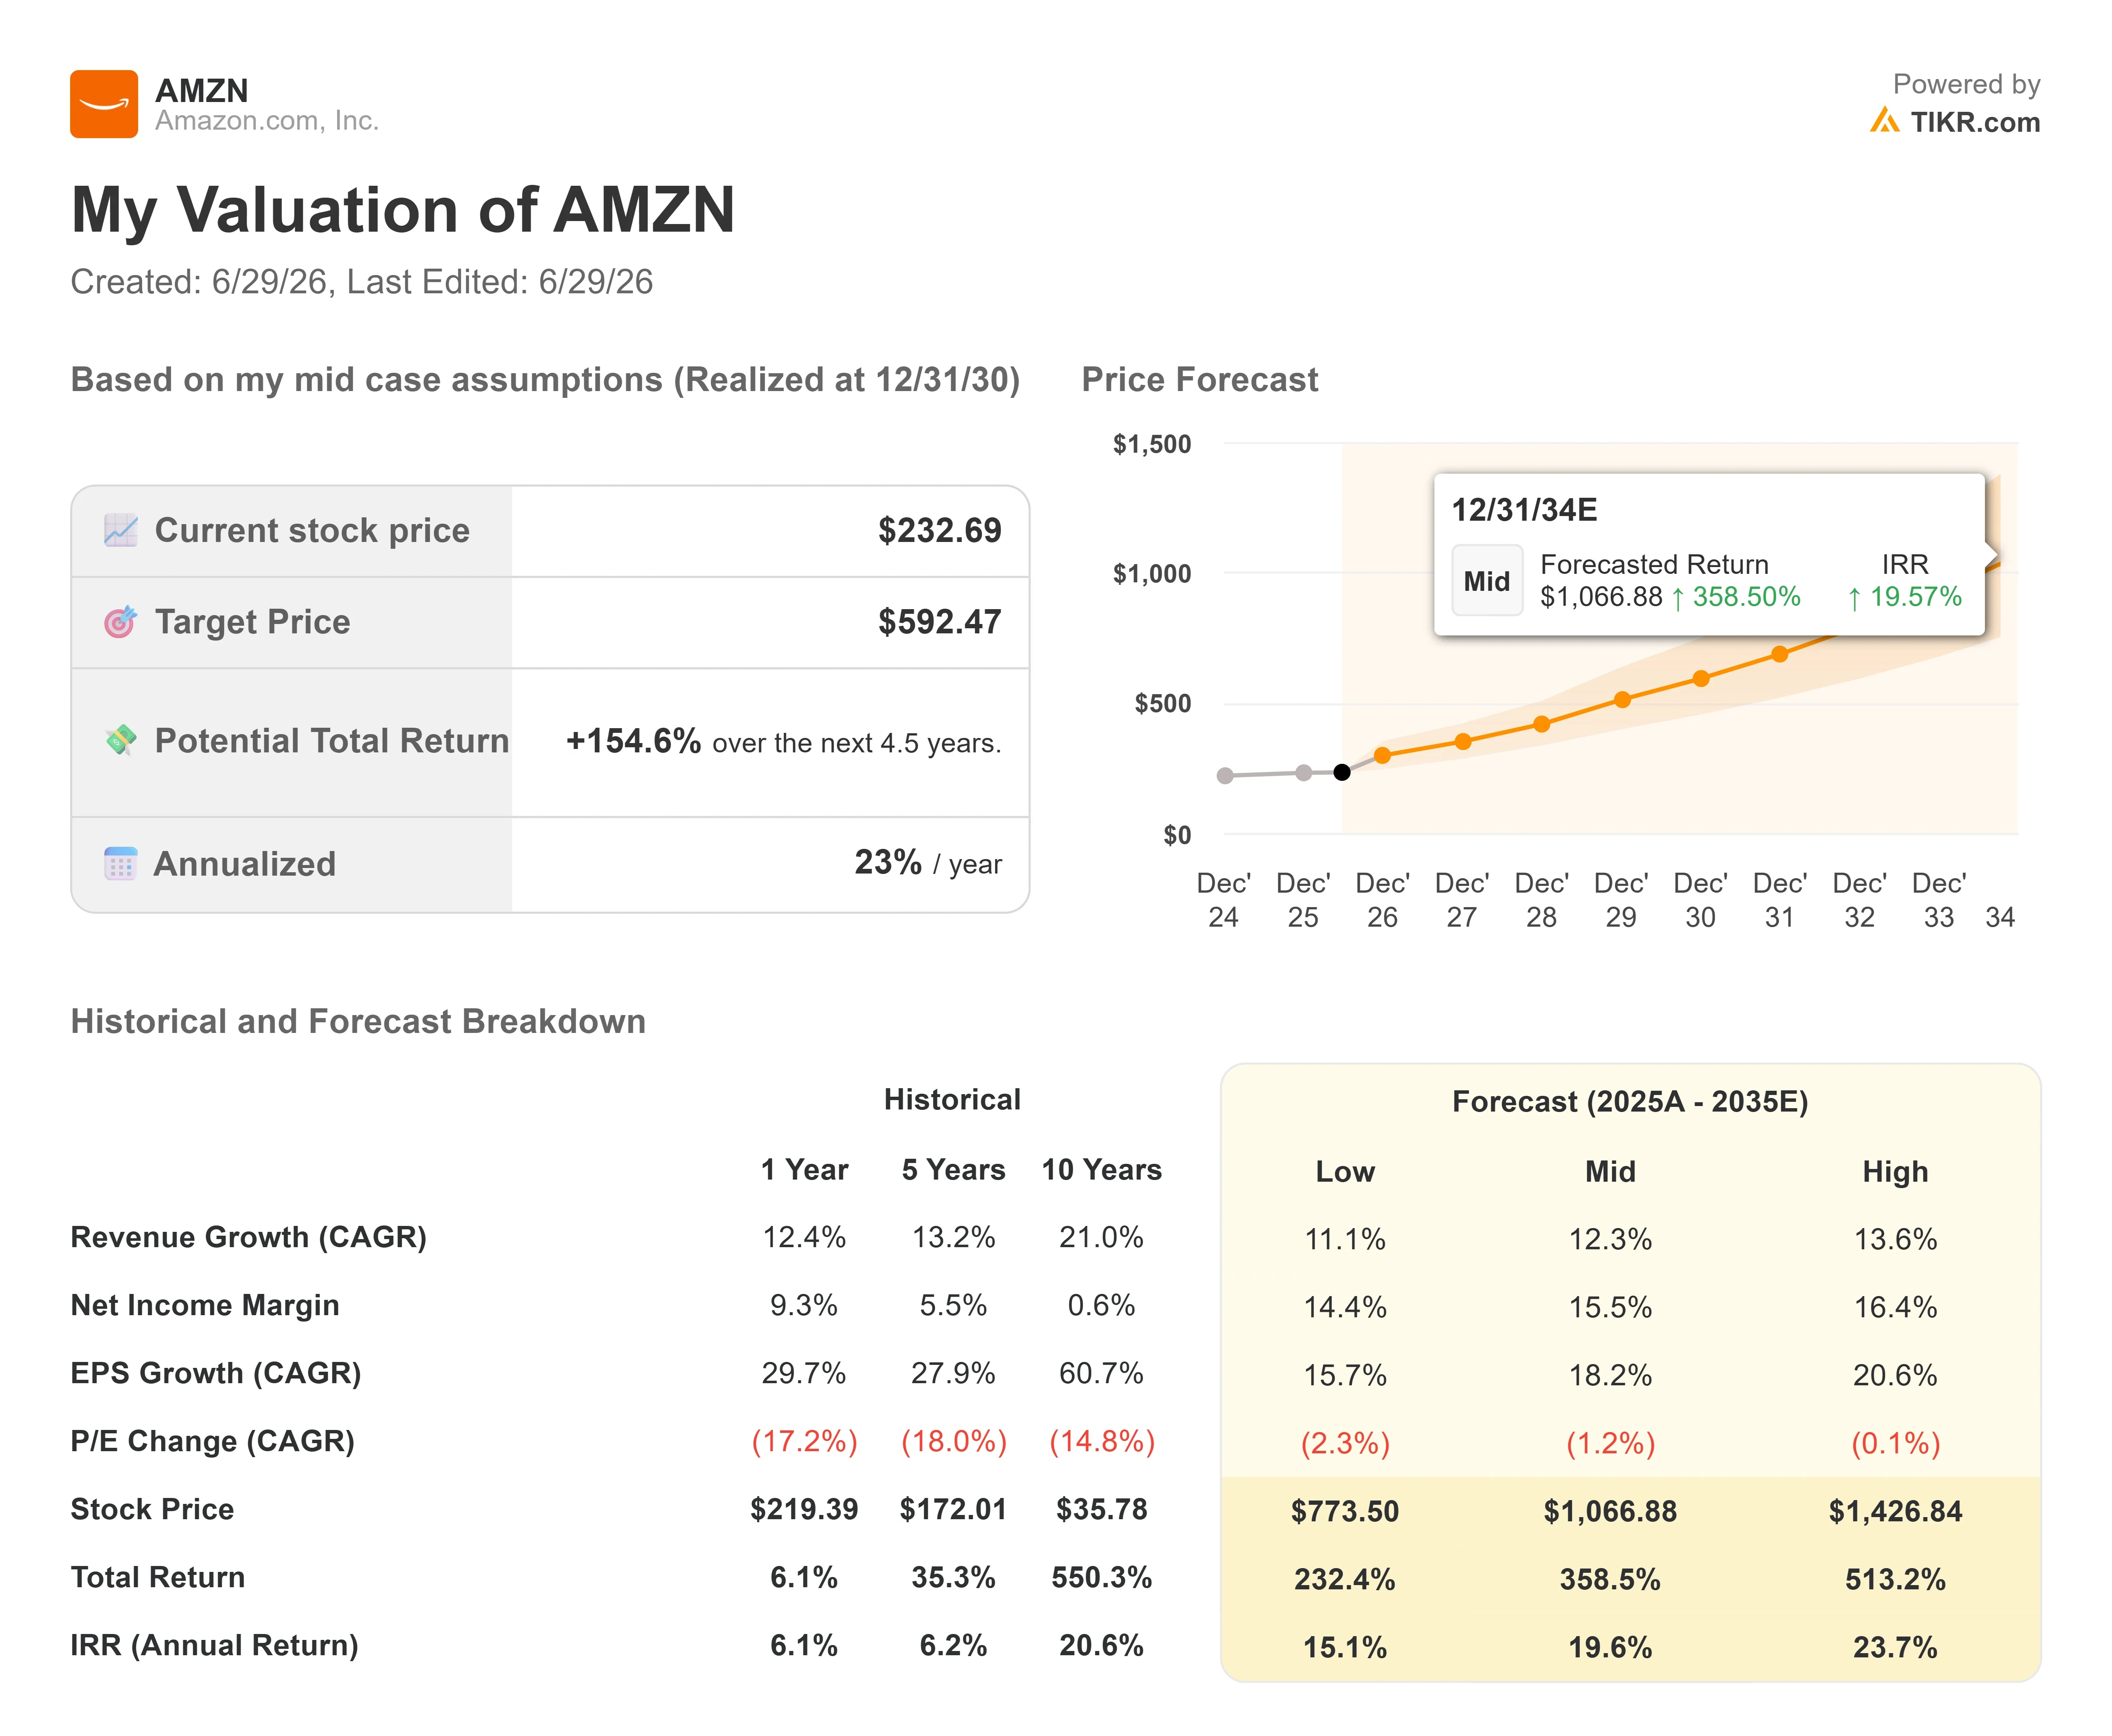
Key Stats for Amazon Stock
- Current Price: $232.69
- Target Price (Mid): ~$590
- Street Target: ~$310
- Potential Total Return:~155%
- Annualized IRR: ~23% / year
- Earnings Reaction: +0.77% (April 29, 2026)
Now Live: Discover how much upside your favorite stocks could have using TIKR’s new Valuation Model (It’s free) >>>
What Happened?
Amazon (AMZN) just raised the price of one of its most demanded cloud products, and Wall Street treated that as a reason to buy. On June 26, the stock rose 2.5% to close at $232.69 after Amazon Web Services (AWS), the company’s cloud computing arm, lifted prices on reserved GPU capacity for the third consecutive quarter. The increase takes effect July 1. In a market still nervous about whether the AI buildout will ever pay for itself, a hyperscaler with enough demand to charge more is a different kind of signal.
That is the tension running through Amazon stock in 2026. The shares sit roughly 16% below the $278.56 high set in May, yet the most recent analyst move was bullish, not cautious. Bulls argue that rising GPU prices prove AWS can pass higher infrastructure costs straight to customers. Bears counter that pricing power on rented chips does little to fix the near-term cash flow math behind a roughly $200 billion spending year. The question the market cannot yet answer is whether AWS pricing leverage arrives fast enough to monetize that spend before patience runs out.
Why the Analyst Reaction Matters More Than the Hike Itself
The price change was narrow in isolation. AWS raised hourly rates on EC2 Capacity Blocks, the product that lets customers lock in guaranteed GPU access for up to six months, across several Nvidia chip generations. What moved the stock was the interpretation. Wells Fargo analyst Ken Gawrelski kept his Buy rating and a $312 price target, reading the repeated increases as evidence that AI compute demand keeps outpacing supply. When customers accept higher prices to secure capacity, that says something about how tight the market is.
There is a fair caution inside the bullish read. Gawrelski noted the hikes may not flow into revenue right away, because many customers sit on existing contracts. So this is a forward signal about pricing durability, not an instant earnings bump. Still, it lands on top of an AWS business that is already accelerating. The segment grew 28% year over year to $37.6 billion in the first quarter, its fastest pace in 15 quarters. AWS produced $14.2 billion in segment operating income that quarter, a roughly 38% operating margin, per Amazon’s Q1 2026 earnings call. A business raising prices to achieve that kind of growth is the opposite of one fighting for demand.
CEO Andy Jassy framed the chip economics directly on that call. “At scale, we expect Trainium will save us tens of billions of dollars of CapEx each year and provide several hundred basis points of operating margin advantage versus relying on others’ chips for inference,” he told analysts. That matters because it explains how AWS can both invest heavily and protect margins: cheaper in-house silicon lowers the cost to serve every workload, which widens the gap between what AWS charges and what it spends.
The Consumer Side Sends a Mixed Signal
The cloud story is only half of Amazon. The retail half delivered a more complicated week. During Amazon’s Prime Day window, which ran June 23 through June 26, U.S. shoppers spent a record $26.4 billion online across all retailers, up 9.3% year over year, according to Adobe Analytics. That figure tracks total U.S. e-commerce during the event, not Amazon’s sales alone, but Amazon sits at the center of it. On the headline, that is strength.
Underneath it, the consumer looked stretched. According to the Numerator Amazon Prime Day Tracker, the average order size fell to about $48, down roughly 17% from a year earlier, and average household spend dropped in the double digits across the event. More people bought, but each spent less per trip, leaning toward household essentials over big-ticket electronics. For a retail engine that funds Amazon’s investment cycle, that is worth watching. The stock did not react negatively because the AI narrative is driving sentiment, but a softer consumer is a real variable heading into the back half of 2026.

See historical and forward estimates for Amazon stock (It’s free!) >>>
What the Valuation Says Now
Amazon is not a cheap stock, and the case for it has never rested on a low multiple. Shares trade at around 27.8 times trailing earnings and about 11.7 times forward EV/EBITDA, a premium the market has long granted Amazon for AWS and advertising, reshaping a once low-margin retailer. The 6.91 times trailing EV/gross profit multiple sits below where it traded for much of the past year, which is the practical effect of a stock that has fallen while the business has accelerated.
The market’s near-term fear is concentrated in one line: free cash flow. With roughly $200 billion in capital spending planned for 2026, mostly aimed at AI data centers and custom chips, the cash that built AWS the first time is again being poured in ahead of the revenue it will eventually bill. That is the bear case in a sentence, and it is legitimate while the spend runs ahead of monetization. The counterweight is that the demand is contracted, not hoped for. Jassy disclosed an AWS backlog of $364 billion at quarter-end, a figure that excludes a recently signed Anthropic agreement worth over $100 billion, and said the breadth spans many customers rather than one or two. The GPU price hikes are the early, visible proof that the capacity being built has buyers willing to pay up for it.
The Street has not blinked. The consensus price target sits at around $310, and analyst sentiment skews heavily positive, with 48 Buys, 15 Outperforms, 4 Holds, 3 No Opinions, and no Sells in the latest tally. That balance tells you the disagreement is about timing and cash flow, not about whether the franchise is intact.

See how Amazon performs against its peers in TIKR (It’s free!) >>>
TIKR Advanced Model Analysis
- Current Price: $232.69
- Target Price (Mid): ~$590
- Potential Total Return: ~155%
- Annualized IRR: ~23% / year
See analysts’ growth forecasts and price targets for Amazon stock (It’s free!) >>>
That IRR is the yearly return from today’s price to the target. The mid case fits here because it sits between a Street that already expects upside and assumptions that do not require heroics.
Two revenue CAGR drivers carry the forecast. The first is AWS, as the Trainium backlog and rising reserved-capacity pricing convert into billed revenue. The second is advertising, a high-margin stream layered on the retail base. The margin driver is operating leverage, with net income margin widening toward roughly 16% by 2030 from single digits historically, helped by fulfillment automation and cheaper in-house silicon. The primary risk is straightforward: if capacity monetizes more slowly than management assumes, free cash flow stays negative longer, and the multiple never re-rates.
The upside is that AWS’s pricing power and ad growth pull earnings forward faster than the bears expect, and the stock closes the gap to fair value as cash flow recovers.
The downside is that the capex cycle outlasts the market’s patience, leaving Amazon to spend through a multiple that keeps compressing.
Conclusion
The single number to watch is AWS revenue growth when Amazon reports second-quarter results on July 30. AWS grew 28% in Q1. A reading that holds at or above the mid-20s would confirm that the pricing power behind these GPU hikes is real demand, not a one-off. A deceleration back toward 20% would hand the bears their argument that the $200 billion is running ahead of what customers will actually absorb. Watch the AWS line first, the operating margin second, and any update to the free cash flow trajectory third. By the end of July, investors will know whether the price increases were a signal or just a headline.
See what stocks billionaire investors are buying so you can follow the smart money with TIKR.
Should You Invest in Amazon?
The only way to really know is to look at the numbers yourself. TIKR gives you free access to the same institutional-quality financial data that professional analysts use to answer exactly that question.
Pull up Amazon, and you’ll see years of historical financials, what Wall Street analysts expect for revenue and earnings in the quarters ahead, how valuation multiples have moved over time, and whether price targets are trending up or down.
You can build a free watchlist to track Amazon alongside every other stock on your radar. No credit card required. Just the data you need to decide for yourself.
Looking for New Opportunities?
- See what stocks billionaire investors are buying so you can follow the smart money.
- Analyze stocks in as little as 5 minutes with TIKR’s all-in-one, easy-to-use platform.
- The more rocks you overturn… the more opportunities you’ll uncover. Search 100K+ global stocks, global top investor holdings, and more with TIKR.
Disclaimer:
Please note that the articles on TIKR are not intended to serve as investment or financial advice from TIKR or our content team, nor are they recommendations to buy or sell any stocks. We create our content based on TIKR Terminal’s investment data and analysts’ estimates. Our analysis might not include recent company news or important updates. TIKR has no position in any stocks mentioned. Thank you for reading, and happy investing!