

When you evaluate a potential investment, the most critical question is not just whether a business is good, but whether it is better than the alternatives. Investing is an exercise in opportunity cost, so you have to understand if a company is truly high-quality by comparing its execution, efficiency, and valuation side-by-side with its closest peers.
Comparing two stocks side-by-side allows you to see which management team allocates capital more efficiently and which business model possesses a more durable competitive advantage.
If one company is growing at 10% with a 20% margin while its closest rival grows at 15% with a 25% margin, the first business might be losing ground despite its growth.
Find out what a stock’s really worth in under 60 seconds with TIKR’s new Valuation Model (It’s free) >>>
Many different tools allow you to perform these comparisons, but they are built for different purposes. Some prioritize the visual momentum of a stock price, while others focus on the business’s underlying machinery. Choosing the right one depends on whether you are looking for short-term price patterns or long-term business durability.
Track the detailed financials of thousands of stocks with TIKR (It’s free) >>>
1. TIKR
TIKR is built for the disciplined, long-term investor who views a stock as an ownership stake in a business. It is designed to strip away market noise and focus on the fundamental drivers of value.
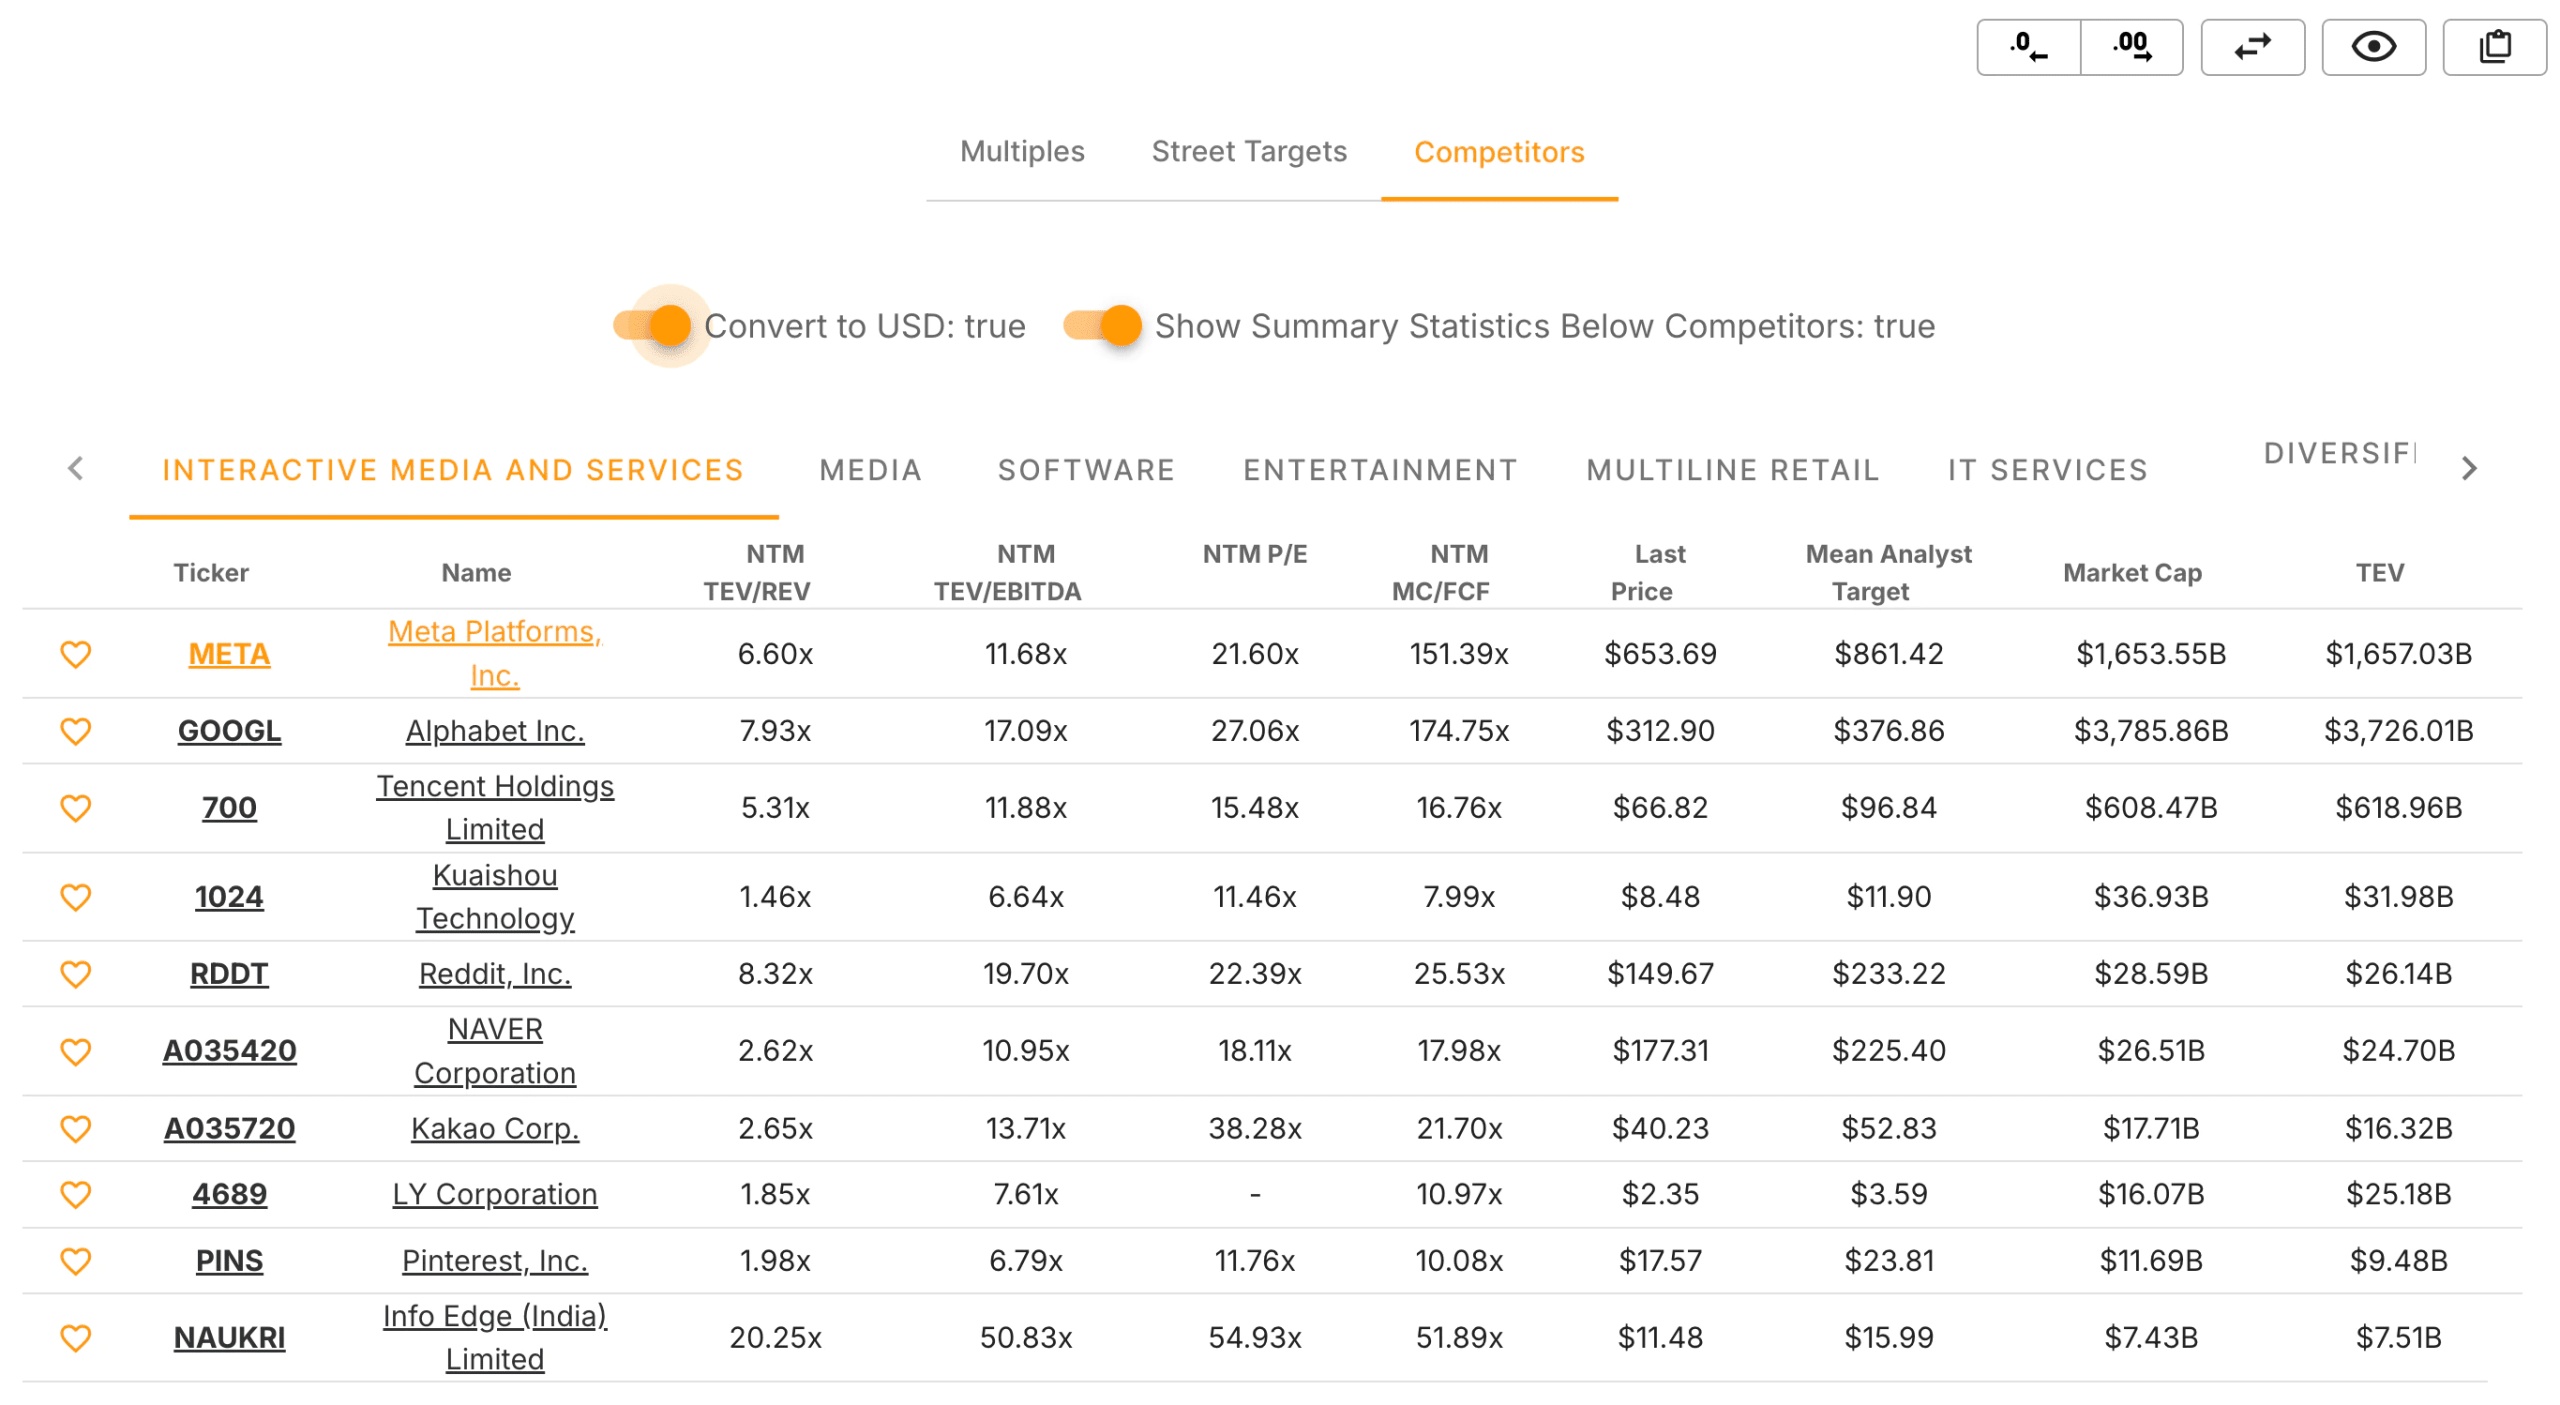
To begin a comparison, navigate to the Competitors tab on any company page. TIKR automatically groups the stock with its closest industry peers based on sector and market cap, eliminating hours of manual search. This view allows you to compare up to 20 years of standardized financials, including Return on Invested Capital (ROIC), EBITDA margins, and Free Cash Flow (FCF) yields.
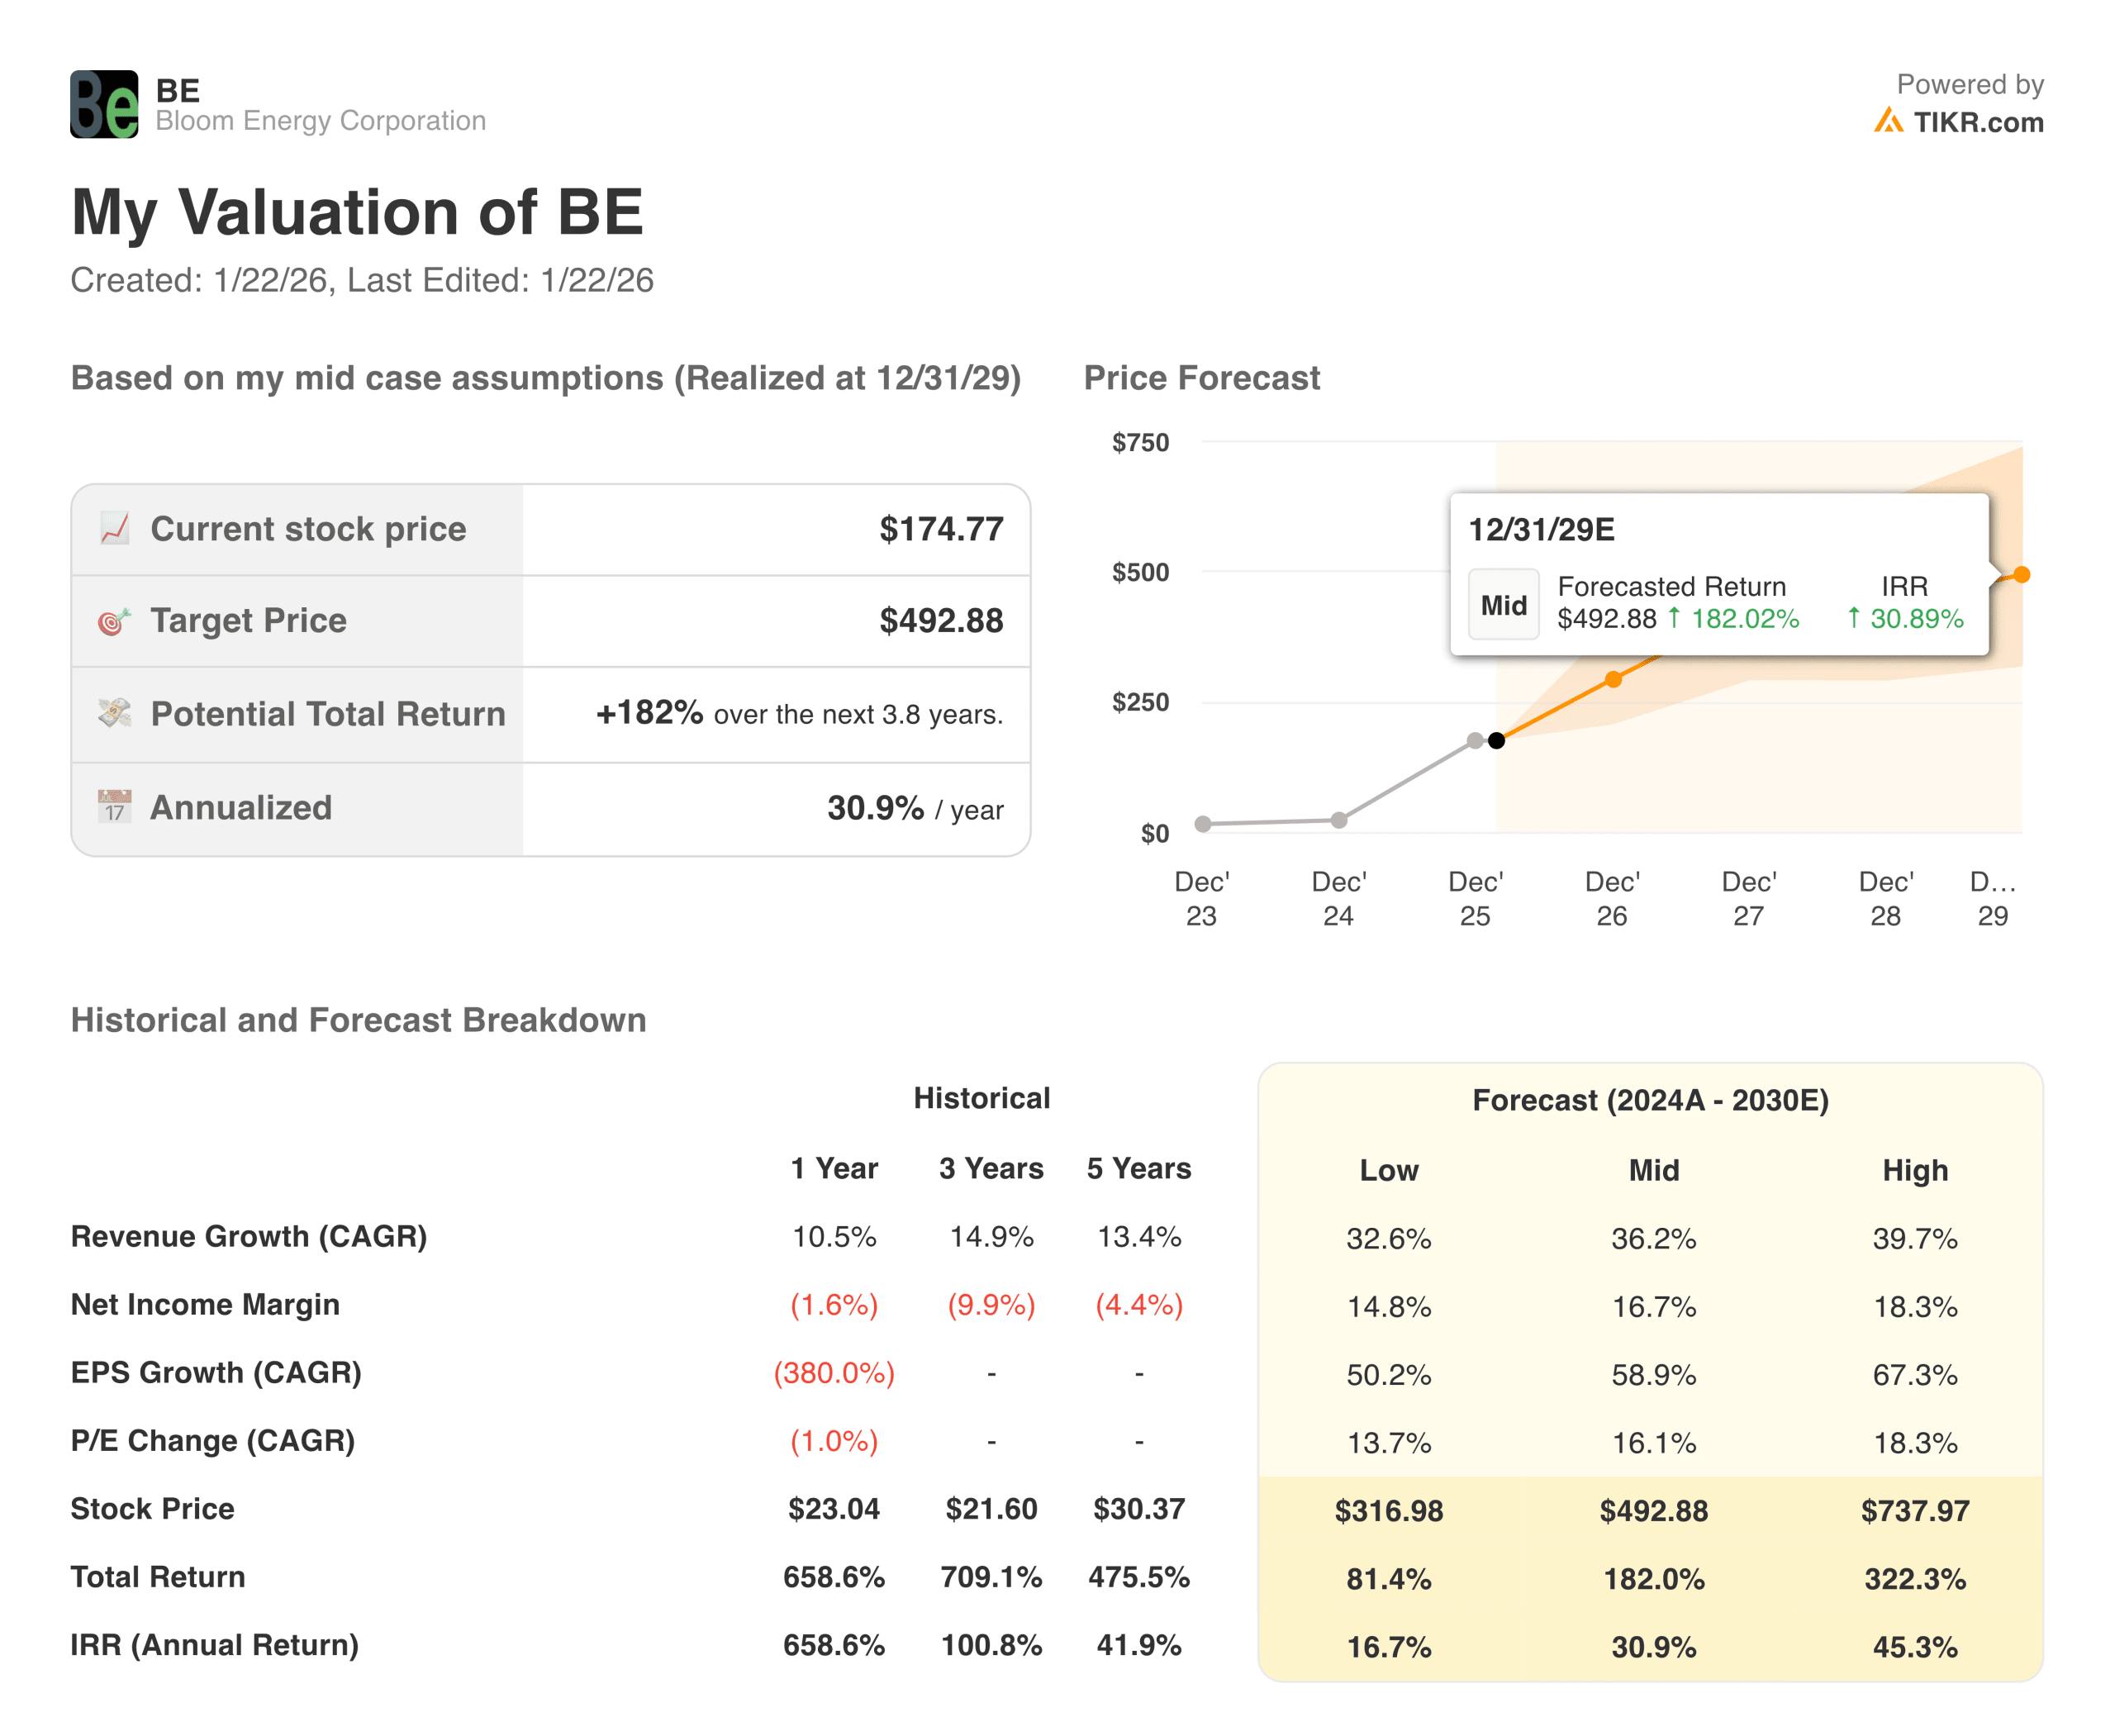
Beyond historical data, you can use the Valuation Model Builder to create side-by-side Bull, Base, and Bear cases. By adjusting growth and margin assumptions, you can see which business has a more attractive risk-to-reward profile over a five-year horizon. TIKR covers over 100,000 stocks globally, enabling you to compare a US tech giant with a European or Asian peer on the exact same metrics. This tool is best for investors who want to understand the durability of a business and its intrinsic value over several years.
2. Koyfin
Koyfin is an excellent tool for investors who prioritize visual data and macro-level trends. It excels at turning dense financial statements into readable dashboards.
You can compare stocks and ETFs by using the Historical Graph (G) or Performance (GM) functions. This allows you to plot fundamental metrics like P/E ratios or revenue growth for multiple companies on a single, color-synced chart. A unique feature is the Percentile Ranks, which shows where a company’s valuation or margins stand relative to its own history or its industry on a 0 to 100 scale.
While it offers a global screener with over 5,900 metrics, the free plan is limited to two years of financials and one year of estimates. This tool is best for those who need to visualize how valuation multiples and financial trends have shifted over time relative to the broader market.
Build your own screener to find the best stocks to buy today (Free with TIKR) >>>
3. TradingView
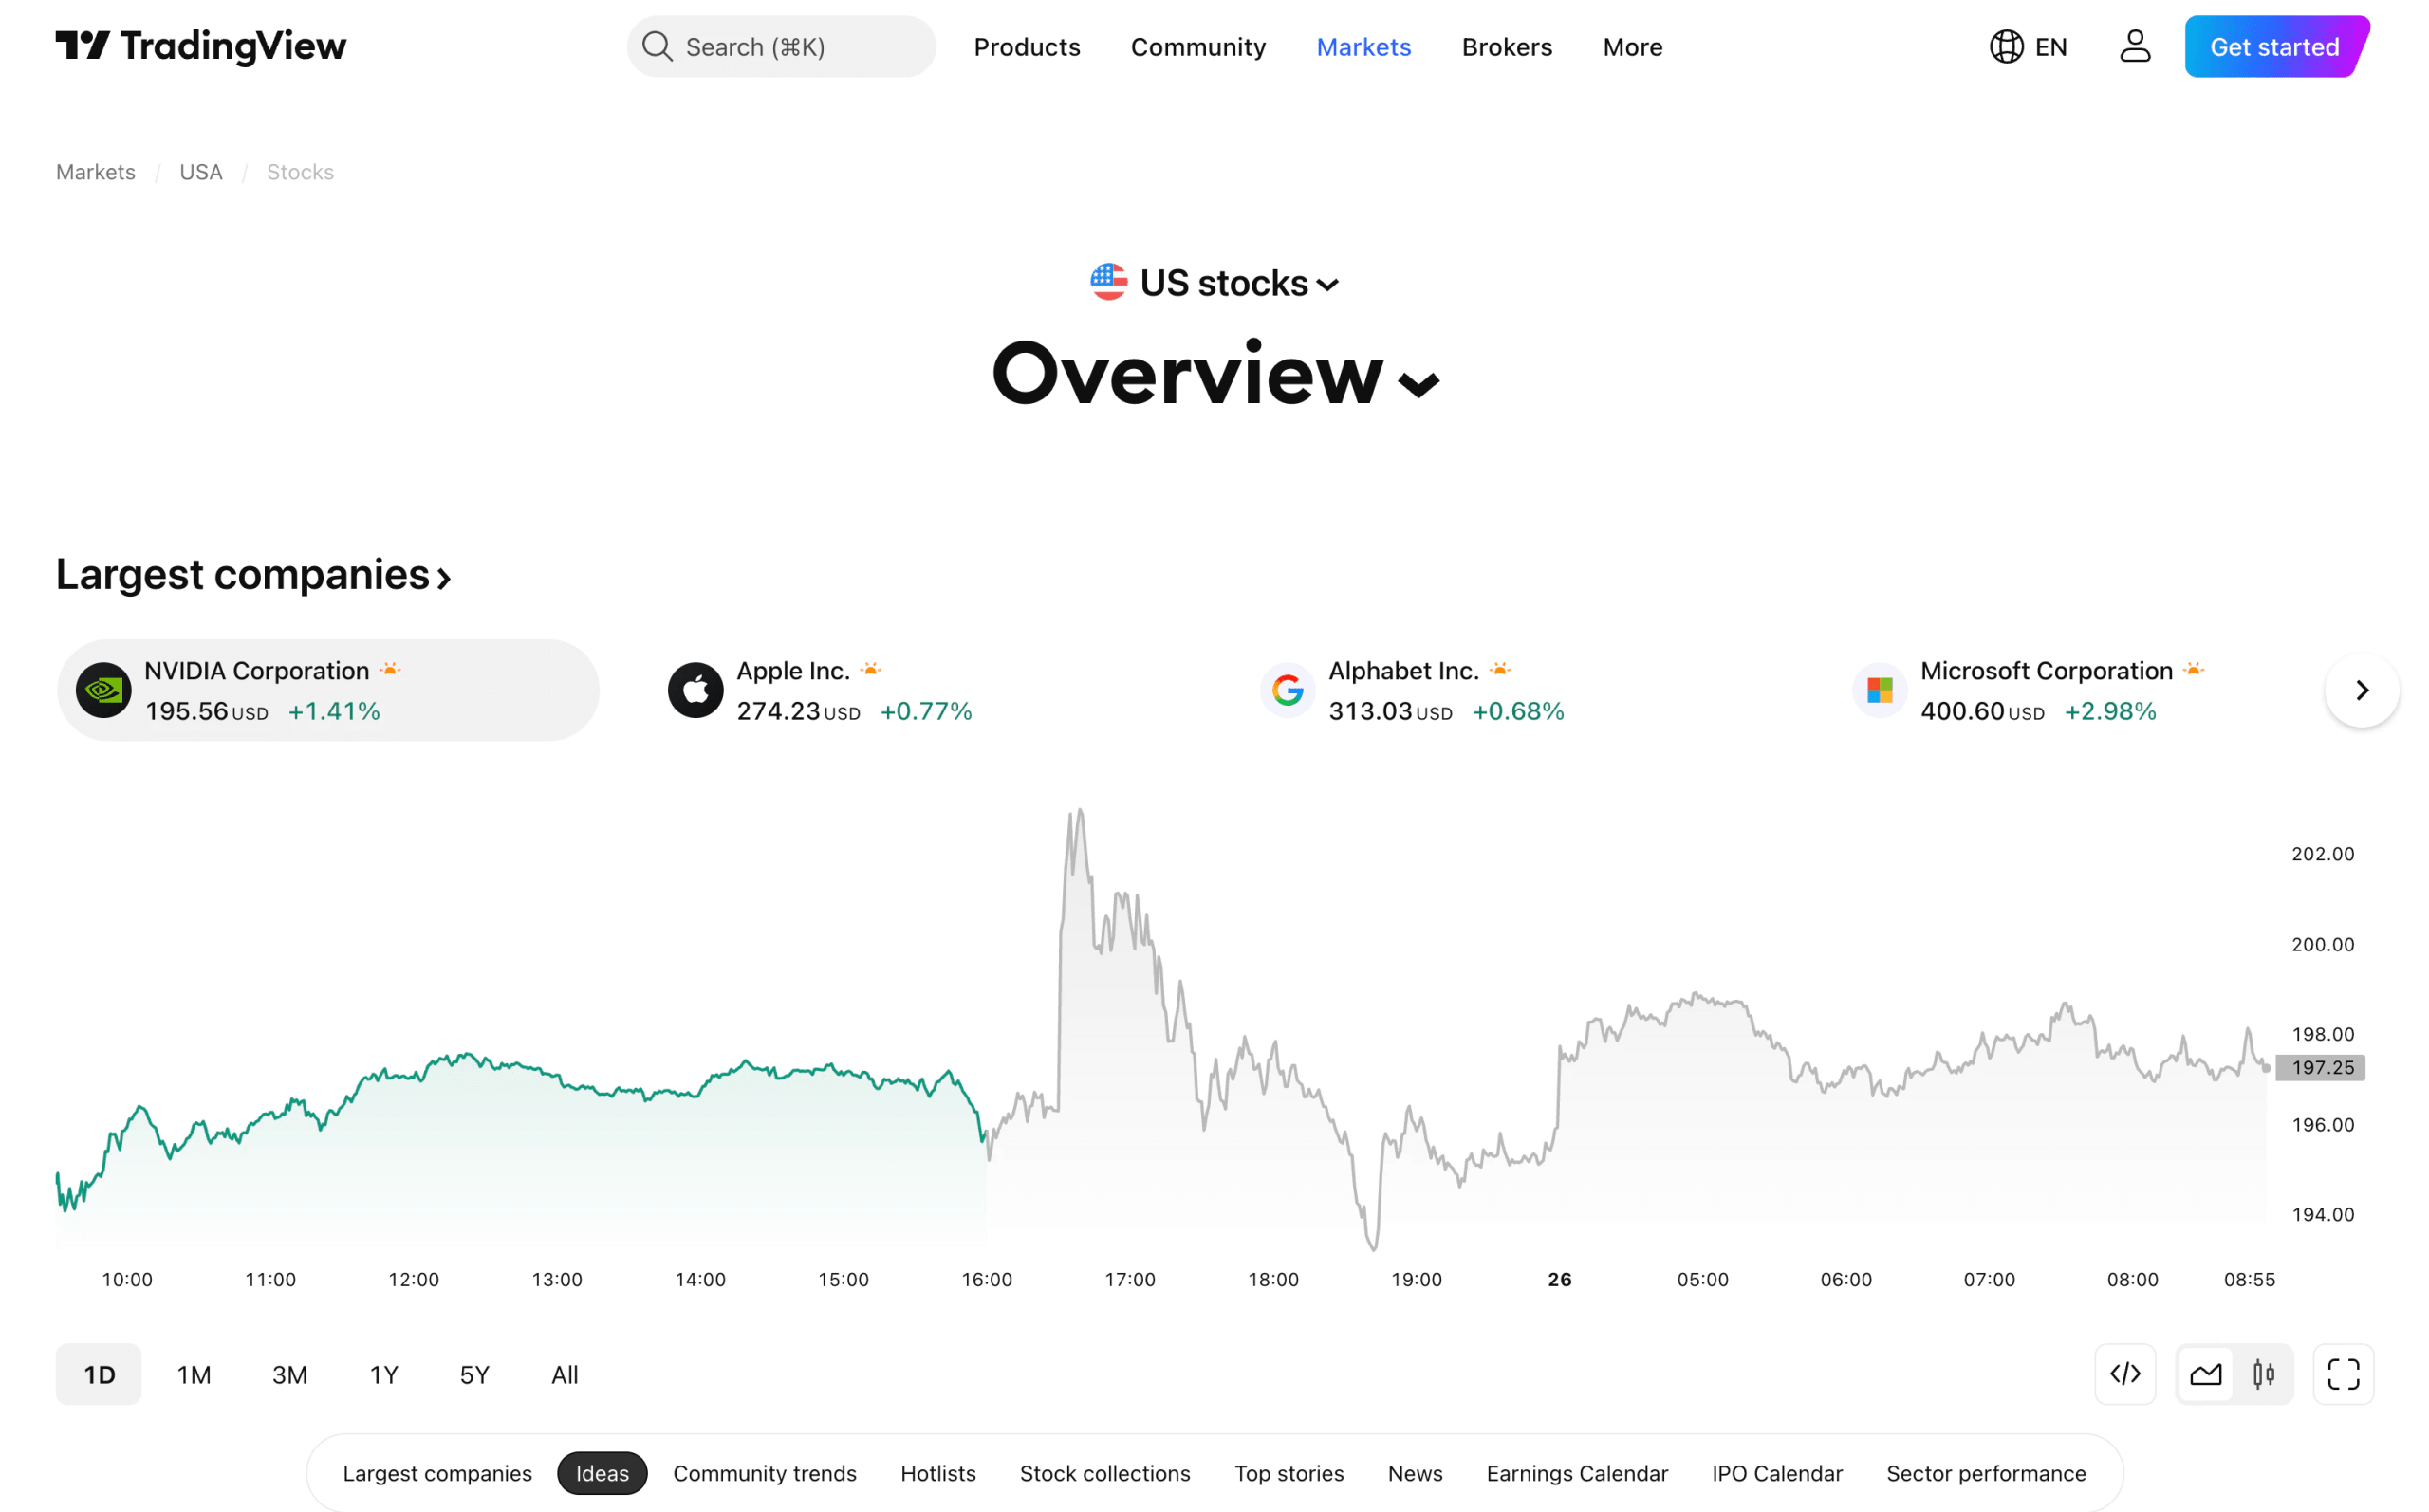
If your process focuses on price action, volume, and technical indicators, TradingView is the standard.
To compare symbols, click the Compare or Add Symbol button (+ icon) on the top toolbar of a chart. You can choose to overlay a second stock using a Same % Scale to see which one has more relative strength or open a New Pane to view the charts separately on the same screen.
While it offers 100+ fundamental metrics, its primary strength is the Pine Script editor, which allows users to create custom indicators and automated trading strategies for side-by-side analysis. However, the free version limits you to one chart per tab and two indicators at a time. This tool is best for active traders looking to time their entries based on relative price strength and technical patterns.
4. Yahoo Finance
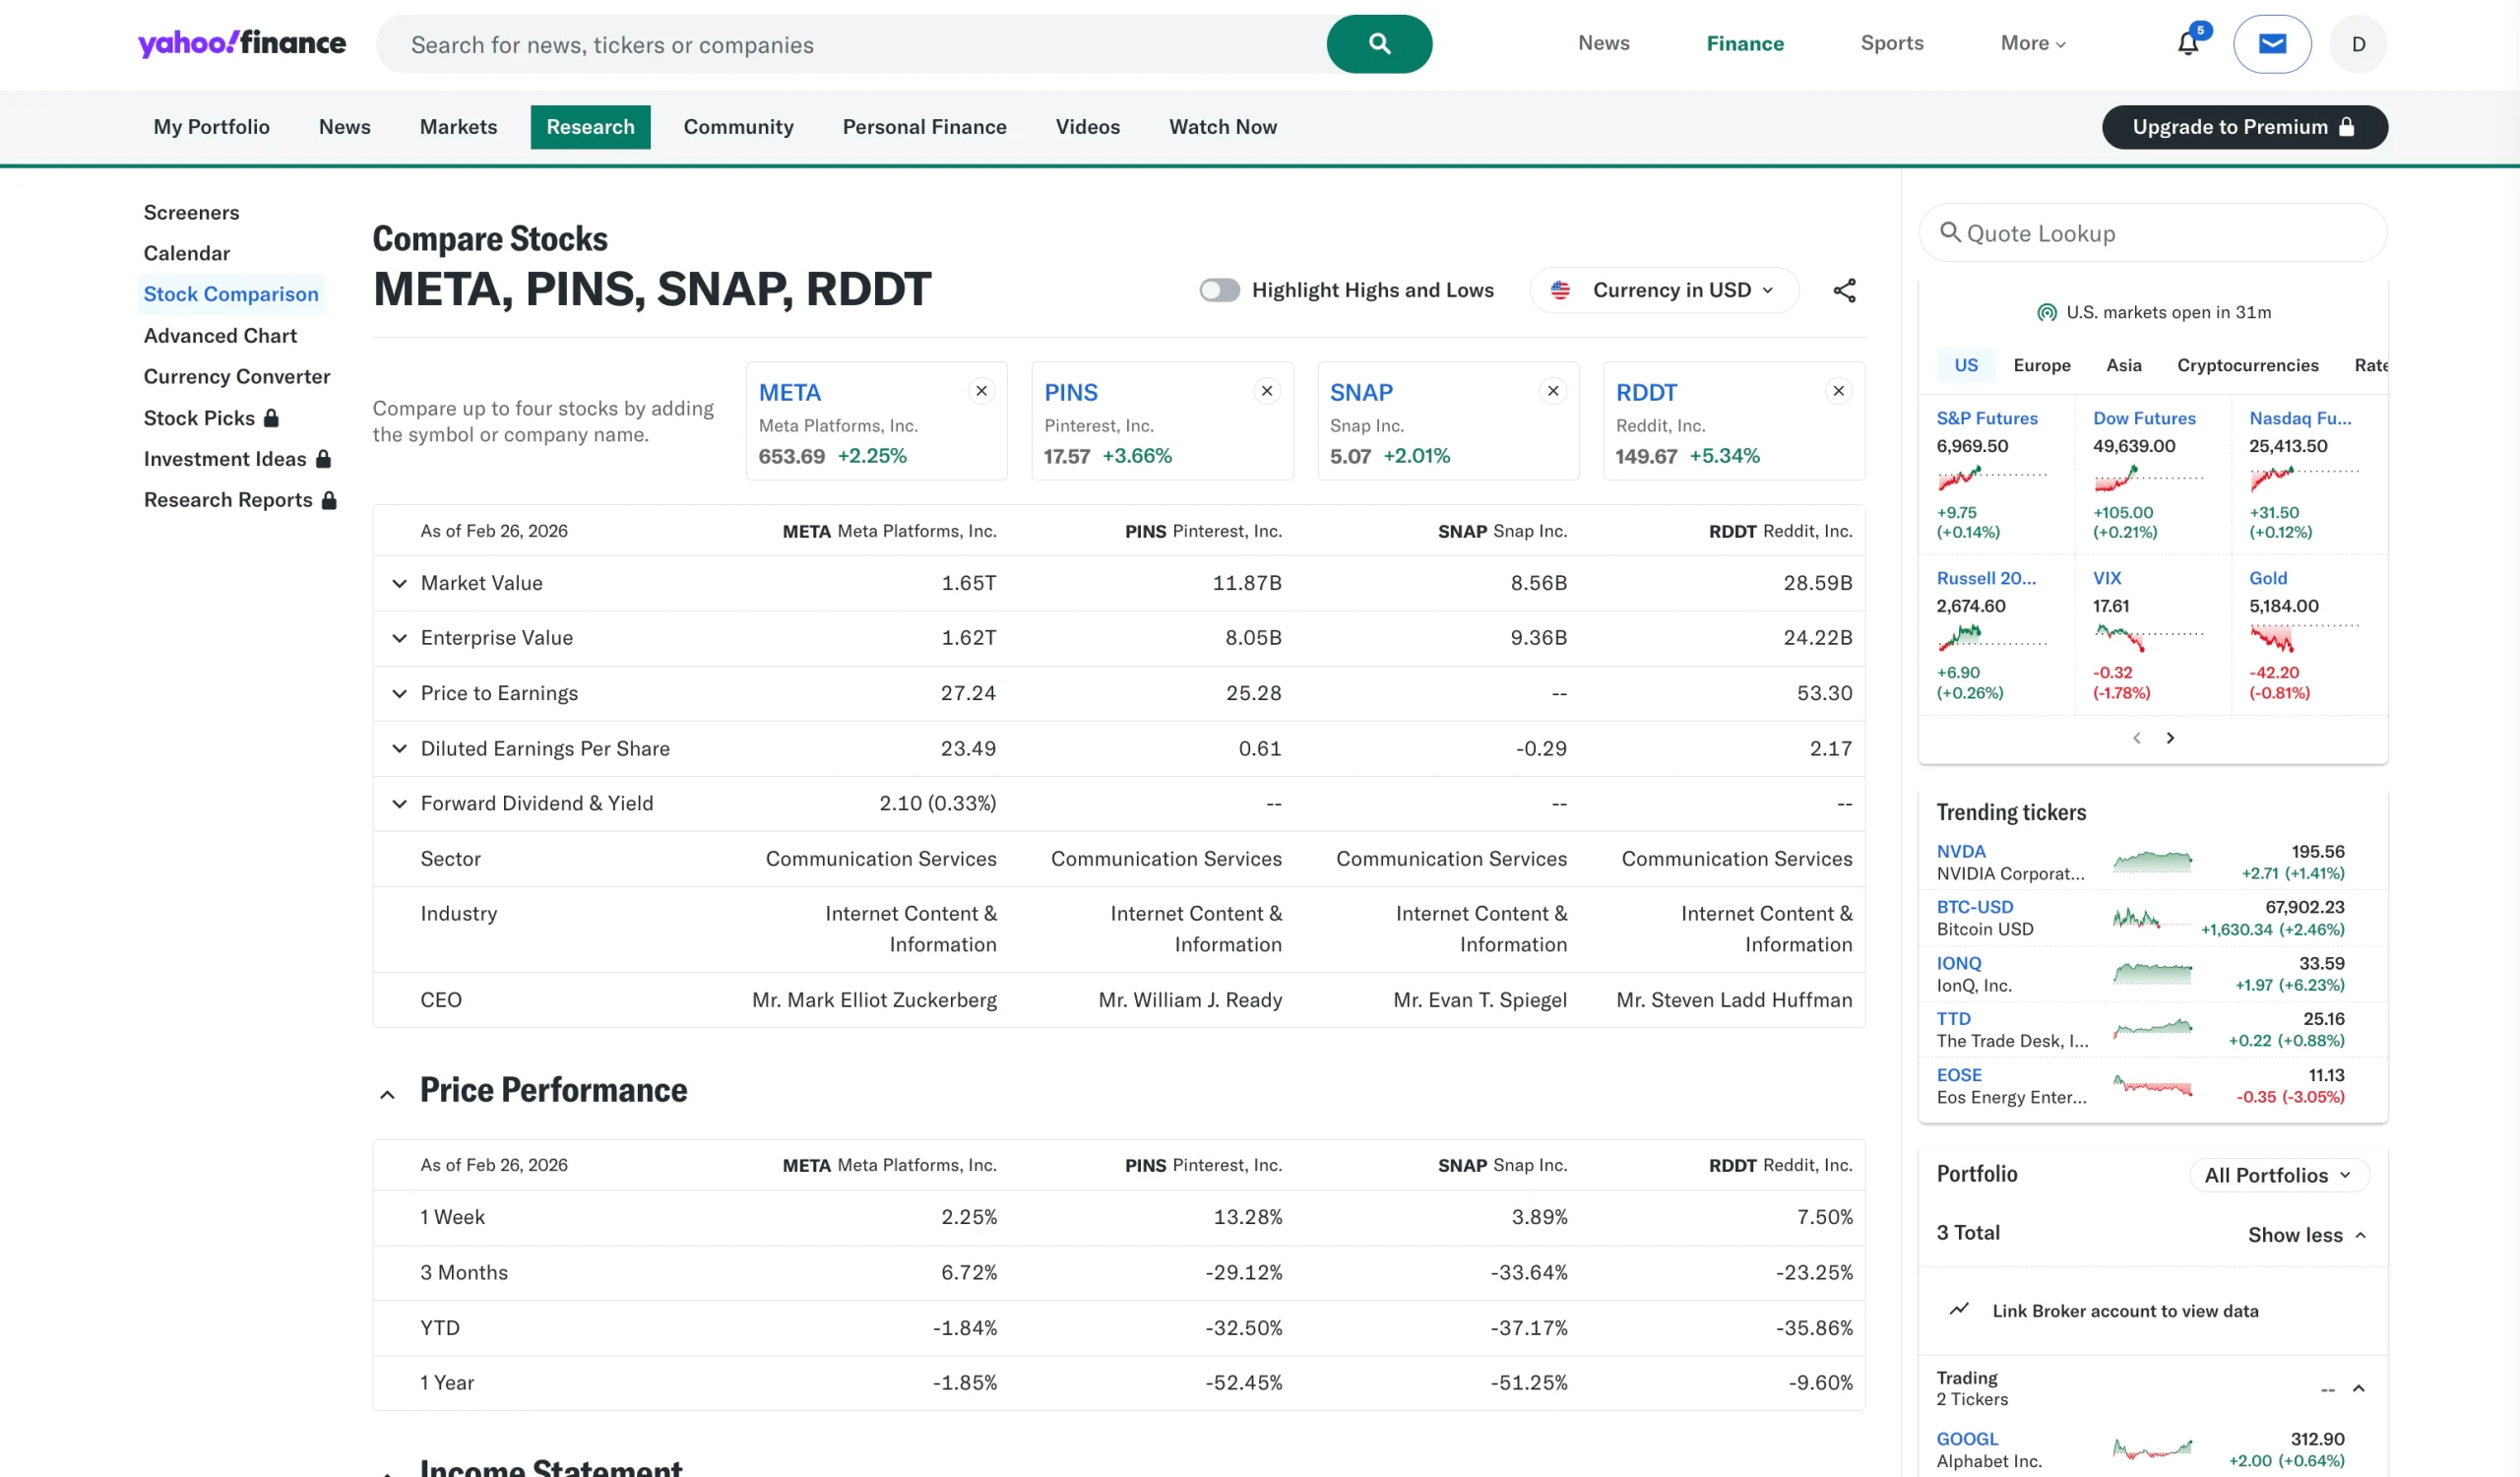
Yahoo Finance is a familiar starting point for many due to its accessibility, though it lacks the institutional depth of TIKR or Koyfin.
You can initiate a comparison by entering up to five symbols on the Compare Stocks page. This tool provides 10 pre-built views to compare fundamental and technical information, such as balance sheets and income statements, side-by-side.
You can also create a custom view from over 140 criteria to focus on the data most important to your strategy. While useful for quick checks, it does not offer the deep historical ROIC or standardized global data required for a complete fundamental analysis. This tool is best for beginner investors who need a quick, no-cost way to check basic financial health and recent news across multiple stocks.
5. Finviz
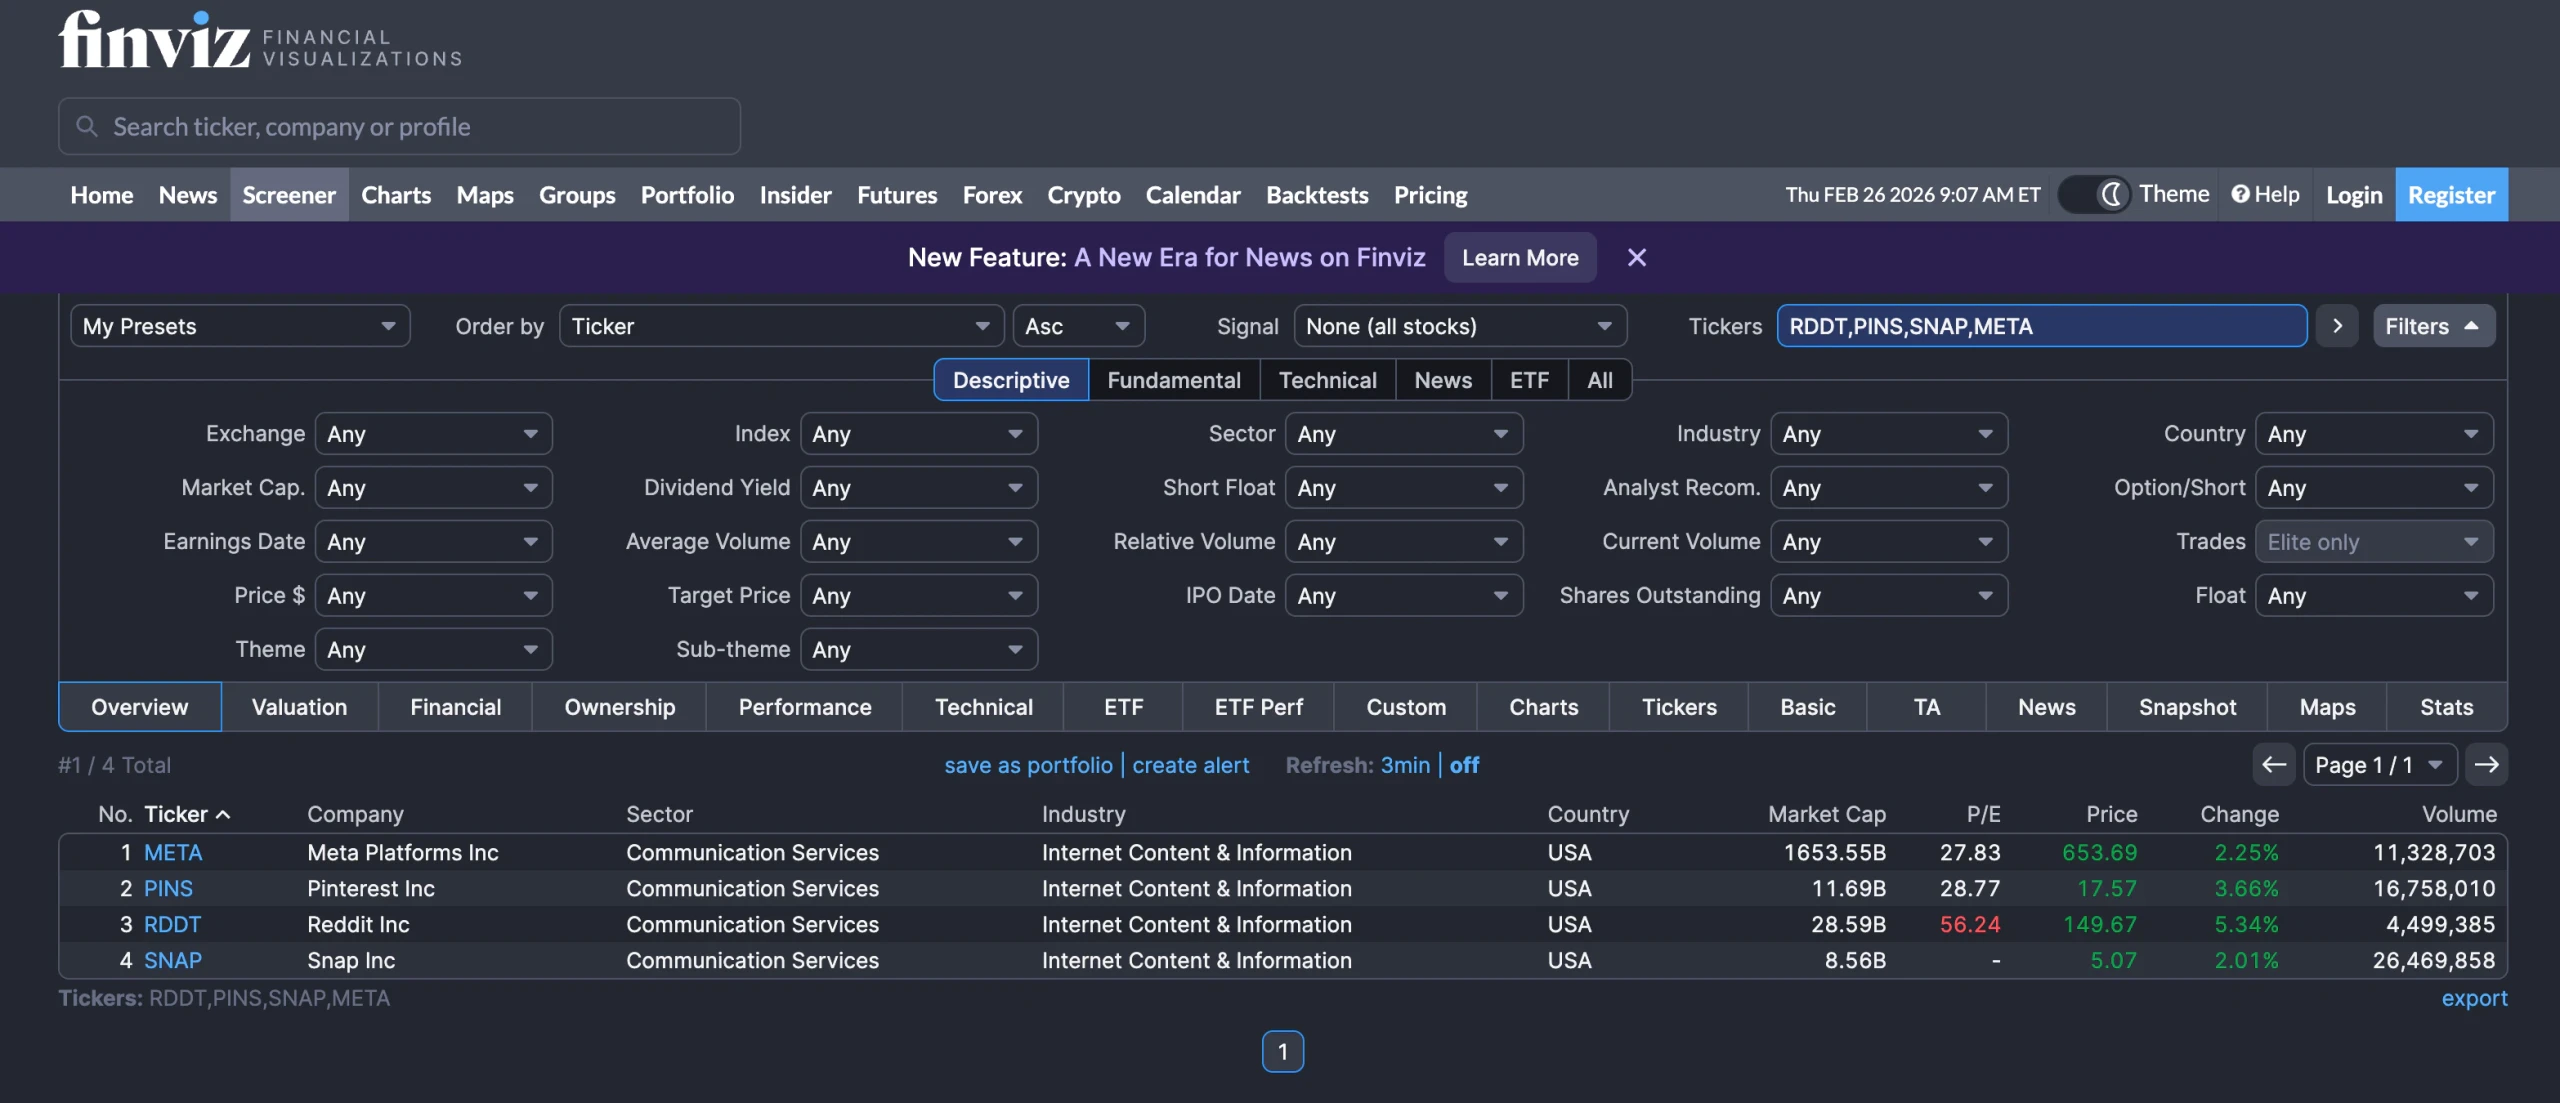
Finviz is a powerful alternative for investors who prioritize a highly visual and immediate screening process to narrow down the global market.
To compare stocks, you can use the screener to instantly see how a company’s valuation and performance stack up against its industry peers.
The platform excels at condensing vast amounts of data, including insider trading, debt ratios, and price targets, into a single, intuitive interface for quick analysis. However, the free version includes advertisements and delayed data, and it lacks the deep, 20-year standardized financial history found in more advanced terminals. This tool is best for investors who want an efficient, data-heavy overview to quickly filter through thousands of stocks based on relative valuation and sector momentum.
Estimate a company’s fair value instantly (Free with TIKR) >>>
TIKR Takeaway
While TradingView is built for timing entries and Koyfin excels at macro charting, it’s the TIKR Terminal that is the superior choice for understanding a business’s intrinsic value.
Successful investing is about identifying durable competitive advantages. By providing 20 years of standardized data and a global peer set in one view, TIKR allows you to see through short-term price volatility and focus on whether a company’s margins and returns on capital are actually sustainable over the long term.
Most tools show you what the stock price is doing; TIKR shows you why the business is winning.
Value Any Stock in Under 60 Seconds with TIKR
With TIKR’s new Valuation Model tool, you can estimate a stock’s potential share price in under a minute.
All it takes is three simple inputs:
- Revenue Growth
- Operating Margins
- Exit P/E Multiple
If you’re not sure what to enter, TIKR automatically fills in each input using analysts’ consensus estimates, giving you a quick, reliable starting point.
From there, TIKR calculates the potential share price and total returns under Bull, Base, and Bear scenarios so you can quickly see whether a stock looks undervalued or overvalued.
See a stock’s true value in under 60 seconds (Free with TIKR) >>>
Looking for New Opportunities?
- Discover which stocks billionaire investors are purchasing, so you can follow the smart money.
- Analyze stocks in as little as 5 minutes with TIKR’s all-in-one, easy-to-use platform.
- The more rocks you overturn… the more opportunities you’ll uncover. Search 100K+ global stocks, global top investor holdings, and more with TIKR.
Disclaimer:
Please note that the articles on TIKR are not intended to serve as investment or financial advice from TIKR or our content team, nor are they recommendations to buy or sell any stocks. We create our content based on TIKR Terminal’s investment data and analysts’ estimates. Our analysis might not include recent company news or important updates. TIKR has no position in any stocks mentioned. Thank you for reading, and happy investing!


