Key Takeaways
- GE Vernova shares fell alongside the broader AI-stock selloff in mid-September, but Street price targets climbed every single quarter this year, leaving the September 18 close about 32% below the average analyst target, the widest gap in the past 15 months of data.
- Net income swung wildly the past two quarters mostly because of one-time items, not operations. Q1 2026’s $4.75 billion net income included $4.5 billion of pretax gains tied to the Prolec GE acquisition, while EBITDA, the steadier read on core profitability, kept climbing to $1.25 billion in Q2 2026.
- GEV’s forward price-to-earnings multiple has compressed to about 44.7x, near its 12-month low and well under its 56.3x average, even as the stock price rose roughly 78% over the same stretch. Earnings estimates have been catching up to the stock, not the other way around.
- Management says only about 20% of the 116 gigawatts of gas turbine capacity now under contract comes from data centers, cushioning GE Vernova’s core Power business against the hyperscaler spending slowdown that AI investors are suddenly worried about.
See how GE Vernova’s rising Street targets stack up against its falling share price for yourself. Track GEV’s price target history on TIKR for free →
GE Vernova Stock Got Swept Into an AI Selloff It Doesn’t Quite Belong To
On September 14, AI-linked stocks fell worldwide after industry leaders warned about the risks of rapid model development. GE Vernova dropped roughly 7.4% that day, grouped in with chipmakers and pure AI infrastructure names as the Nasdaq 100 slid to a six-week low. Two days later, a Hazeltree report on hedge fund positioning put GEV in the same “AI theme” short basket as CoreWeave, Nebius and Super Micro Computer, the tenth consecutive month it has ranked among the most-shorted large North American stocks. Hazeltree’s own read was blunt: “With no deterioration in reported fundamentals, the selling appears to reflect the funding question rather than a view on the underlying business’s strength.”
That framing is worth testing against what GE Vernova actually sells. On its Q2 2026 earnings call, management said data centers account for only about 20% of the 116 gigawatts of gas turbine capacity now under contract, spread across roughly 100 customers in 26 countries. The other 80% is traditional utility and industrial demand that has nothing to do with hyperscaler capex budgets. GEV looks like an AI stock in the short baskets. Its order book says something closer to diversified power infrastructure with an AI kicker.
GE Vernova’s Net Income Headlines Have Overstated the Real Story
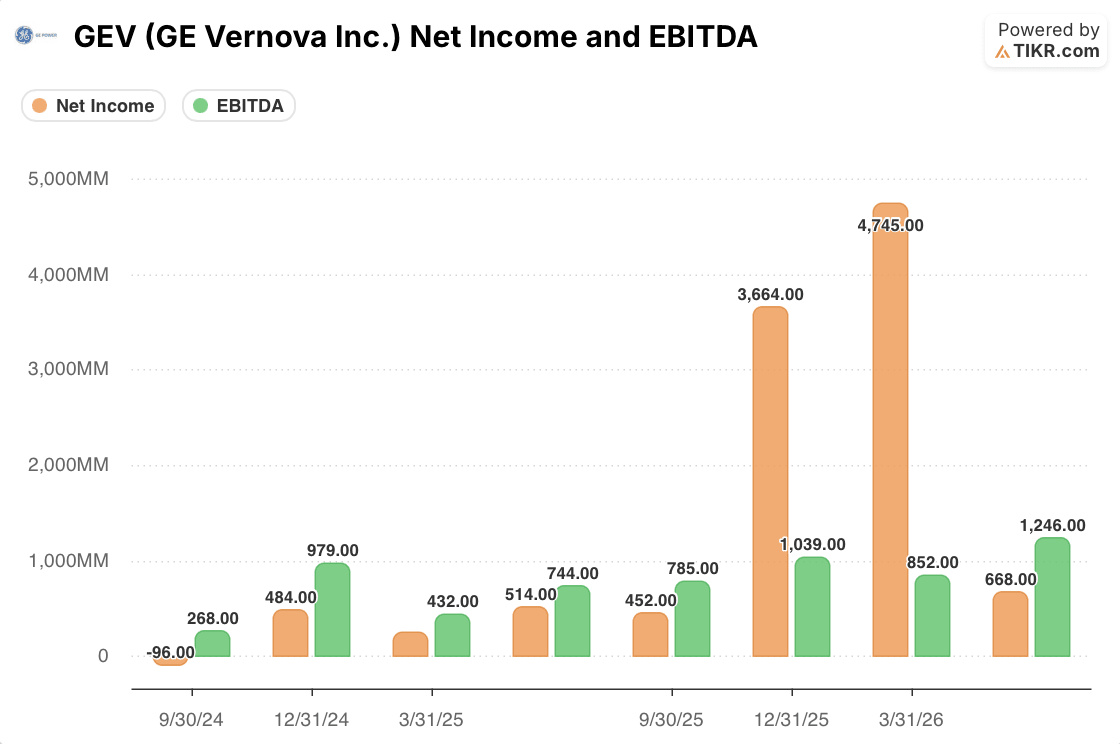
The past two quarters make GEV’s headline profit numbers hard to trust at face value. Net income jumped to $3.66 billion in the fourth quarter of 2025 and $4.75 billion in the first quarter of 2026, both wildly out of proportion to EBITDA of $1.04 billion and $852 million in those same quarters. Management disclosed the source for the Q1 spike directly: $4.5 billion of pretax M&A gains tied to the Prolec GE transformer acquisition, which closed in February. No comparable disclosure exists in the material reviewed here for the Q4 2025 jump, but the same pattern, net income far exceeding EBITDA, shows up in both quarters, which is reason enough to treat GEV’s trailing net income prints as noisy rather than representative.
By the second quarter of 2026, the picture normalized: net income of $668 million against EBITDA of $1.25 billion, a relationship that actually looks like an industrial equipment company again. That EBITDA figure is up sharply from $744 million a year earlier, roughly a two-thirds increase, while segment margins expanded meaningfully on the July call: Power EBITDA margin hit 18.8%, up 320 basis points, and Electrification hit 18.4%, up 700 basis points. Net income over the same year-over-year stretch grew a more modest 30%, likely reflecting higher depreciation, interest and taxes as Prolec gets integrated. The operating trend is real and improving. It just isn’t what the net income headline was showing in the two quarters right before the stock rolled over.
Pull up GE Vernova’s segment EBITDA margins next to its net income for the same quarters. Check GEV’s income statement on TIKR for free →
What GE Vernova’s Valuation and Street Targets Say That the Stock Price Doesn’t
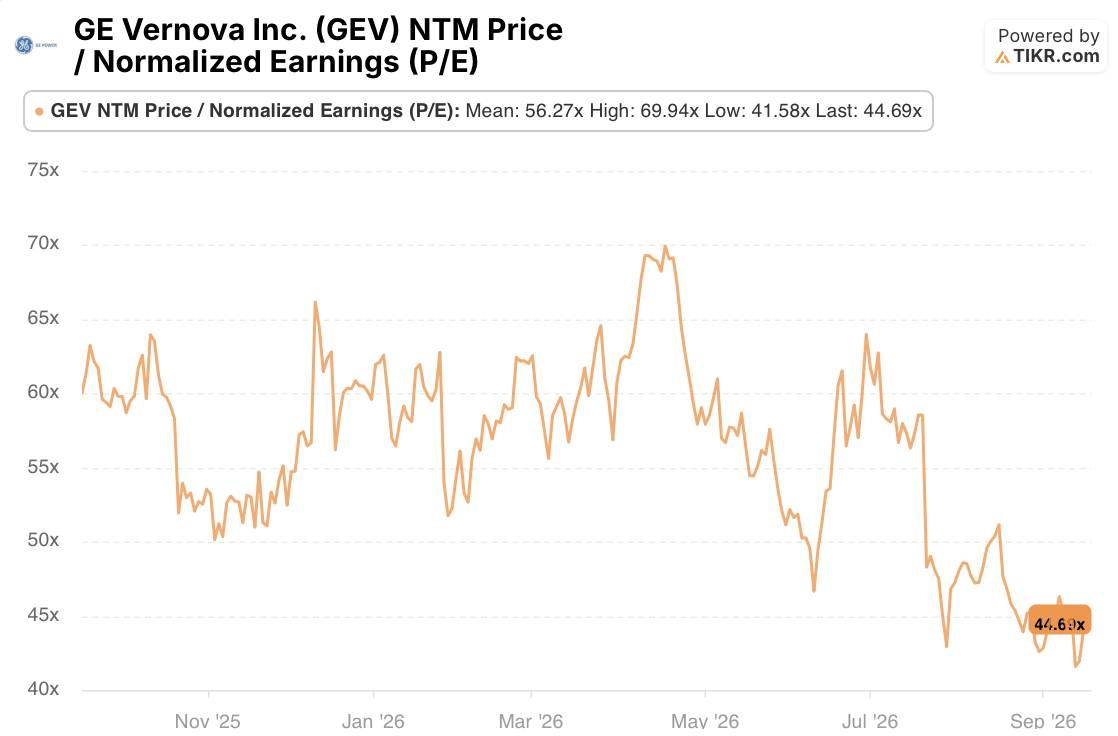
If the September selloff reflected genuine doubt about GEV’s earnings power, the multiple investors pay for those earnings should be rising, not falling. It’s done the opposite. GEV’s NTM price-to-normalized-earnings ratio sits at about 44.7x, near a 12-month low and well under its 56.3x average, after peaking near 70x in the spring. Over that same year, the stock price climbed roughly 78%, from $529 to $940. A falling multiple alongside a rising price means one thing: consensus forward earnings estimates have been growing faster than the stock itself.
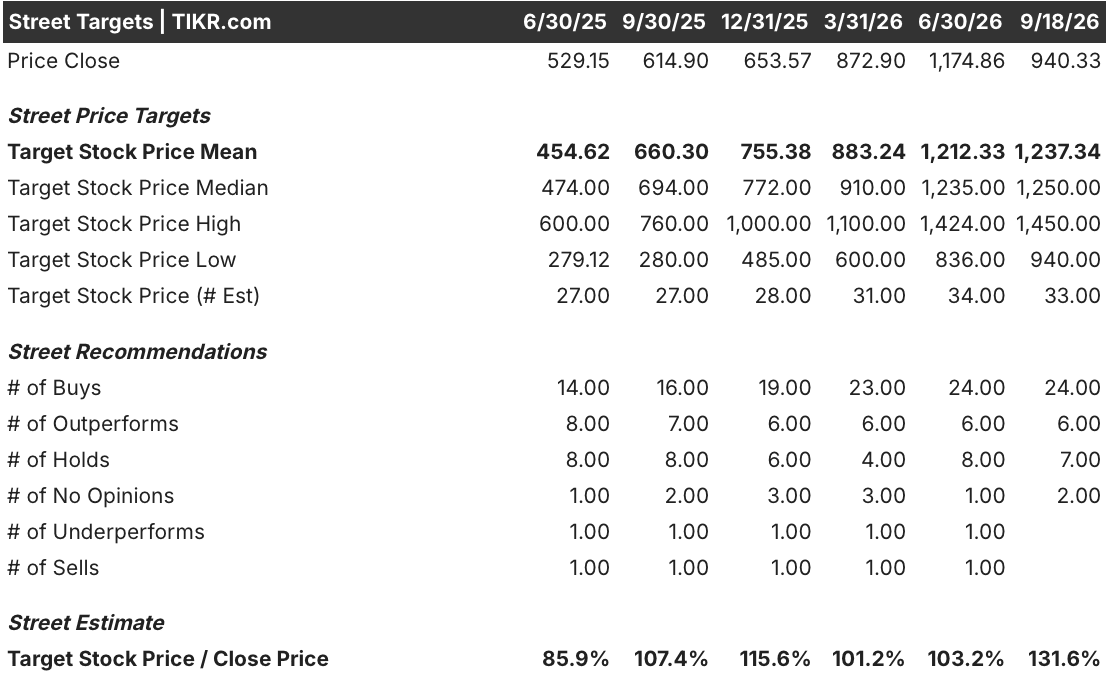
Street targets tell a similar story with more detail. The average price target has risen every quarter since mid-2025, from $454.62 to $1,237.34 by September 18, even as the stock itself fell from a June 30 peak of $1,174.86. Buy ratings climbed from 14 to 24 analysts over that period, and by September 18 GEV carried zero sell or underperform ratings among 33 analysts covered, down from one apiece as recently as June. The gap between the average target and the actual close price, 131.6% as of September 18, is the widest in the past 15 months.
None of that makes GEV cheap in absolute terms. A 44.7x forward multiple is still rich for an industrial equipment maker, and the bull case leans on execution risks that haven’t fully played out: Electrification’s data center order run rate is guided to moderate in the second half after nearly doubling in the first, Onshore Wind orders remain soft on tariff and permitting uncertainty, and the $200 billion backlog milestone, now expected “very early 2027” per management’s September comments, still depends on slot reservation agreements converting to firm orders on schedule.
The Real Test for GE Vernova Isn’t September, It’s the January Earnings Call
The evidence here points toward September’s drop being a sentiment-driven repricing of “AI stocks” as a category rather than a reassessment of GE Vernova’s own numbers. EBITDA and segment margins kept expanding, the Prolec gain distorted net income without touching the operating metrics, and Street targets moved up, not down, through the same weeks the stock fell. That’s a meaningfully different situation than a company whose fundamentals are actually cracking under AI capex jitters.
The unresolved risk is timing, not direction. Management has committed to publishing its 2026 change in equipment margin in backlog and initial 2027 guidance at the January earnings call, the clearest test of whether the backlog conversion pace holds up. Investors should also watch whether Q4 2026 net income repeats the outsized, EBITDA-detached pattern seen in Q4 2025. If it does, that call’s headline profit number will need the same skepticism this one did.
Decide for yourself whether GE Vernova’s backlog conversion can hit management’s early-2027 target. Check GEV’s updated guidance on TIKR for free →
Should You Invest in GE Vernova Inc.?
The only way to really know is to look at the numbers yourself. TIKR gives you free access to the same institutional-quality financial data that professional analysts use to answer exactly that question.
Pull up GEV stock and you’ll see years of historical financials, what Wall Street analysts expect for revenue and earnings in the quarters ahead, how valuation multiples have moved over time, and whether price targets are trending up or down.
You can build a free watchlist to track GE Vernova Inc. alongside every other stock on your radar. No credit card required. Just the data you need to decide for yourself.
Access Professional Tools to Analyze GEV stock on TIKR for Free →
Looking for New Opportunities?
- See what stocks billionaire investors are buying so you can follow the smart money.
- Analyze stocks in as little as 5 minutes with TIKR’s all-in-one, easy-to-use platform.
- The more rocks you overturn… the more opportunities you’ll uncover. Search 100K+ global stocks, global top investor holdings, and more with TIKR.
Disclaimer:
Please note that the articles on TIKR are not intended to serve as investment or financial advice from TIKR or our content team, nor are they recommendations to buy or sell any stocks. We create our content based on TIKR Terminal’s investment data and analysts’ estimates. Our analysis might not include recent company news or important updates. TIKR has no position in any stocks mentioned. Thank you for reading, and happy investing!