Key Takeaways for Snap Inc. Stock as of August 2026
- Revenue Acceleration: Q2 revenue rose 19% YoY to $1.6B.
- Cost Guide Raised: Snap guides Q3 revenue to $1.70B-$1.74B and lifted its full-year infrastructure cost outlook to $1.65B-$1.70B from $1.60B-$1.65B to fund AI capacity.
- Operating Leverage: Costs grew just 4% YoY against 19% revenue growth, pushing adjusted EBITDA up $208M to $250M and free cash flow to $121M.
- Cash Flow Pivot: CFO Doug Hott named free cash flow per share the company’s new primary financial objective, the lever to fund Specs and offset dilution.
Snap’s 19% Revenue Growth Finally Outpaces Its Cost Base
Snap Inc. (SNAP) posted second-quarter 2026 revenue of $1.6 billion on August 3, up 19% year over year, and for the first time in years the cost side of that equation actually cooperated. Advertising revenue rose 9% to $1.28 billion. Other revenue, the mix of Snapchat+, Memory Storage and the new Lens+ AI subscription, jumped 85% to $316 million. Monthly active users reached 971 million, daily actives hit 493 million, and gross margin expanded 7 percentage points to 58%.
None of that would matter much to Snap stock if costs had grown in lockstep. They didn’t. CFO Doug Hott laid out the gap plainly on the Q2 earnings call: “we grew revenue 19% year-over-year, and we only grew costs 4%. And that’s we’re really proud of that.” That four-point cost growth against nineteen-point revenue growth is what pushed adjusted EBITDA up $208 million year over year to $250 million, while net loss improved by $99 million to $164 million. Free cash flow reached $121 million, the eighth straight quarter of positive free cash flow.
That cost restraint traces to a restructuring management announced in April, when it targeted more than $500 million in annualized savings for the back half of 2026, with most of that reduction still unrealized entering the quarter.
Guidance complicates the clean story slightly. Snap raised its full-year infrastructure cost outlook to a range of $1.65 billion to $1.70 billion, up from $1.60 billion to $1.65 billion, to fund the AI and machine learning capacity behind the ad platform. Q3 revenue guidance sits at $1.70 billion to $1.74 billion, with adjusted EBITDA guided to $300 million to $350 million. Some of the Q2 strength came from World Cup ad spending that Hott said will normalize in Q3, against a tougher year-over-year comparison.
Management is also redirecting where the cash goes. Snap ended the quarter with $2.7 billion in cash and marketable securities after repaying more than $2 billion in convertible notes, and it now names free cash flow per share, not revenue growth alone, as its primary financial objective. A new multiyear dilution management program is set to begin in 2027 once the current buyback authorization finishes in Q4. That cash also funds Specs, the company’s augmented reality glasses priced at $2,195, which launch commercially this fall after a September 16 event in Los Angeles. CEO Evan Spiegel called the free cash flow inflection the reason Snap can fund Specs, offset dilution and strengthen its balance sheet all at once, rather than choosing among them.
TIKR Values Snap Stock at $9 on a Free Cash Flow Inflection
TIKR’s mid-case model values Snap at $9 by December 2030, implying an 83% total return from the current price of $5, or 15% annualized over 4.4 years.
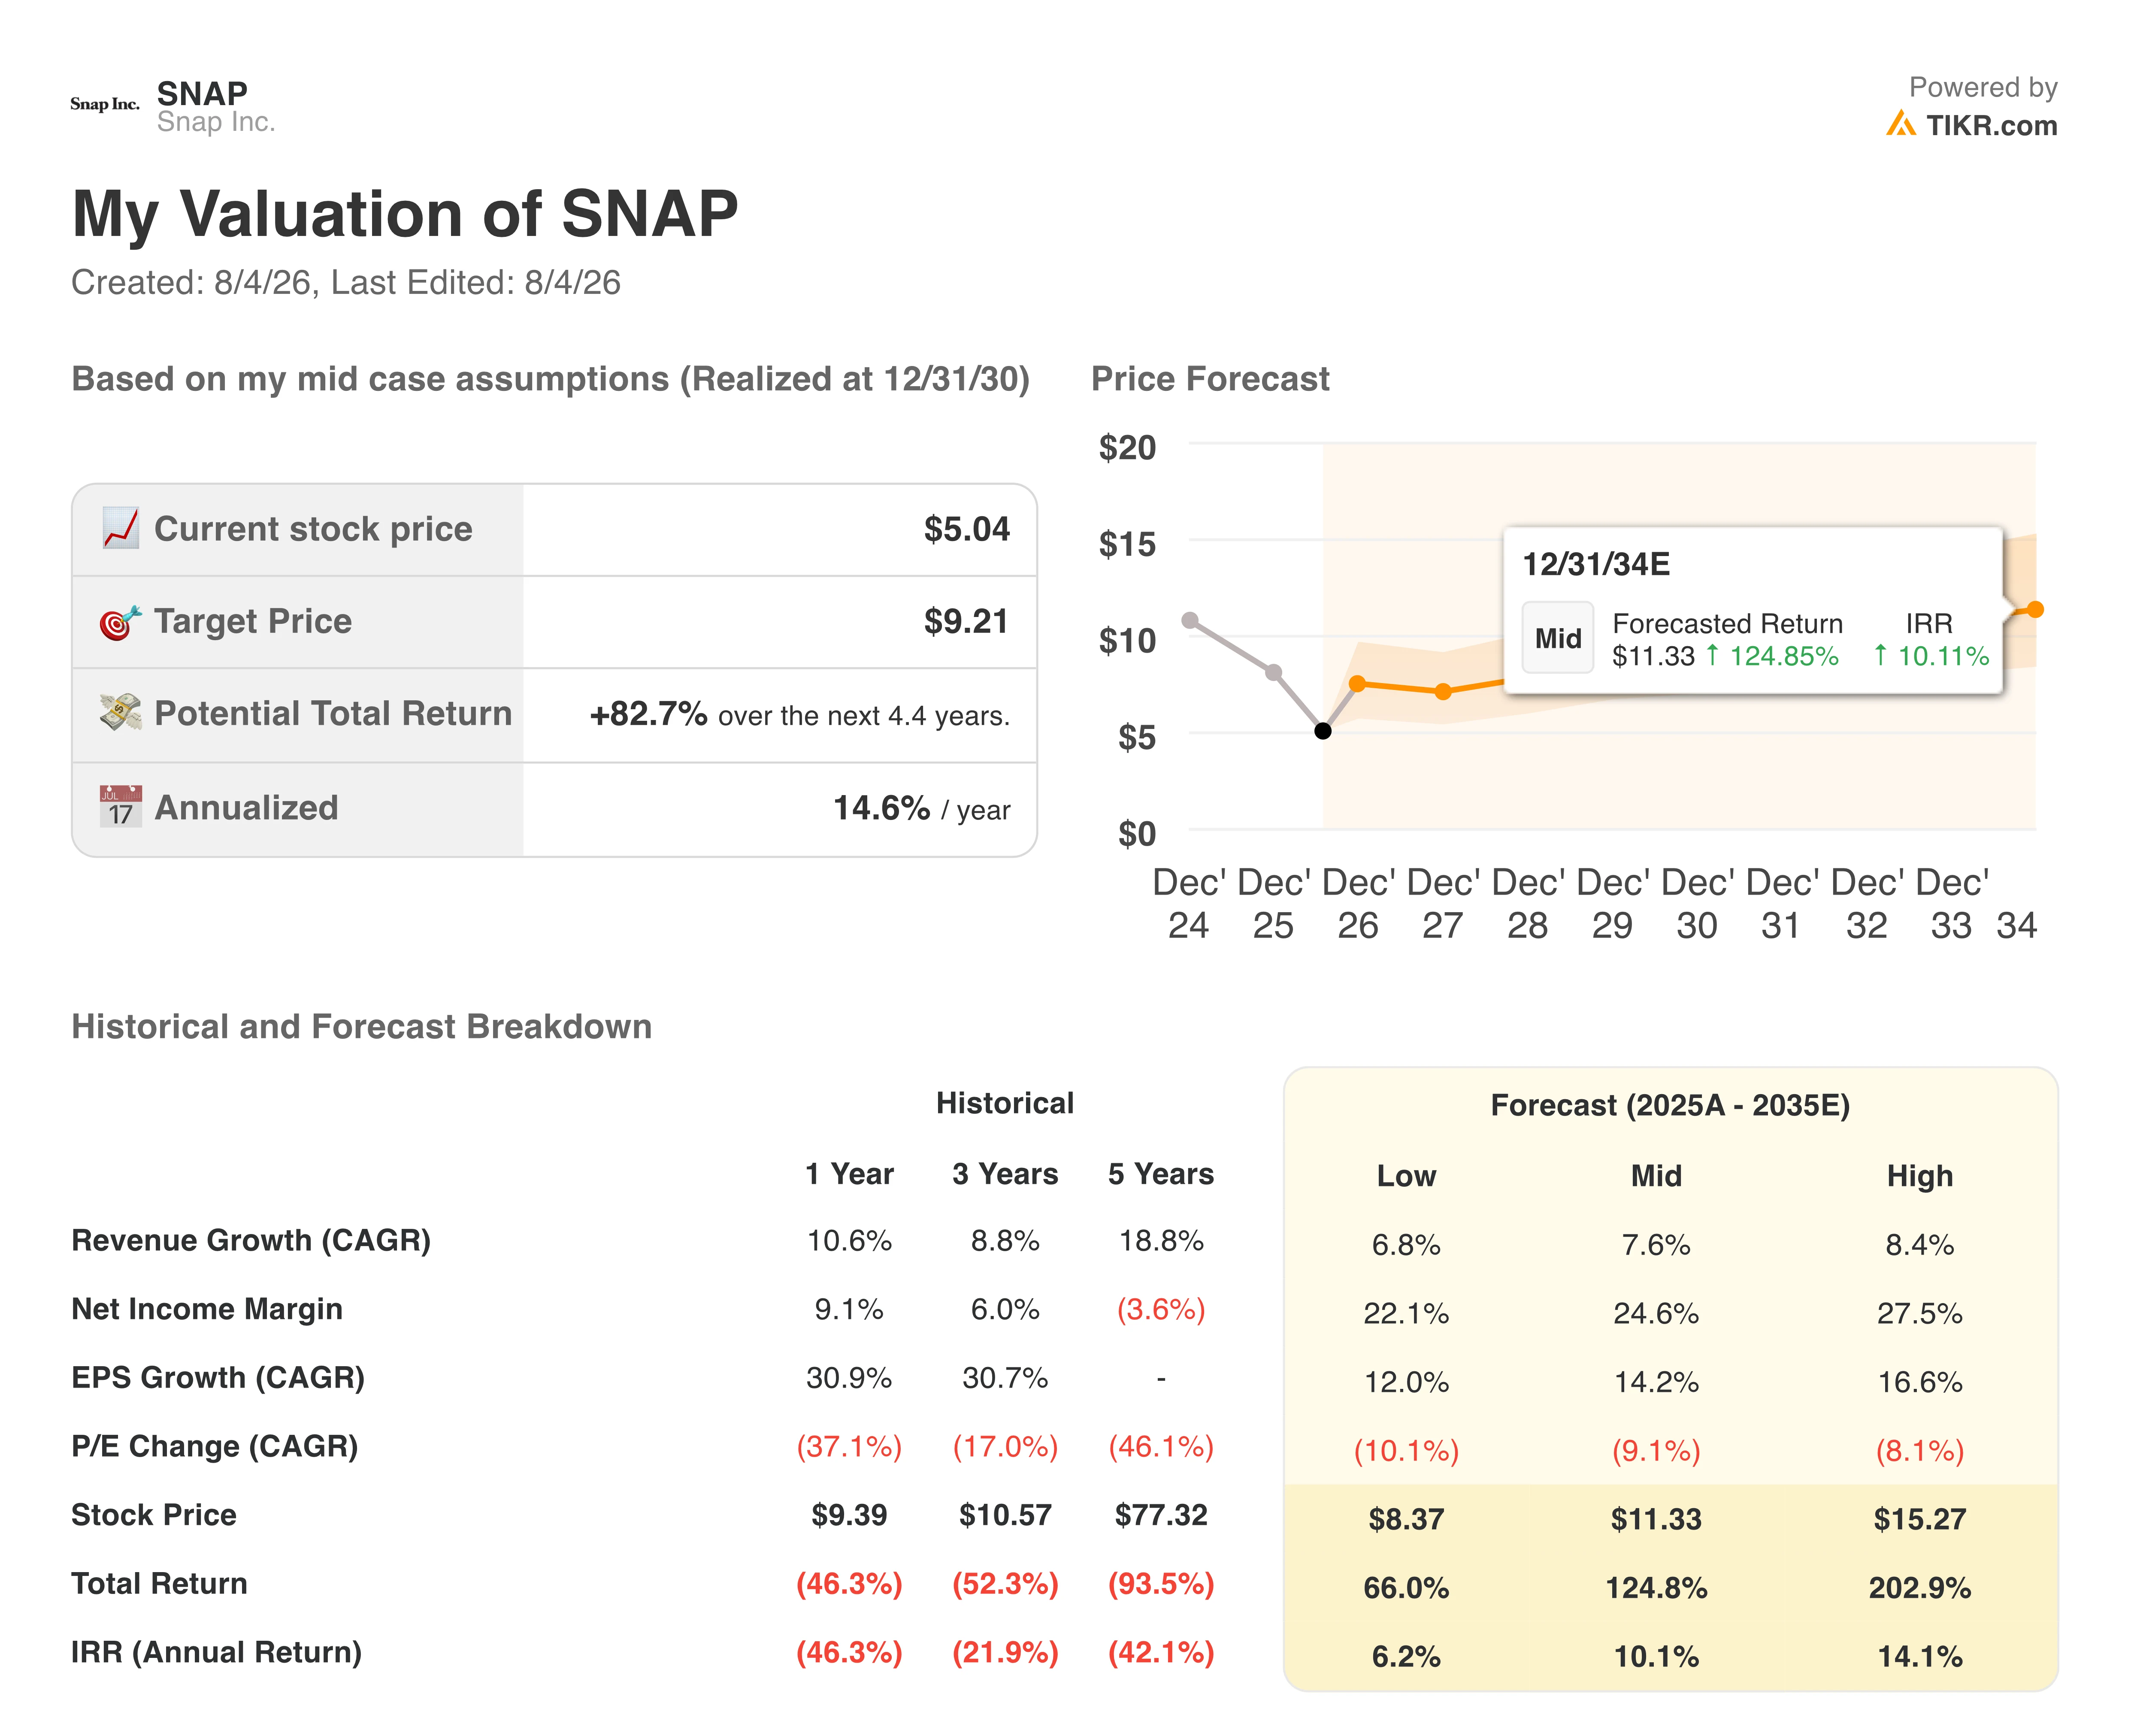
That 15% annualized return marks a sharp reversal from Snap stock’s own recent trajectory: the position lost 46.3% over the past year and 93.5% over five years, before the model’s mid-case scenario turns those losses into a projected 83% total return by 2030.
The target is reachable because the operating leverage behind the second quarter’s $208 million EBITDA swing is structural: infrastructure spending is rising specifically to support the AI-driven ad tools that already cut cost per install 8% and cost per purchase 18% for advertisers. Other revenue, still running off less than 3% subscriber penetration, gives the model a second growth lever that does not depend on Specs succeeding for the return to play out.
Should You Invest in Snap Inc.?
The only way to really know is to look at the numbers yourself. TIKR gives you free access to the same institutional-quality financial data that professional analysts use to answer exactly that question.
Pull up Snap Inc. stock and you’ll see years of historical financials, what Wall Street analysts expect for revenue and earnings in the quarters ahead, how valuation multiples have moved over time, and whether price targets are trending up or down.
You can build a free watchlist to track Snap Inc. alongside every other stock on your radar. No credit card required. Just the data you need to decide for yourself.
Access Professional Tools to Analyze SNAP stock on TIKR for Free →
Looking for New Opportunities?
- See what stocks billionaire investors are buying so you can follow the smart money.
- Analyze stocks in as little as 5 minutes with TIKR’s all-in-one, easy-to-use platform.
- The more rocks you overturn… the more opportunities you’ll uncover. Search 100K+ global stocks, global top investor holdings, and more with TIKR.
Disclaimer:
Please note that the articles on TIKR are not intended to serve as investment or financial advice from TIKR or our content team, nor are they recommendations to buy or sell any stocks. We create our content based on TIKR Terminal’s investment data and analysts’ estimates. Our analysis might not include recent company news or important updates. TIKR has no position in any stocks mentioned. Thank you for reading, and happy investing!