Key Stats for SM Energy Stock
- Past-Week Performance: +3.2%
- 52-Week Range: $17.5 to $32.3
- Current Price: $26.8
What Happened?
SM Energy (SM), an oil and gas producer operating across the Permian, DJ, Uinta, and South Texas basins, is executing a post-merger deleveraging playbook that has already closed a $950M asset sale and refinanced $1B in debt, pushing the stock 53% off its 52-week low of $17.45 to $26.76.
Last February 18, SM agreed to sell ~61,000 net acres and 260 producing wells in South Texas to Caturus Energy for $950M cash, a deal that substantially achieves the company’s $1B divestiture target and sends proceeds directly to debt reduction following its January 30 merger close with Civitas Resources, a $12.8B all-stock deal.
The merger integration is already generating results: SM actioned $185M of its $200M–$300M synergy target just four weeks after close, representing nearly 20% of market cap in present value, while the combined company posted record 2025 adjusted EBITDAX of $2.26B and adjusted free cash flow of $620M, up 28% year over year.
Meanwhile, on March 4, SM launched a $750M tender offer to retire the high-cost 8.375% Civitas notes due 2028, funding the buyback with a new $1B note offering at 6.625% due 2034, a refinancing that directly extends maturities and reduces interest burden on the merged balance sheet.
Furthermore, Beth McDonald, President and CEO, stated on the Q4 2025 earnings call that “our plan was developed to maximize free cash flow in a $60 oil and $3.50 gas environment,” anchoring the entire 2026 capital program to a conservative commodity assumption that gives the deleveraging timeline meaningful downside protection.
The path from here runs through three confirmed catalysts: the $950M South Texas close expected in Q2 2026, the retirement of both the 2026 and $417M 2027 bond maturities targeted this year, and a capital allocation framework that shifts from 80% debt reduction to increasing share buybacks as leverage falls toward the low-1x target, all while the H2 2026 production run rate of 420,000–430,000 BOE/day rolls directly into 2027.
Wall Street’s Take on SM Stock
The $950M South Texas close expected in Q2 2026, combined with the March refinancing that swaps 8.375% Civitas debt for 6.625% notes, directly reduces SM’s interest burden and accelerates the free cash flow available for debt reduction and buybacks.

The Civitas consolidation nearly doubles revenue from $3.15B in 2025A to $6.25B in 2026E, while TIKR projects free cash flow to expand from $580M in 2025A to $870M in 2026E and $1.41B in 2027E as integration costs clear and the reset 11-rig program reaches full capital efficiency.

Eleven analysts cover SM with 6 buys, 6 holds, and 1 underperform, producing a mean price target of $28.45 that implies just 6.3% upside from $26.76, a cautious consensus that reflects skepticism around Civitas integration execution rather than any fundamental challenge to the deleveraging math.
The spread between the $20 low target and $39 high is wide enough to define two distinct scenarios: the bear case prices a commodity selloff that breaks the $60 oil assumption underlying SM’s free cash flow plan, while the $39 bull case prices clean Q2 close of the South Texas divestiture and leverage falling to the low-1x target on schedule.
What Does the Valuation Model Say?
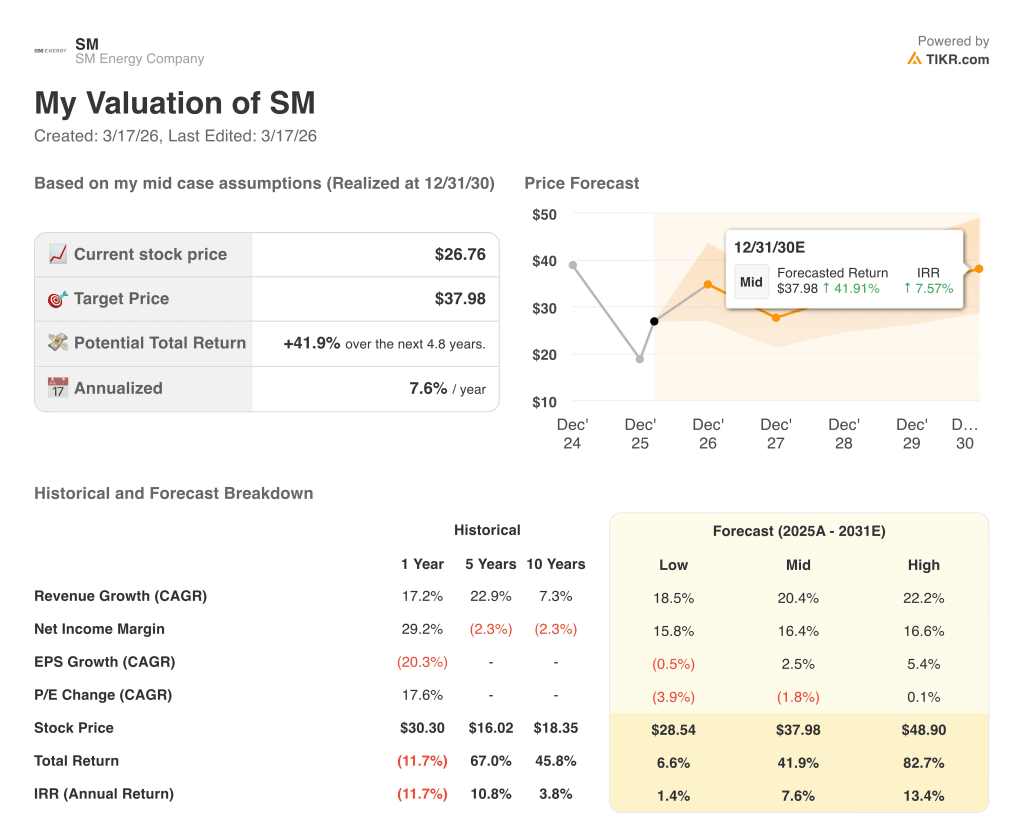
TIKR’s mid-case model prices SM at $37.98 by December 2030, a 41.9% total return at 7.6% annualized IRR, built on a 20.4% revenue CAGR and net income margin recovering from 19.8% in 2025A to 16.4% in the mid-case as the combined portfolio stabilizes. The $185M in synergies already actioned in the first four weeks post-close is the specific operational justification for that margin recovery assumption.
The market prices SM at just 0.53x NAV per share against a mean NAV estimate of $50.36, yet the company already actioned $185M of synergies within four weeks of closing Civitas.
TIKR’s $37.98 mid-case target is supported by the $1.41B FCF projection for 2027, itself underwritten by the reset 11-rig program and the $200M–$300M synergy target now more than halfway actioned.
SM increased its quarterly dividend 10% to $0.22 per share on February 25 while simultaneously committing 80% of quarterly free cash flow to debt reduction, a dual signal management does not make unless FCF visibility is high.
The key risk is oil price: SM built its entire 2026 plan at $60 oil, and any sustained move below that level compresses the FCF available to hit the low-1x leverage target and triggers a reallocation away from buybacks back to debt.
The Q2 2026 South Texas close is the single event to watch: the $950M cash receipt confirms the deleveraging timeline and the number to monitor is whether leverage moves from the mid-1x area toward the low-1x target management set as the trigger for accelerating share repurchases.
Should You Invest in SM Energy Company?
The only way to really know is to look at the numbers yourself. TIKR gives you free access to the same institutional-quality financial data that professional analysts use to answer exactly that question.
Pull up SM stock and you’ll see years of historical financials, what Wall Street analysts expect for revenue and earnings in the quarters ahead, how valuation multiples have moved over time, and whether price targets are trending up or down.
You can build a free watchlist to track SM Energy Company alongside every other stock on your radar. No credit card required. Just the data you need to decide for yourself.
Access Professional Tools to Analyze SM stock on TIKR for Free →