Key Stats for NEM Stock
- Past-Week Performance: 10%
- 52-Week Range: $43 to $135
- Valuation Model Target Price: $128
- Implied Upside: 16%
Analyze your favorite stocks like Newmont Corporation with TIKR (It’s free) >>>
What Happened?
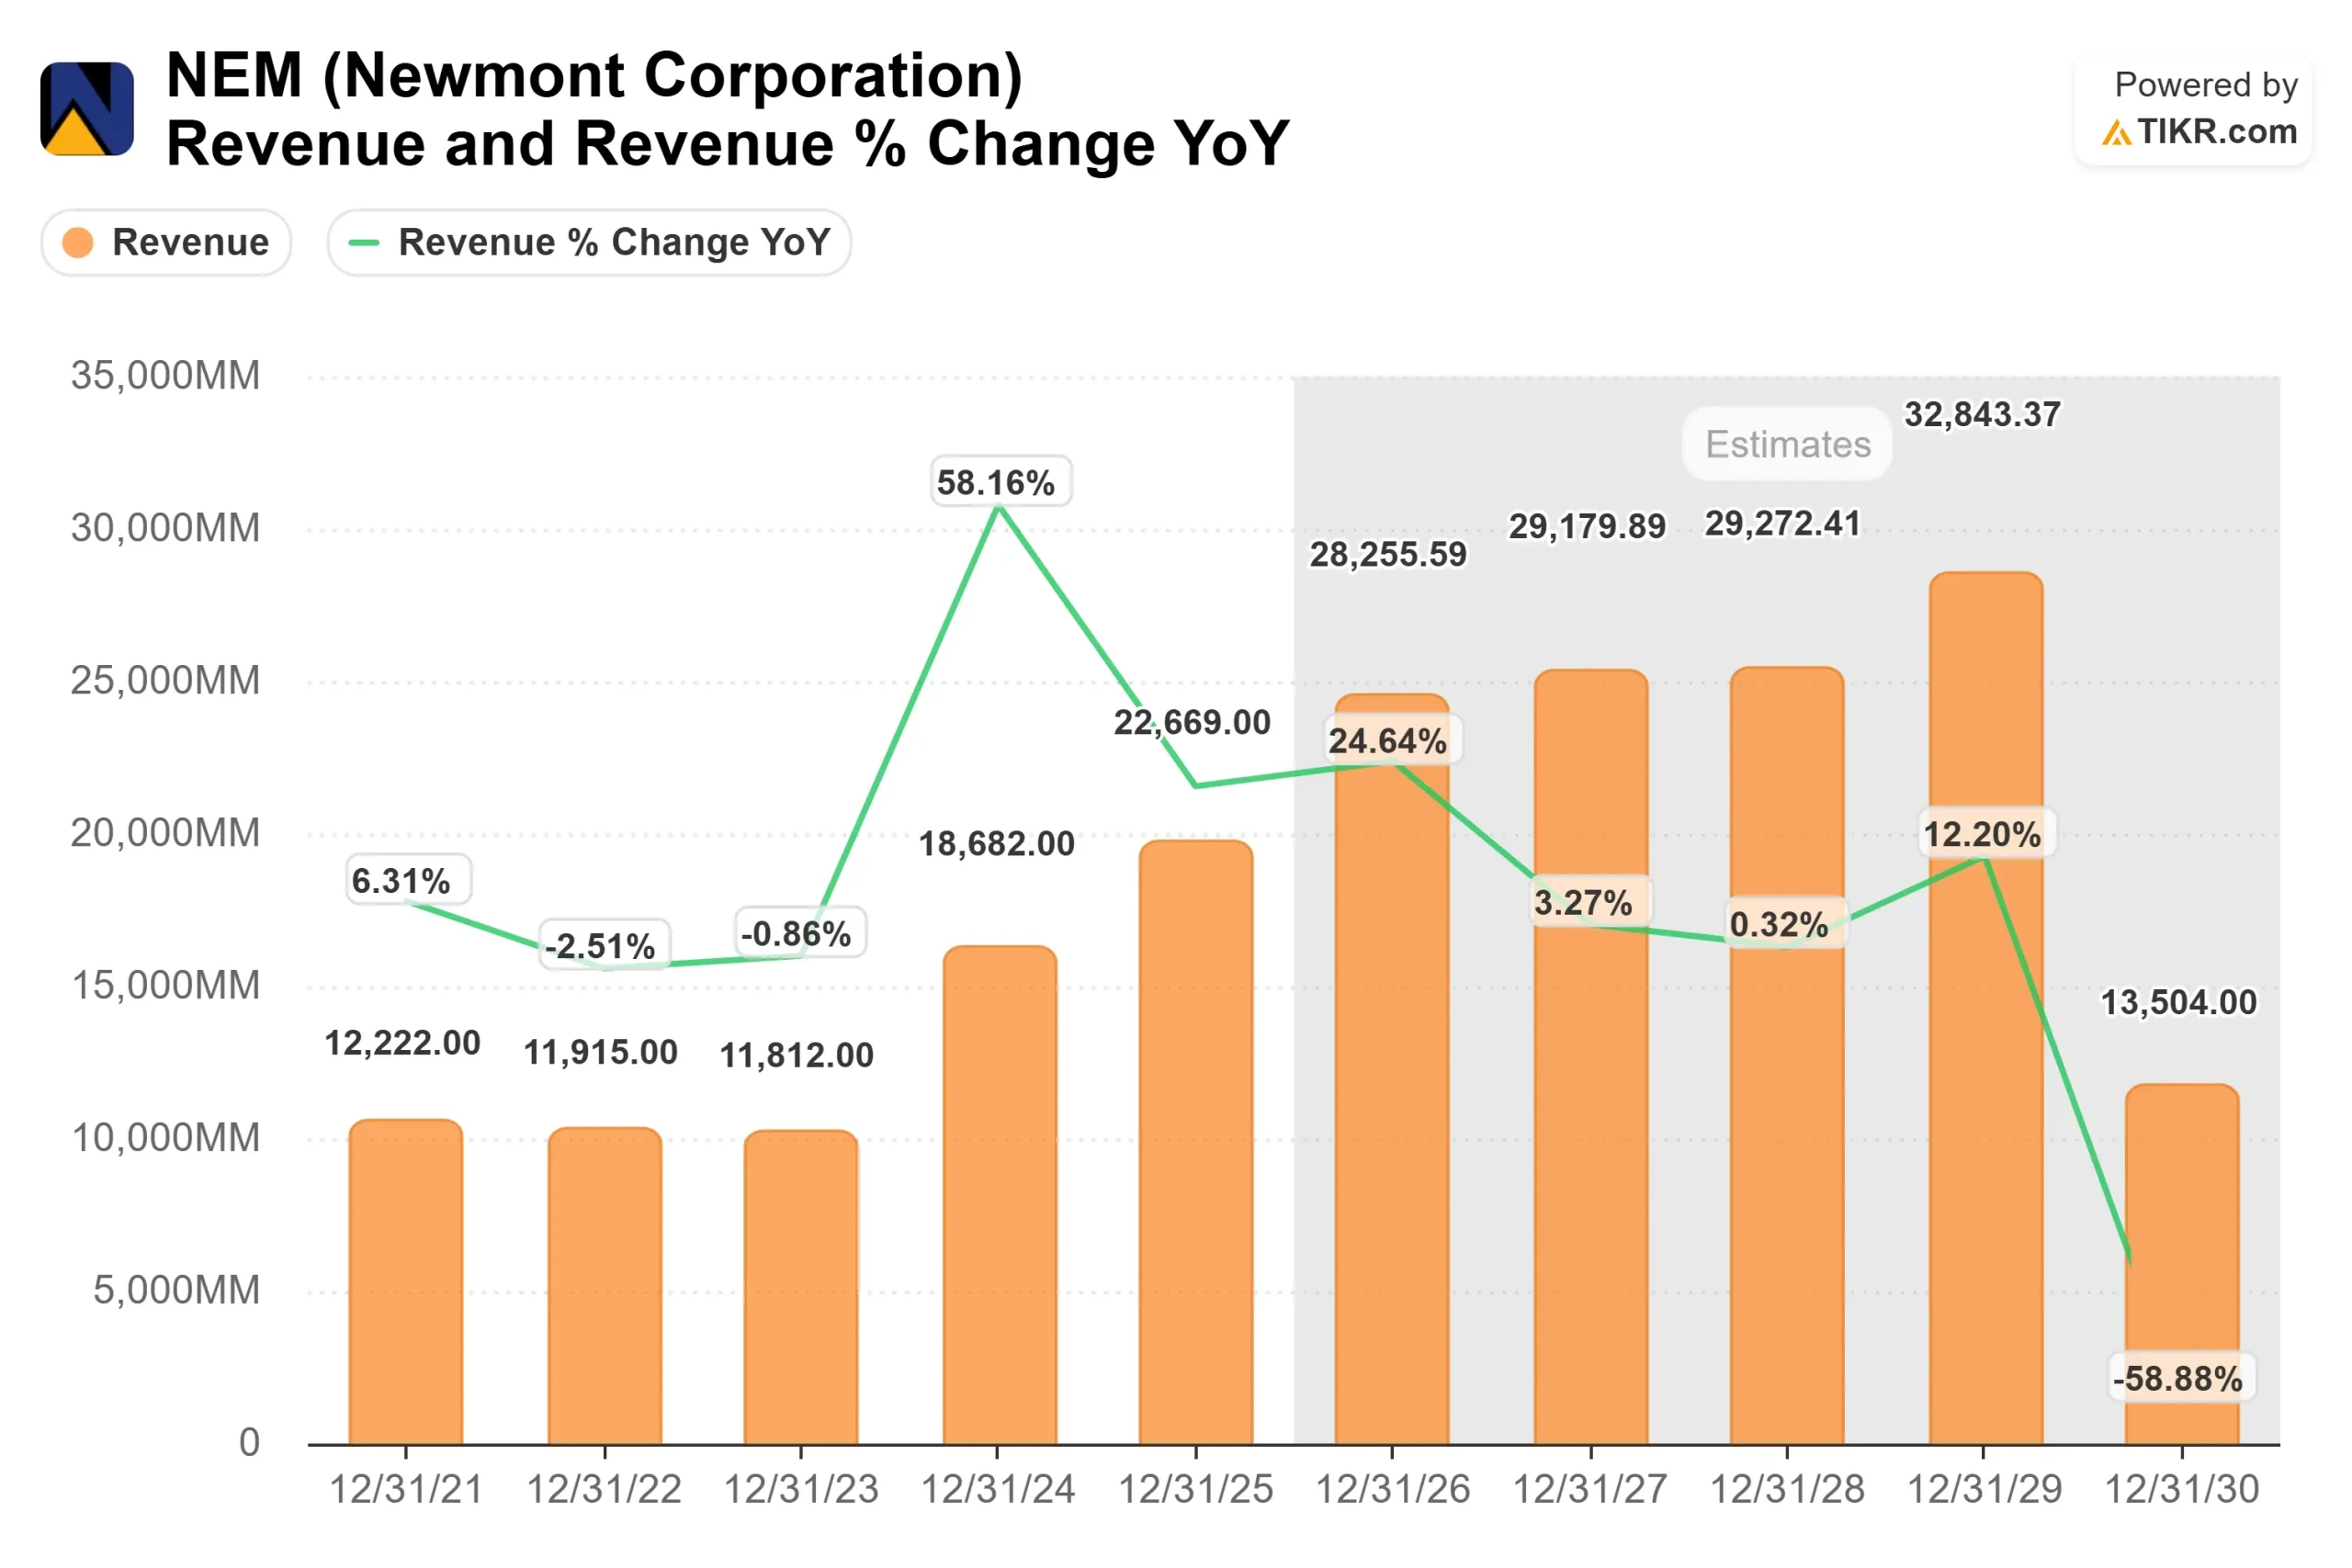
Newmont Corporation stock is up about 10% year to date, recently trading near $110 per share, as elevated gold prices have increased revenue and expanded margins, driving a sharp rise in free cash flow and improving confidence in the company’s earnings outlook.
Gold prices have remained elevated in 2026 as investors position for macro uncertainty, which has supported demand for large-scale gold producers that can convert higher prices into strong cash flow.
Recent earnings results confirmed that momentum. Newmont generated $2.8 billion in fourth-quarter free cash flow and $7.3 billion for the full year, while producing 5.7 million ounces of gold and increasing its dividend by 4%.
CEO Natascha Viljoen said the company “achieved our full year guidance,” while highlighting improved cost discipline and a $100 million reduction in 2026 G&A guidance, supporting a path back to production growth in 2027.
Institutional activity reflects continued conviction with selective rebalancing. Banco Bilbao Vizcaya Argentaria S.A. increased its stake by 112% to about 287,000 shares, while Bank of Nova Scotia added about 469,000 shares, bringing its total to about 1.85 million shares worth about $156 million.
At the same time, CSM Advisors LLC reduced its stake by 39%, and Martingale Asset Management L P cut its position by 21%, suggesting some profit-taking after the recent rally.
Overall, institutional investors still own about 69% of the company, reinforcing steady long-term positioning.

Value Newmont Corporation instantly (Free with TIKR) >>>
Is NEM Undervalued?
Under valuation assumptions, the stock is modeled using:
- Revenue Growth (CAGR): 9%
- Operating Margins: 58%
- Exit P/E Multiple: 12x
Revenue growth is expected to be supported by stable gold prices and incremental production from projects such as Ahafo North and Tanami Expansion 2, which are expected to add new production and improve long-term output.
See analysts’ growth forecasts and price targets for Newmont Corporation (It’s free) >>>
Margins remain a key driver, as Newmont’s cost discipline and scale allow it to convert higher gold prices into strong free cash flow, as demonstrated by its record cash generation.
This means future performance will depend more on sustained gold prices and operational execution than on aggressive production growth, with earnings quality and cost control acting as the primary drivers of returns.
Capital allocation also supports per-share value, with a growing dividend and ongoing share repurchases helping drive earnings per share higher even in a stable production environment.
At current levels, Newmont appears modestly undervalued, with upside driven by continued strength in gold prices, disciplined execution, and a return to production growth over the next several years.
How Much Upside Does NEM Stock Have From Here?
Investors can estimate Newmont Corporation potential share price, or what any stock could be worth, in under a minute using TIKR’s New Valuation Model tool.
All it takes is three simple inputs:
- Revenue Growth
- Operating Margins
- Exit P/E Multiple
From there, TIKR calculates the potential share price and total returns under Bull, Base, and Bear scenarios so you can quickly see whether a stock looks undervalued or overvalued.
If you’re not sure what to enter, TIKR automatically fills in each input using analysts’ consensus estimates, giving you a quick, reliable starting point.
Value Newmont Corporation in under 60 seconds with TIKR (It’s free) >>>