
Key Stats for PayPal Stock
- 52-Week Range: $38.46 – $79.22
- Street Mean Target: ~$60
- Market Cap: ~$53.3B
- NTM P/E: 11.2x
- LTM Gross Margin: 40.5%
- Q2 2026 Total Payment Volume: $486.4B (up 10% YoY)
- FY2026 Adj. EPS Guidance: ~$5.38
Now Live: Discover how much upside your favorite stocks could have using TIKR’s new Valuation Model (It’s free) >>>
A Recovery Built on a Painful Foundation
PayPal’s (PYPL) 2026 has been a story of two halves. Shares fell from the upper $70s to a 52-week low of $38.46 in the spring, an ugly stretch that included the board ousting CEO Alex Chriss just over two years into his tenure and replacing him with Enrique Lores, the former HP chief, in March.
The stock has since climbed roughly 60% from that low, helped by a Q2 earnings beat, raised full-year guidance, and renewed takeover speculation involving Stripe. It is a meaningful recovery, though shares remain well below last year’s highs.
The context for the selloff matters. PayPal spent years after the pandemic boom losing the market’s confidence incrementally, through competition from Apple Pay, Stripe, and Adyen, through an aggressive account growth strategy that padded user counts without improving engagement, and through quarterly disappointments that compounded into a narrative of decline.
Lores inherited that narrative along with the role and has moved quickly to reshape the business into three distinct segments: Checkout Solutions and PayPal, Consumer Financial Services and Venmo, and Payment Services and Crypto.
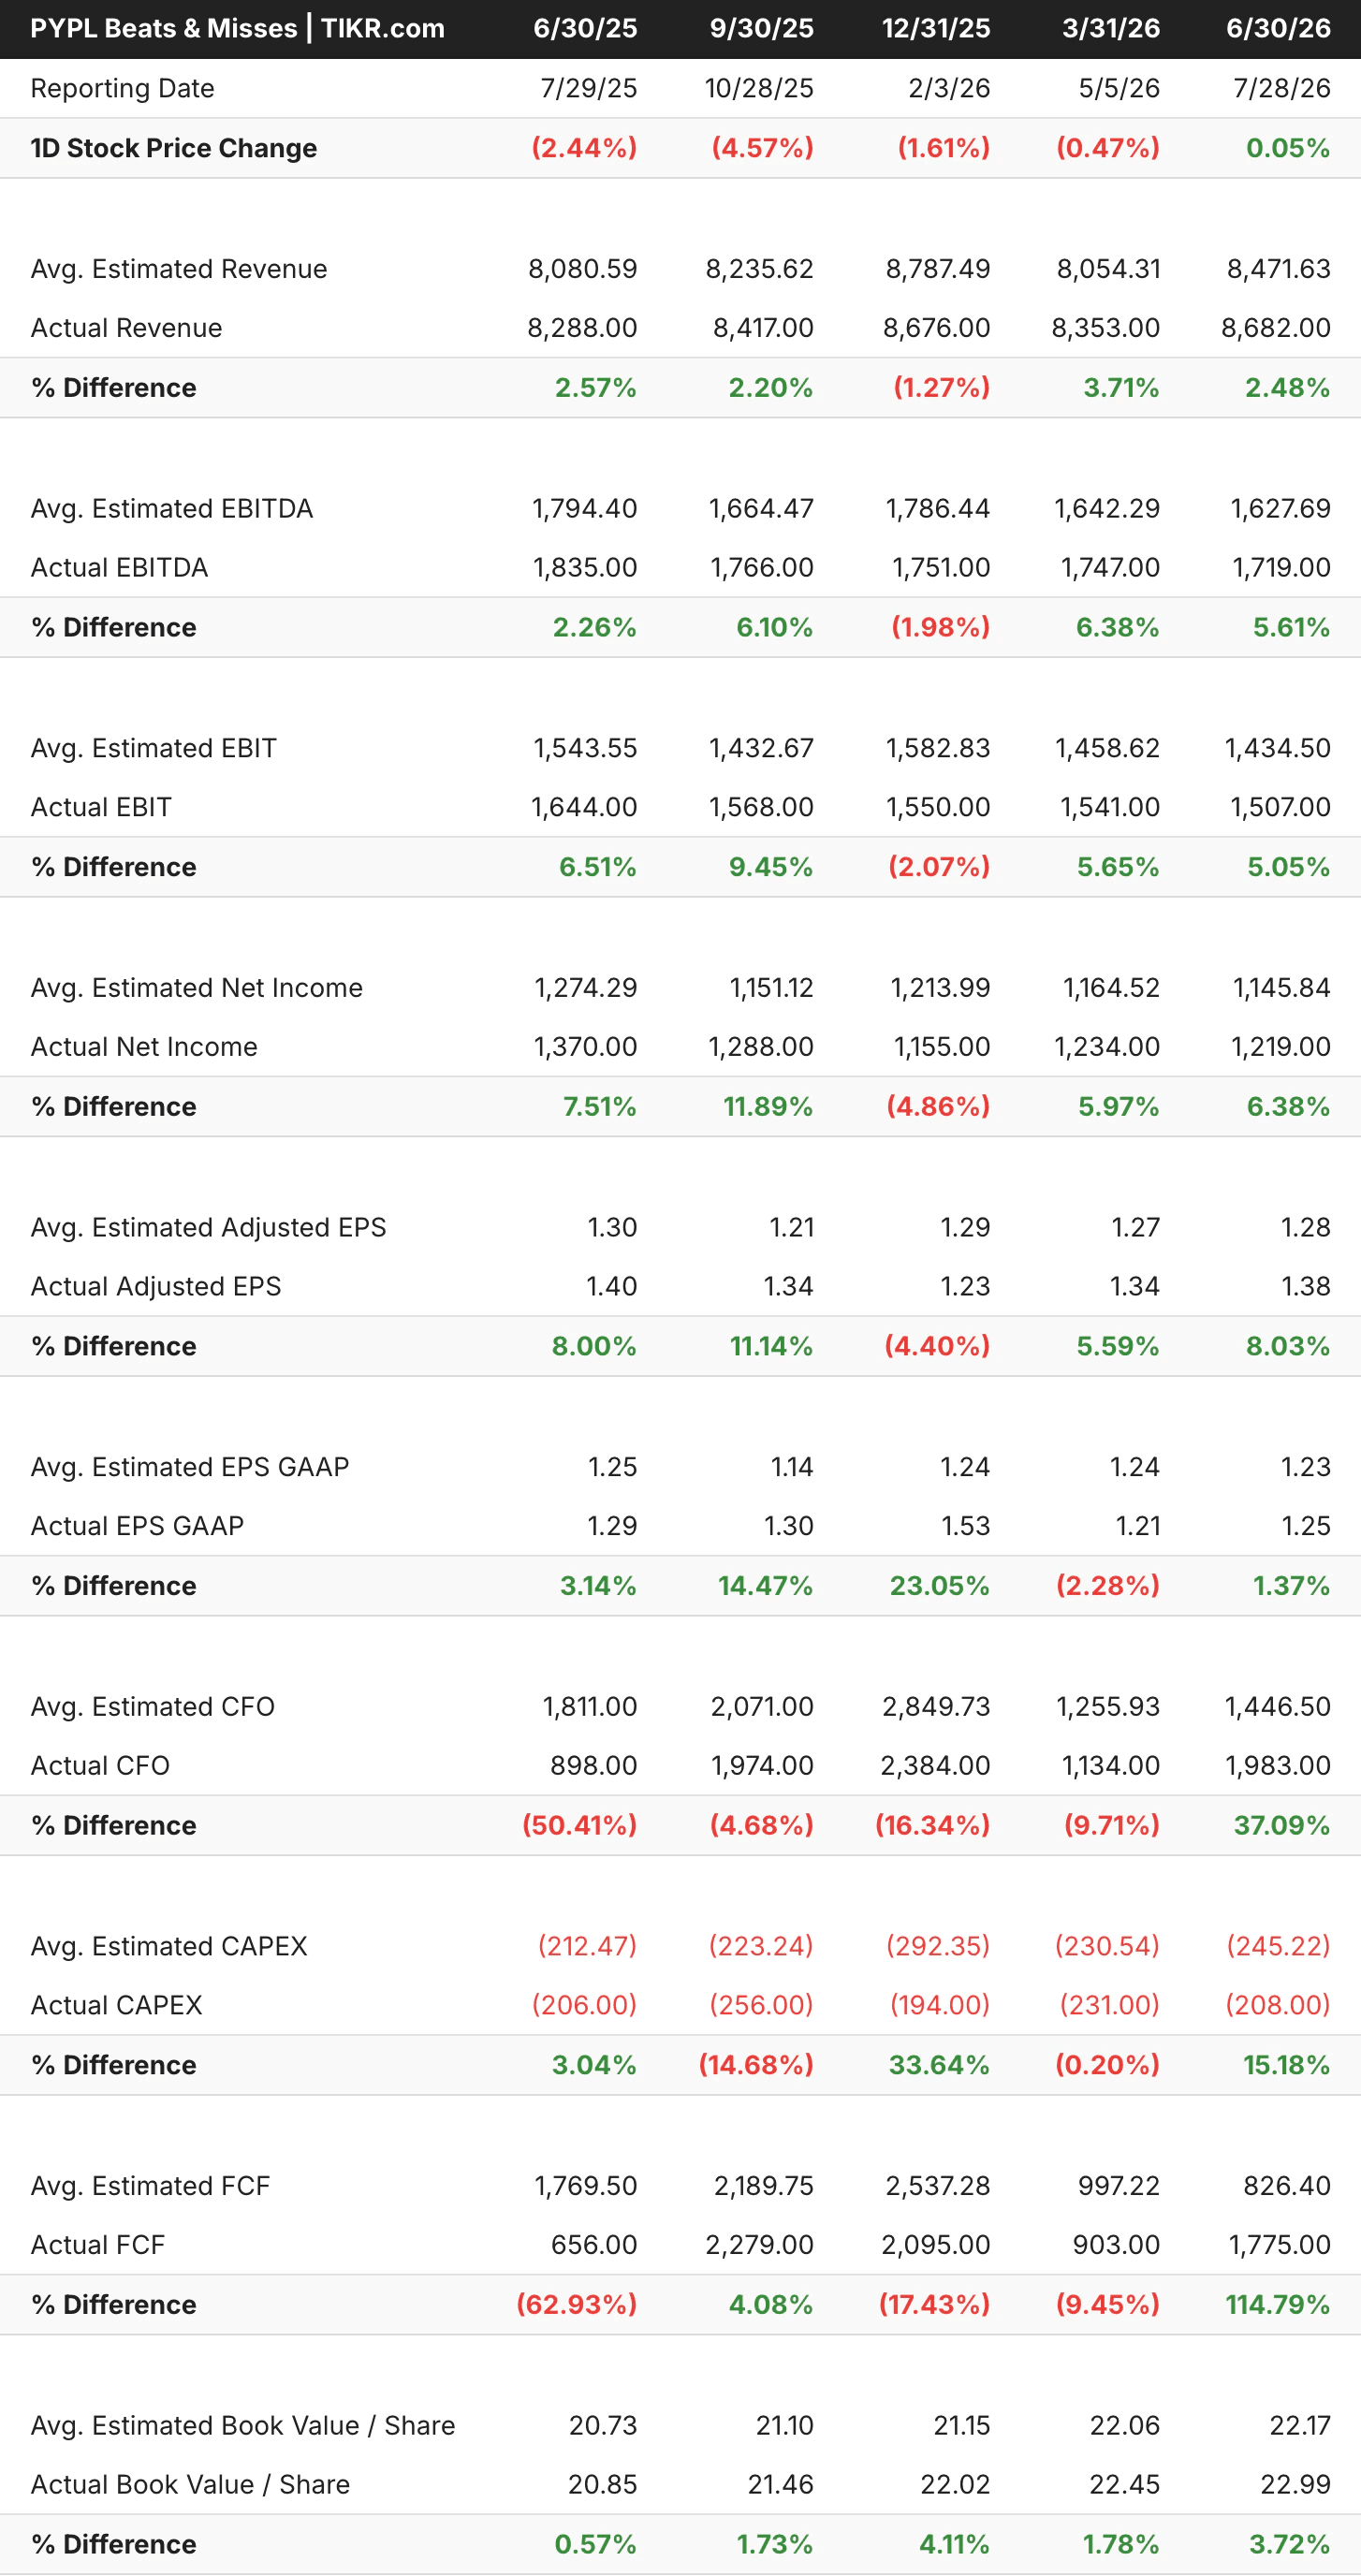
The beats and misses table tells an interesting story about where PayPal stands today. Revenue and EPS beats have been consistent across four of the last five quarters, with Q2 2026 delivering a 2.5% revenue beat and an 8% EPS beat.
The December 2025 quarter was the exception, missing both metrics and contributing to the sentiment collapse that sent shares toward their lows. Most telling is the market’s reaction: the stock moved just 0.05% on Q2 earnings day. Investors see the beats but are not yet willing to pay for them.
See historical and forward estimates for PayPay stock (It’s free!) >>>
What the Numbers Actually Show
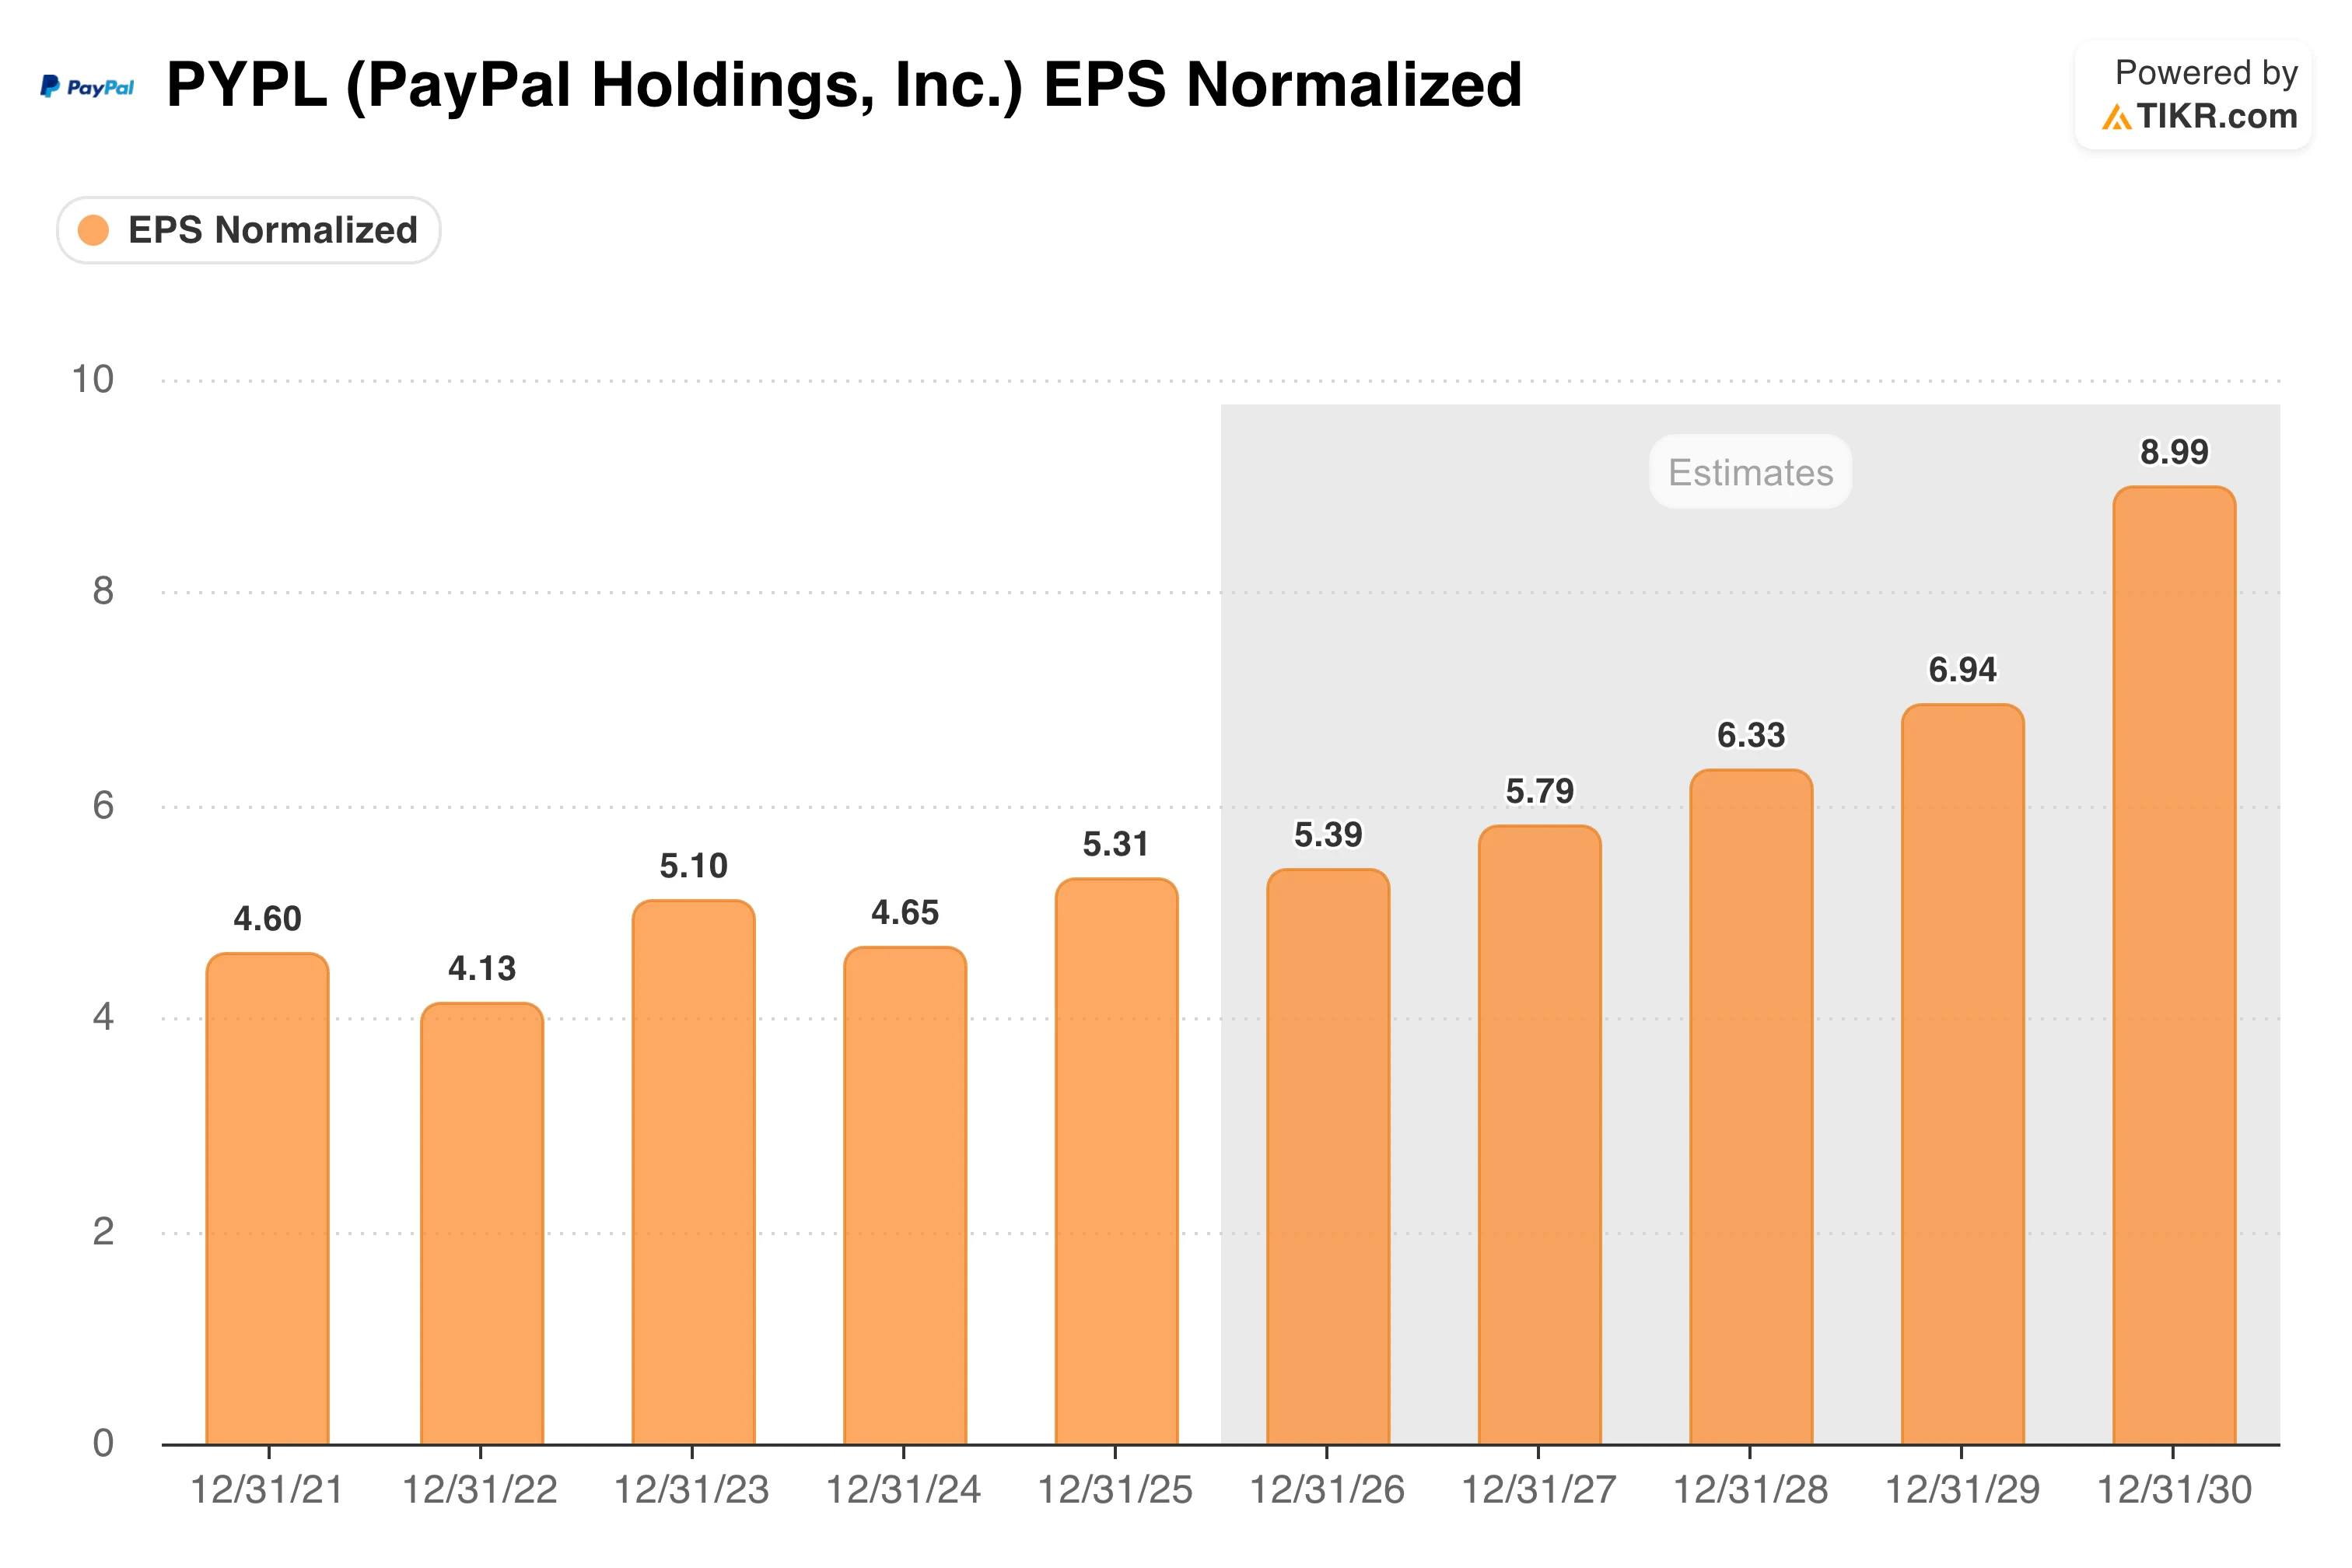
The EPS chart clearly captures PayPal’s fundamental situation. Normalized earnings per share bounced around in a narrow range from 2021 through 2025, never breaking cleanly higher despite significant buyback activity. Full-year EPS was $4.60 in 2021, dipped to $4.13 in 2022, recovered to $5.10 in 2023, slipped back to $4.65 in 2024, and reached $5.31 in 2025. The consistency is real, but the growth rate is not inspiring.
Consensus estimates project EPS climbing from around $5.39 in 2026 toward $5.79 in 2027 and $6.33 in 2028, with a more pronounced step-up later in the decade as buybacks compound.
Lores has pointed to three areas driving Q2 improvement: branded checkout stabilization, Venmo momentum, and Braintree payment volume. Venmo Debit Card monthly active accounts grew more than 50% year over year, and Pay with Venmo volumes grew 34% in Q1.
PayPal now expects full-year adjusted EPS of around $5.38 and is targeting $400 million in gross run-rate savings this year as part of a broader $1.5 billion efficiency program. Constructive developments, though relatively modest ones for a $53 billion company.
See how PayPal performs against its peers in TIKR (It’s free!) >>>
What the Valuation Model Says About PayPal Stock
At around 11 times forward earnings, PayPal trades at a steep discount for any large-cap fintech. The valuation reflects genuine skepticism about whether the turnaround delivers durable growth. One useful data point: the Street mean target sits near $60, which is actually below where the stock trades today.
TIKR’s valuation model targets around $96 per share based on mid-case assumptions, implying roughly a 54% total return from current levels over approximately four and a half years.
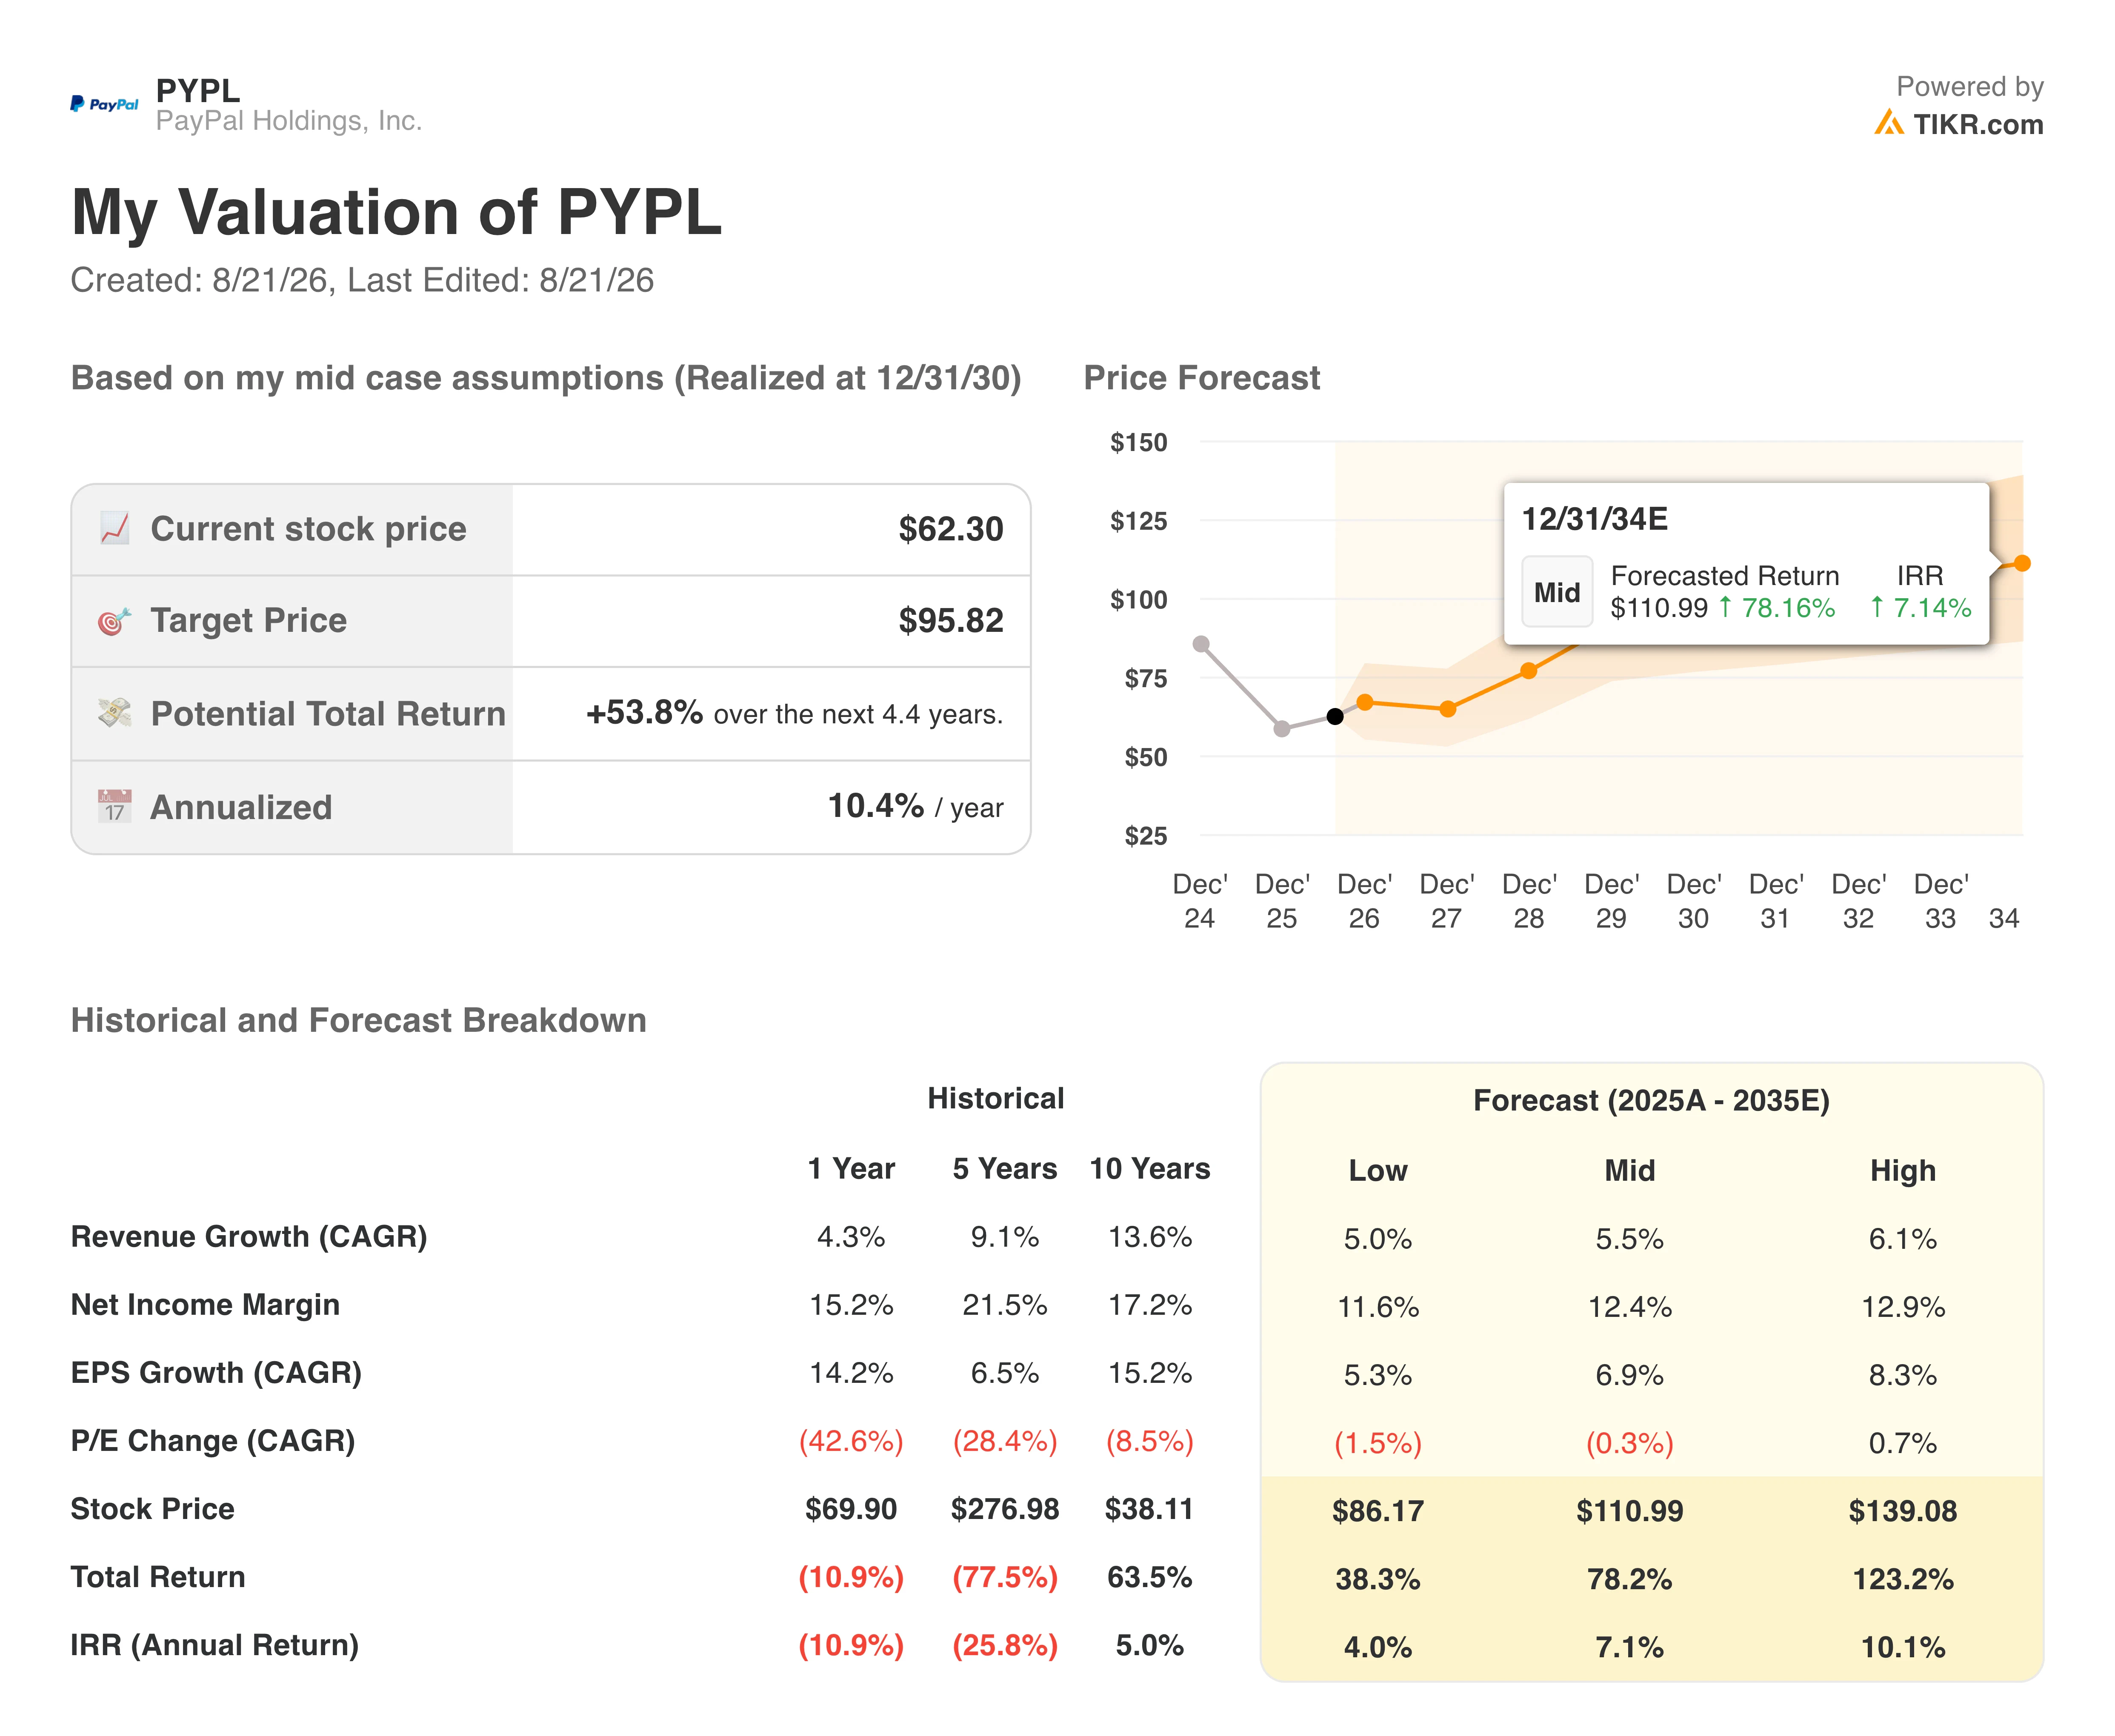
The annualized return works out to around 10% per year, and it is worth being honest about what that means. The mid-case here is not a dramatic re-rating story. It assumes modest revenue growth of around 5-6% annually and net income margins in the low double digits, consistent with what the business is actually producing today.
A longer scenario to 2034 puts the mid-case price near $111 at around a 7% annualized IRR. These are reasonable but not exciting numbers, and they depend on execution that PayPal has yet to fully demonstrate.
Should You Buy PayPal Stock?
PayPal’s setup is genuinely unusual. The business generates real earnings, has a defensible network of over 400 million accounts, owns Venmo as an under-monetized asset with clear growth ahead, and trades at a valuation that implies a lot of skepticism is already priced in.
The company is beating estimates, raising guidance, and executing on cost savings. Stripe acquisition rumors add an optionality layer that no fundamental model can capture.
Revenue growth is tracking around 5%, which is not the profile of a business commanding premium multiples. Branded checkout continues to face structural pressure from Apple Pay and embedded payment alternatives.
The EPS growth path, while positive, relies heavily on buybacks rather than operational acceleration. And the market’s near-flat reaction to a solid Q2 beat signals that investors want sustained execution before they re-rate the stock.
For value-oriented investors with patience, PayPal at 11 times earnings is a credible position. For those expecting a quick re-rating, the evidence suggests the wait may be longer than expected.
See analysts’ growth forecasts and price targets for PayPal stock (It’s free!) >>>
Looking for New Opportunities?
- See which stocks billionaire investors are buying to follow the smart money.
- Analyze stocks in as little as 5 minutes with TIKR’s all-in-one, easy-to-use platform.
- The more rocks you overturn… the more opportunities you’ll uncover. Search 100K+ global stocks, global top investor holdings, and more with TIKR.
Disclaimer:
Please note that the articles on TIKR are not intended to serve as investment or financial advice from TIKR or our content team, nor are they recommendations to buy or sell any stocks. We create our content based on TIKR Terminal’s investment data and analysts’ estimates. Our analysis might not include recent company news or important updates. TIKR has no position in any of the stocks mentioned. Thank you for reading, and happy investing!