

Key Takeaways:
- Orange S.A. is prioritizing fiber, 5G, and infrastructure‑light markets while simplifying its footprint to focus on capital‑efficient growth in Europe and Africa.
- ORA stock could reasonably reach €16 per share by December 2027, based on our valuation assumptions.
- This implies a total return of 12.2% from today’s price of €14, with an annualized return of 6.0% over the next 2.0 years.
Orange S.A. (ORA) is reshaping its business around convergent telecom services, next‑generation networks, and data‑driven wholesale infrastructure while exiting non‑core markets to sharpen returns. The group is leaning on its leadership in fiber in France and Spain, disciplined 5G rollouts, and a fast‑growing Africa & Middle East segment to counter sluggish legacy voice and fixed‑line trends.
The company is also simplifying its portfolio through asset‑light towers and infrastructure partnerships, aiming to improve return on capital while maintaining network quality in core markets.
Recent strategy updates emphasize cost efficiency, deleveraging, and a stable dividend profile, making Orange a potential candidate for investors seeking a blend of income and moderate capital appreciation into the next decade.
Here’s why Orange stock could provide steady total returns through 2029 as it gradually shifts its revenue mix toward higher‑margin broadband, IT services, and infrastructure‑backed cash flows while preserving balance‑sheet discipline.
What the Model Says for Orange S.A. Stock
We analyzed the upside potential for Orange stock using valuation assumptions based on its fiber‑first network strategy in Europe, disciplined 5G deployment, and earnings leverage from cost‑efficiency programs and portfolio simplification.
Based on estimates of 0.7% annual revenue growth, 14.9% operating margins, and a normalized P/E multiple of 12x, the model projects Orange stock could rise from €14 to €16 per share by December 2027.
That would be a 12% total return, or a 6% annualized return over the next 2.0 years.

Our Valuation Assumptions
TIKR’s Valuation Model lets you plug in your own assumptions for a company’s revenue growth, operating margins, and P/E multiple, and calculates the stock’s expected returns.
Here’s what we used for Orange S.A. stock:
1. Revenue growth: 0.7%
Orange’s top line has remained broadly flat over the past decade, with declines in legacy voice and traditional fixed services offset by growth in fiber broadband, convergent offerings, and the Africa & Middle East segment.
The company has demonstrated its ability to grow in select areas, particularly through increasing fiber penetration, bundled service packages, and rising mobile data consumption, though overall group revenue growth remains muted.
From 2024 through 2030, we forecast 0.7% compound annual revenue growth, reflecting modest expansion in faster‑growing segments like Africa & Middle East and digital services, partially offset by ongoing pressure in traditional fixed voice and competitive pricing dynamics in core European markets.
Based on analysts’ consensus estimates, this forecast balances Orange’s ability to leverage its strong fiber and 5G footprint against regulatory headwinds and intense competition in markets such as France and Spain.
2. Operating margins: 14.9%
Orange’s profitability has improved over the medium term as cost‑efficiency programs, network‑sharing initiatives, and simplification of its footprint help to offset inflationary pressures and spectrum‑related costs. While margins have fluctuated year to year, the group has generally trended toward mid‑single‑digit to high‑single‑digit net income margins as it optimizes its asset base.
Based on analysts’ consensus estimates, we forecast 14.9% operating margins, assuming continued benefits from fiber migration, lower maintenance costs versus legacy copper, and disciplined capital spending, partly offset by competitive pricing and higher energy and wage costs. This strikes a balance between Orange’s efficiency gains and the structural challenges of operating in heavily regulated, mature telecom markets.
3. Exit P/E multiple: 12x
Orange stock currently trades at a P/E multiple of 13.1x, reflecting investor caution around European regulation, sluggish growth, and high capital intensity. Over the last decade, the stock’s valuation has typically remained compressed despite stable cash flows, in part because of regulatory risks and limited organic growth.
Based on analysts’ consensus estimates, we maintain a 12x exit multiple given Orange’s status as a mature, income‑oriented telecom with modest growth prospects.
If management can demonstrate more durable earnings growth through fiber, 5G, and infrastructure‑light strategies, there could be room for a higher multiple, but the base case remains conservative and in line with the company’s recent average valuation.
Build your own Valuation Model to value any stock (It’s free!) >>>
What Happens If Things Go Better or Worse?
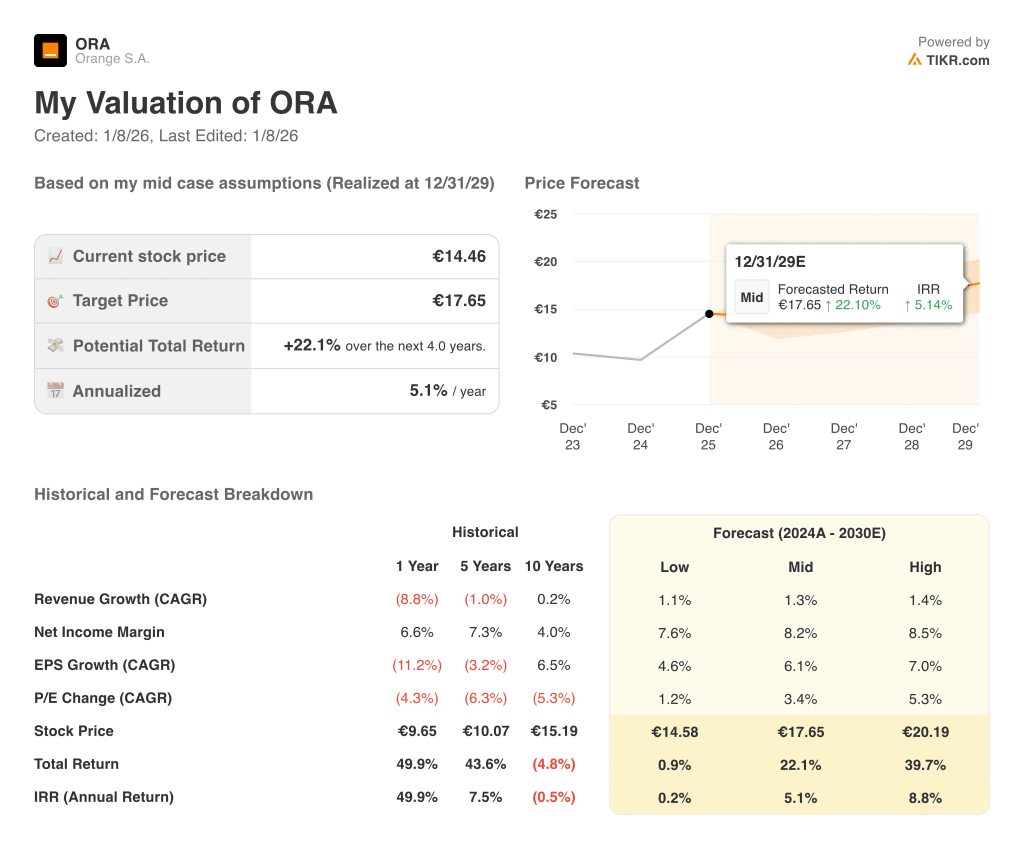
Different scenarios for ORA stock through 2030 show varied outcomes based on execution on cost savings, growth in Africa & the Middle East, and the stability of competitive dynamics in core European markets (these are estimates, not guaranteed returns):
- Low Case: Network investments face slower payback, and competition remains intense → 0.2% annual returns.
- Mid Case: Fiber, 5G, and efficiency programs track expectations → 5.1% annual returns.
- High Case: Stronger‑than‑expected growth in Africa & the Middle East and a higher valuation multiple → 8.8% annual returns.
Even in the conservative case, Orange stock offers positive modeled returns supported by its entrenched market positions, relatively resilient cash flows, and focus on capital discipline and shareholder distributions.
ORA Stock Valuation Model (TIKR)
See what analysts think about ORA stock right now (Free with TIKR) >>>
How Much Upside Does Orange S.A. Stock Have From Here?
With TIKR’s new Valuation Model tool, you can estimate a stock’s potential share price in under a minute.
All it takes is three simple inputs:
- Revenue Growth
- Operating Margins
- Exit P/E Multiple
If you’re not sure what to enter, TIKR automatically fills in each input using analysts’ consensus estimates, giving you a quick, reliable starting point.
From there, TIKR calculates the potential share price and total returns under Bull, Base, and Bear scenarios so you can quickly see whether a stock looks undervalued or overvalued.
See a stock’s true value in under 60 seconds (Free with TIKR) >>>
Looking for New Opportunities?
- See what stocks billionaire investors are buying so you can follow the smart money.
- Analyze stocks in as little as 5 minutes with TIKR’s all-in-one, easy-to-use platform.
- The more rocks you overturn… the more opportunities you’ll uncover. Search 100K+ global stocks, global top investor holdings, and more with TIKR.
Disclaimer:
Please note that the articles on TIKR are not intended to serve as investment or financial advice from TIKR or our content team, nor are they recommendations to buy or sell any stocks. We create our content based on TIKR Terminal’s investment data and analysts’ estimates. Our analysis might not include recent company news or important updates. TIKR has no position in any stocks mentioned. Thank you for reading, and happy investing!


