Key Stats for Johnson & Johnson Stock
- Past-Week Performance: 3%
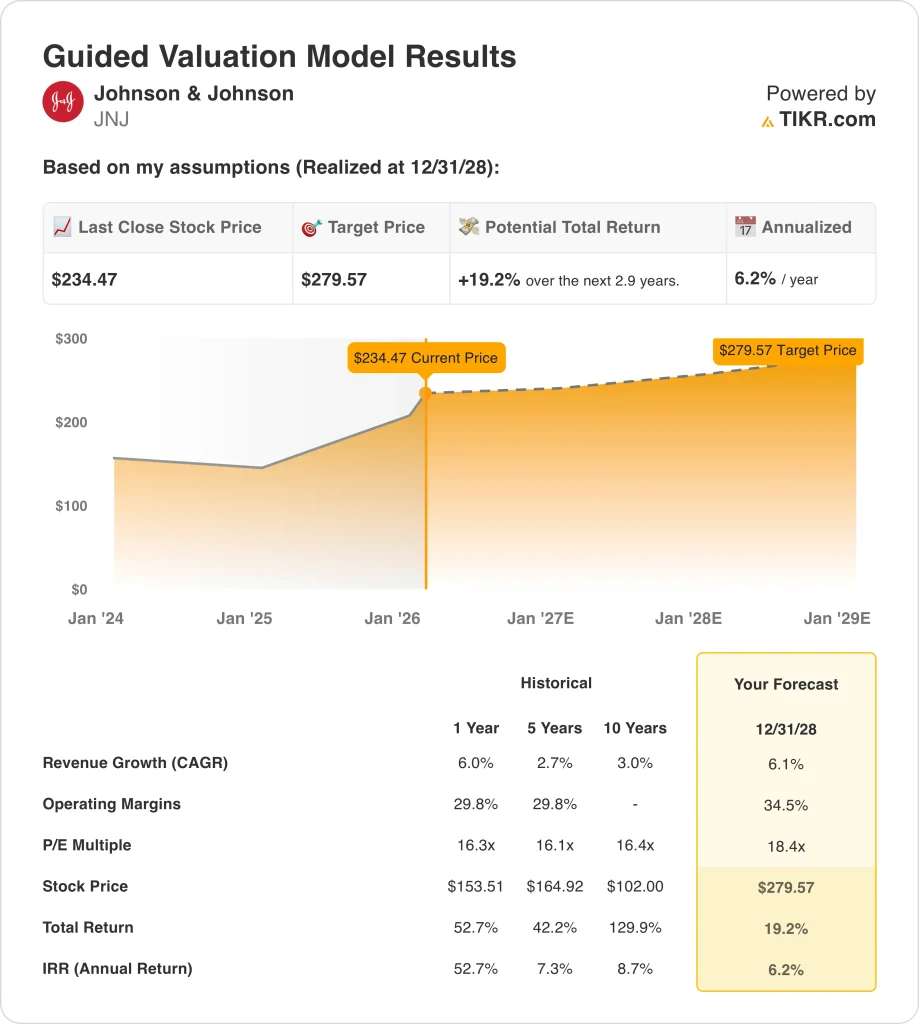
- 52-Week Range: $142 to $236
- Valuation Model Target Price: $280
- Implied Upside: 19% over 2.9 years
What Happened to JNJ Stock?
Johnson & Johnson (JNJ) shares rose 3% over the past week amid several regulatory, legal, and policy updates.
On January 30, the company disclosed that the EMA’s CHMP issued a positive opinion for AKEEGA to treat mHSPC patients with BRCA1/2 mutations.
The CHMP opinion supported an indication extension for niraparib and abiraterone with prednisone or prednisolone and ADT, pending final European approval.
Meanwhile, last January 21, Reuters reported a J&J executive said the company expects free cash flow to rise to about $21 billion in 2026.
Management also cited an estimated full-year MedTech tariff impact of about $500 million, which it said exceeds the 2025 impact.
The same call said J&J does not expect ACA subsidy losses or policy changes under the “One Big Beautiful Bill” to materially affect MedTech performance.
On January 28, the FDA approved DARZALEX FASPRO with bortezomib, lenalidomide, and dexamethasone for newly diagnosed multiple myeloma patients.
Also last week, J&J presented real-world data showing ERLEADA reduced death risk by 51% versus darolutamide in mCSPC patients treated without docetaxel.
Reuters also reported CEO Joaquin Duato disclosed a disposal of Johnson & Johnson common shares in an SEC filing dated January 28 and reported J&J pledged to raise U.S. investments by 25% to $55 billion over four years as drugmakers prepared for tariff threats.
Is Johnson & Johnson Stock Fairly Valued Right Now?
Under the valuation model shown, the stock is modeled using:
- Revenue Growth: 6.1%
- Operating Margins: 34.5%
- Exit P/E Multiple: 18.4x
Johnson & Johnson operates as a scaled healthcare platform, with revenue projected to compound at roughly 6.1% annually through 2028, reflecting a post-separation growth normalization.
That growth profile represents a transition from uneven recent performance to a steadier trajectory, consistent with a diversified pharmaceutical and MedTech business operating at global scale.
Profitability is already established rather than emerging, with operating margins modeled to expand toward 34.5%, above historical levels, reflecting mix improvement and operating discipline.
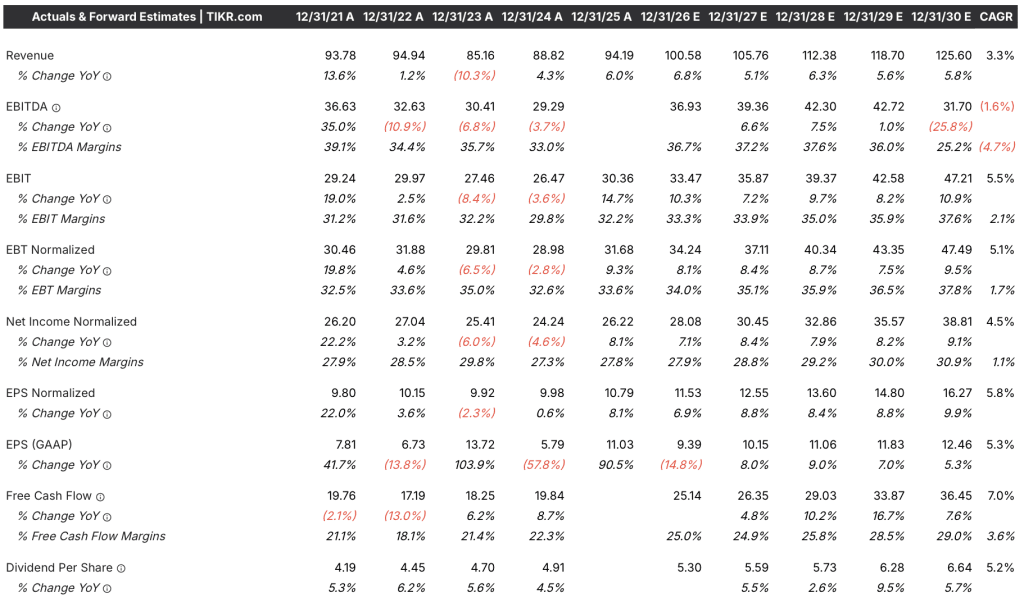
EBIT and net income growth track margin expansion rather than volume acceleration which indicates operating leverage driven by portfolio quality instead of cost cutting.
Free cash flow remains consistently positive across the model and supports valuation durability, with cash generation scaling alongside earnings rather than relying on one-time drivers.
The forecast assumes normalization rather than sustained acceleration, acknowledging margin and growth moderation without disrupting the long-term cash flow profile.
Valuation relies on execution rather than multiple expansion, as the exit P/E of 18.4x represents a modest premium to JNJ’s historical range rather than an aggressive re-rating.
Thus, based on these operating and valuation inputs, JNJ stock appears undervalued relative to the model’s $280 target over a roughly 2.9-year timeframe.
The current share price implies slower execution and margin realization than the model assumes, making valuation outcomes dependent on steady delivery rather than strategic change.
Value Any Stock in Under 60 Seconds (It’s Free)
With TIKR’s new Valuation Model tool, you can estimate a stock’s potential share price in under a minute.
All it takes is three simple inputs:
- Revenue Growth
- Operating Margins
- Exit P/E Multiple
From there, TIKR calculates the potential share price and total returns under Bull, Base, and Bear scenarios so you can quickly see whether a stock looks undervalued or overvalued.
If you’re not sure what to enter, TIKR automatically fills in each input using analysts’ consensus estimates, giving you a quick, reliable starting point.