
Competitive advantage, often called a moat, is a company’s ability to generate returns on capital above its cost of capital for extended periods. It acts as a defensive barrier, allowing a firm to protect its profits from the relentless forces of market competition and new entry.
Without such an advantage, even a growing business eventually sees its margins competed away until it achieves only average profitability. Identifying a true advantage requires looking beyond surface-level growth to find structural features that prevent rivals from taking market share or forcing price cuts.
The best investors focus on measurable evidence of these moats. While market narratives are helpful, the most durable competitive advantages manifest in consistent financial data that reveals a company’s ability to win in its industry over the long term.
Sustainable High Margins and Pricing Power

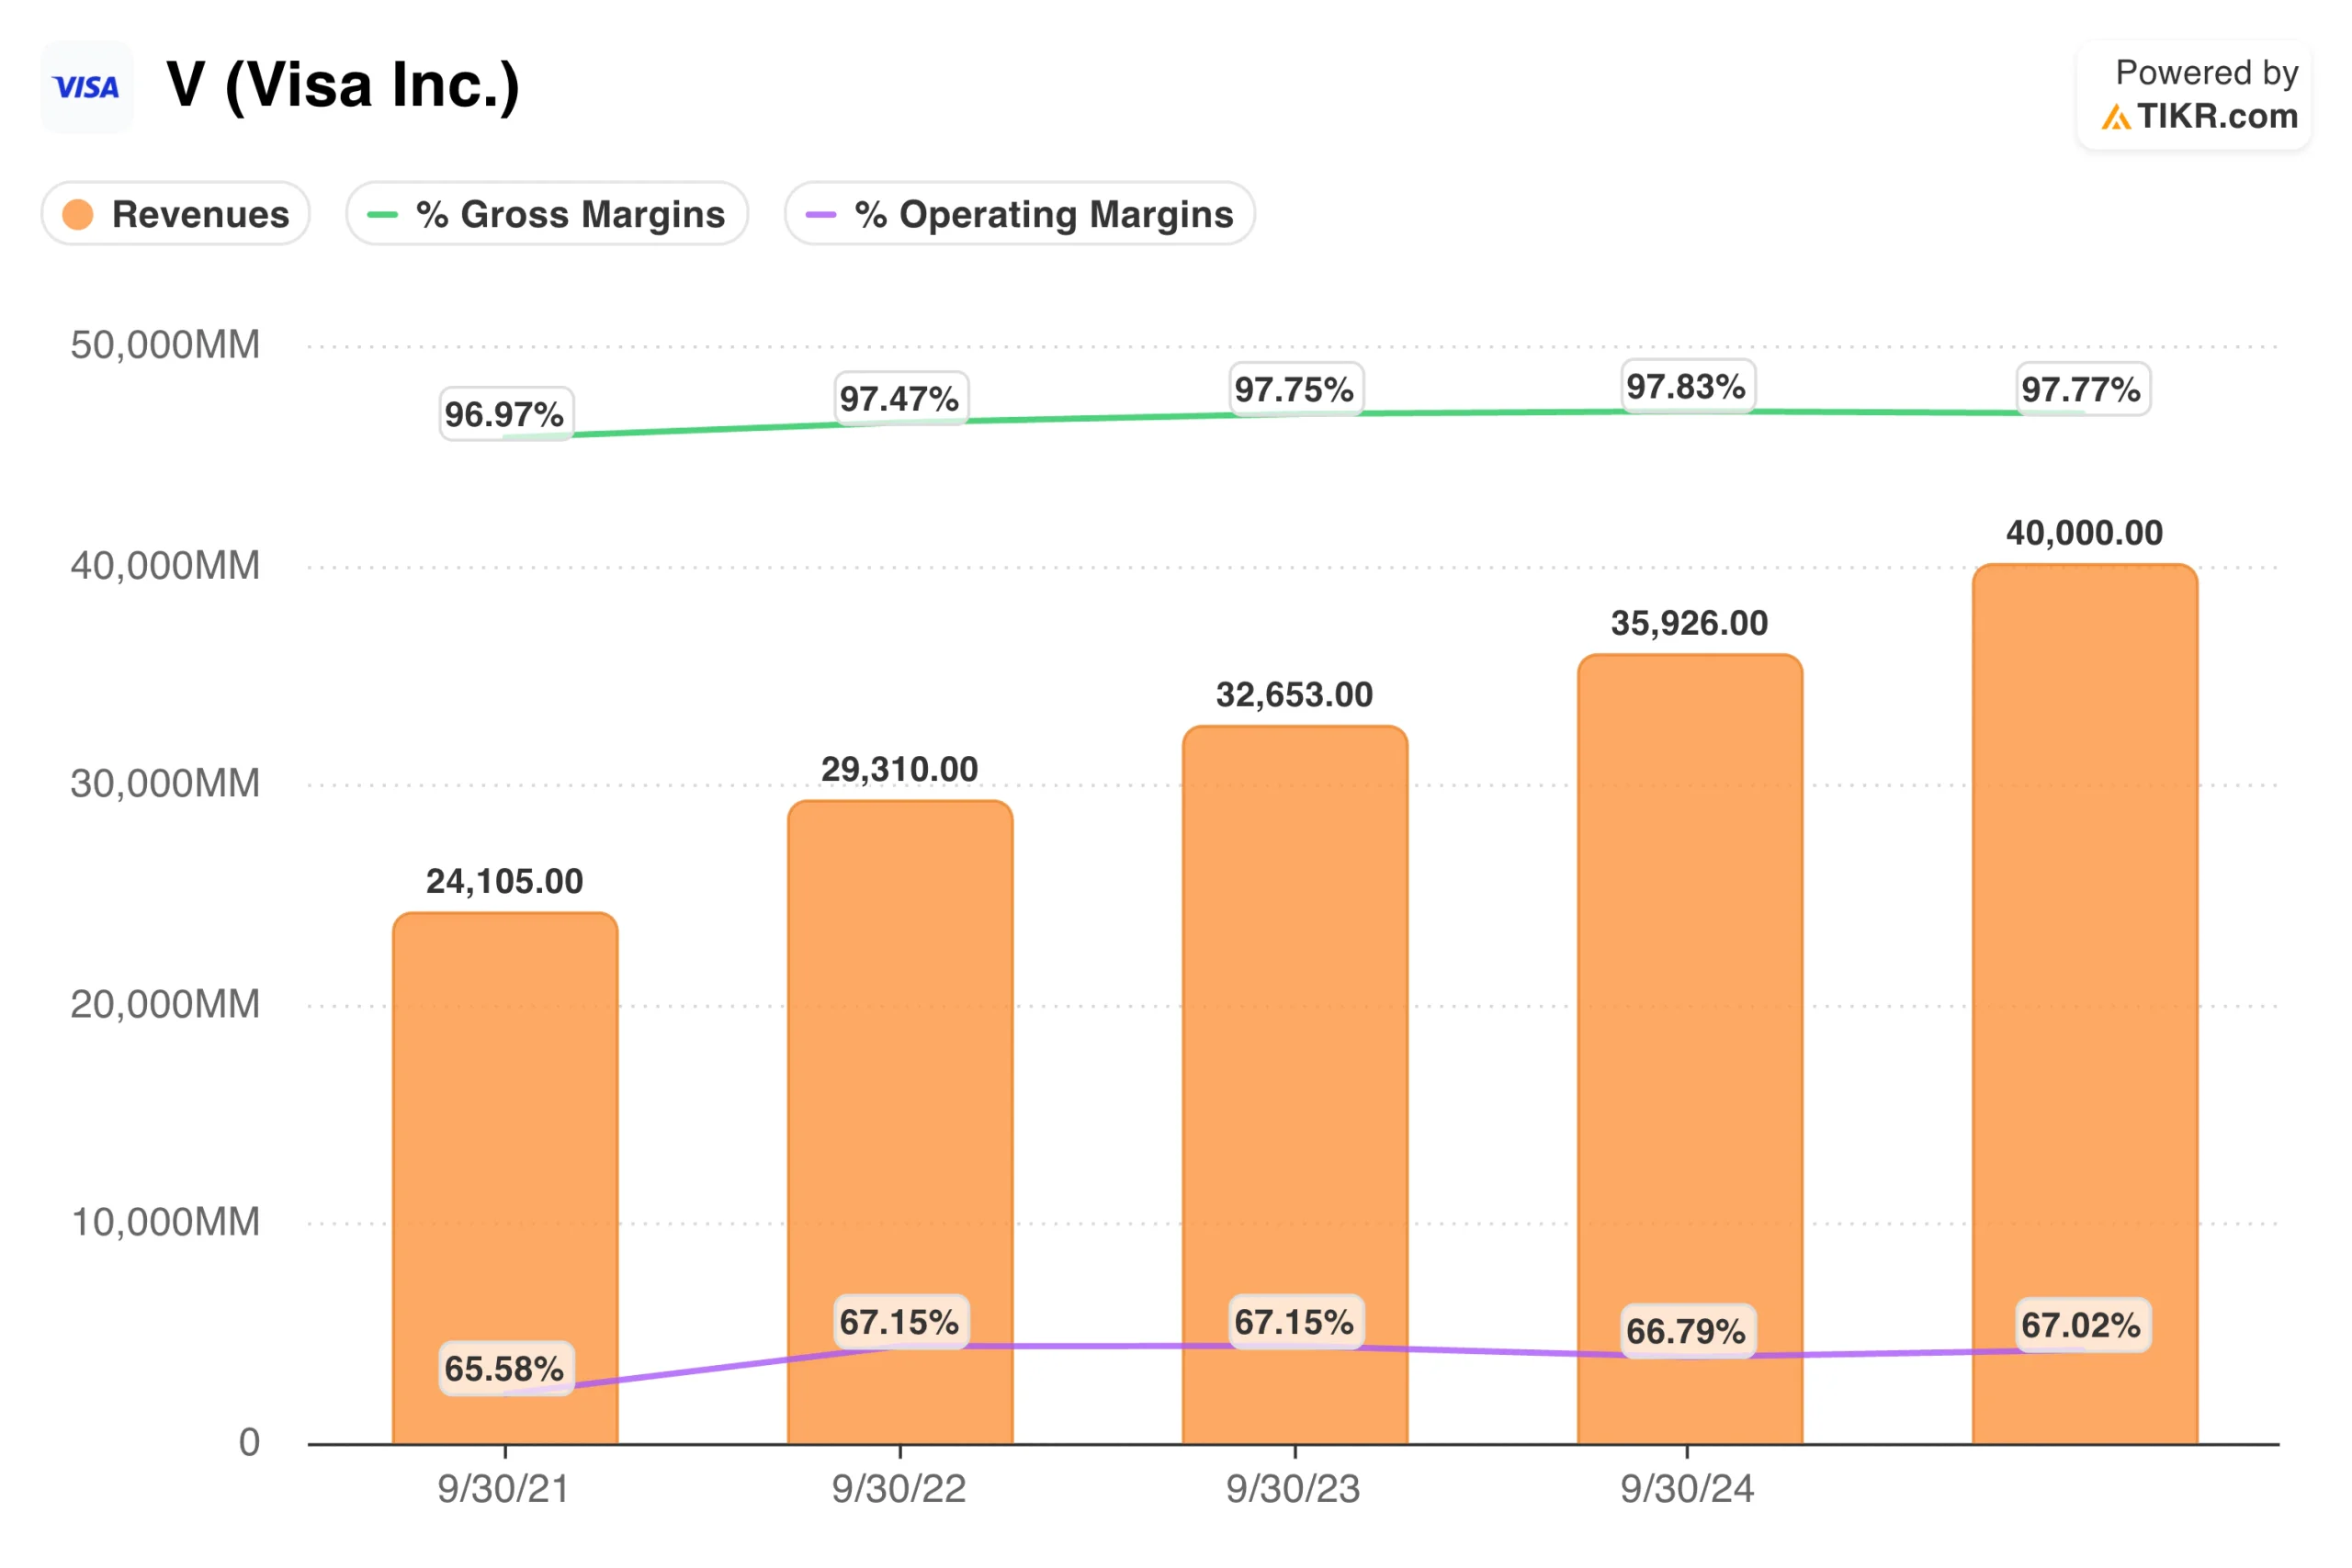
Pricing power is the most immediate signal of a strong competitive position. A company that can raise prices without losing significant volume is likely offering a product or service that customers find indispensable or difficult to replicate. This is a primary indicator of structural health in any industry.
You can identify this by analyzing gross and operating margins over a full market cycle. If a firm maintains premium margins while its peers fluctuate with commodity costs or competitive discounting, it likely possesses a durable structural advantage, such as a strong brand or proprietary technology. Margins are a key indicator of whether a company can protect its bottom line in difficult environments.
Simply having high margins for a single year is not enough, as temporary tailwinds can distort results. Look for stability over at least five to ten years to confirm that the advantage is rooted in the business model rather than a transient market environment. Truly sustainable margins suggest that the company’s competitive position is deep enough to resist cyclical erosion.
TIKR Tip: You can visualize up to 20 years of margin trends on TIKR, helping you distinguish between companies with enduring pricing power and those vulnerable to cyclical volatility.
Consistent Returns on Invested Capital
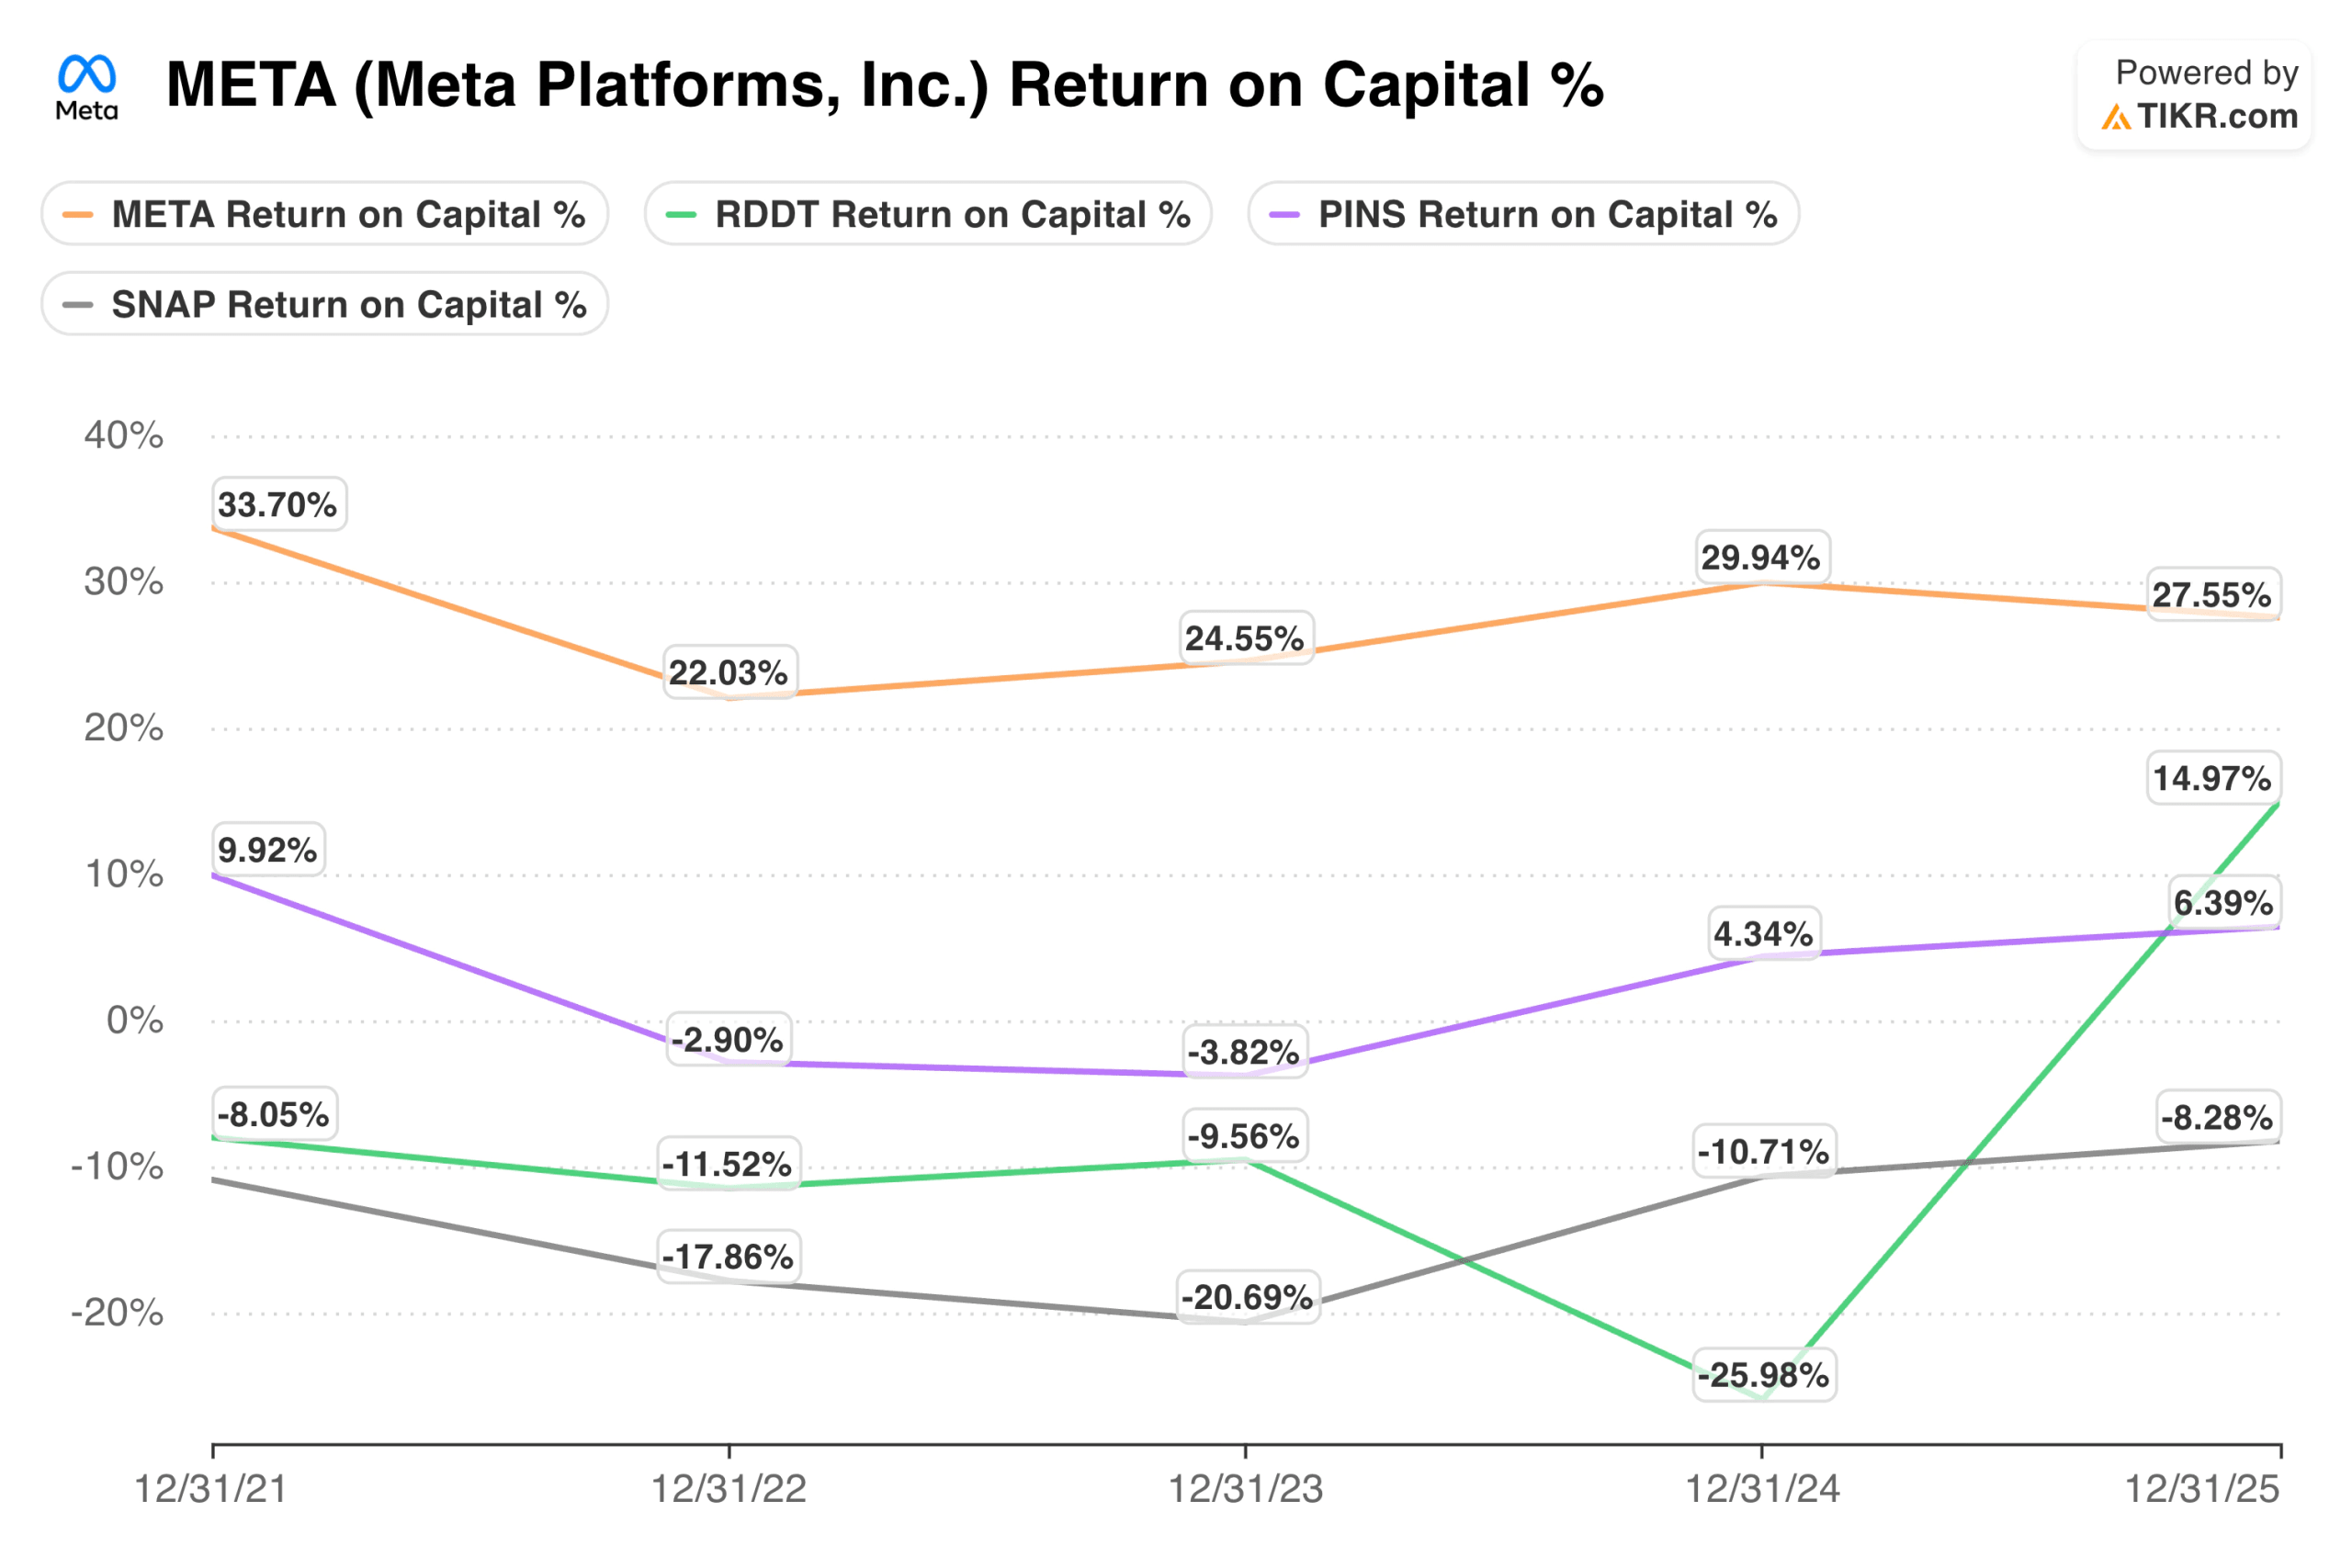
Return on Invested Capital, or ROIC, measures how effectively a company turns capital into profit. A company with a structural advantage will consistently generate an ROIC that significantly exceeds its cost of capital, which allows it to compound shareholder value over time.
When you observe a firm earning high returns year after year, it suggests that its underlying competitive position is strong enough to resist the degradation of profit margins. This efficiency allows the company to reinvest profits into further growth, creating a powerful compounding effect that weak competitors cannot match.
Conversely, low or volatile ROIC often indicates that a business is struggling to distinguish itself in a crowded or commoditized market. In such cases, the company may be forced to overspend on capital projects just to maintain its current market share rather than to drive value creation.
TIKR Tip: TIKR’s platform automates ROIC calculations for your entire watchlist, allowing you to instantly identify companies that are compounding value more efficiently than their peers.
Market Share Stability and Trends
Analyzing market share trends provides a clear window into how a company performs against its closest peers. A business that grows its market share is winning customers by offering a superior value proposition, whereas a shrinking share suggests that competitors are becoming more attractive.
Stability is often just as important as growth, particularly in mature industries. If a company can maintain its market share despite aggressive marketing or pricing moves by rivals, it demonstrates the strength of its existing customer relationships and overall competitive resilience.
Use comparative tools to stack a company’s revenue growth against its industry average. If the business is consistently expanding its footprint while others stagnate, it is likely that the company benefits from a scale advantage that keeps new entrants and existing competitors at bay. Watching how these trends shift is the best way to determine if a company is winning or losing the battle for dominance.

TIKR Tip: With TIKR, you can plot a company’s revenue growth alongside its primary competitors in a single view to track market share shifts over multiple economic cycles.
Structural Barriers and Switching Costs
A structural advantage often manifests as high switching costs, where the pain or expense of switching to a competitor is so significant that customers remain loyal even when prices rise. Software platforms, specialized infrastructure, and proprietary databases often create these deep traps that preserve market share.
Network effects provide another layer of defense, occurring when a product becomes more valuable as more people use it. Businesses benefiting from these effects often grow stronger as they scale, making it increasingly difficult for smaller players to challenge their position.
When evaluating these moats, look for evidence that the product is deeply embedded in customers’ workflows. This stickiness allows the company to weather economic downturns and emerge with its competitive position intact, ensuring the business remains the first choice for its customer base.
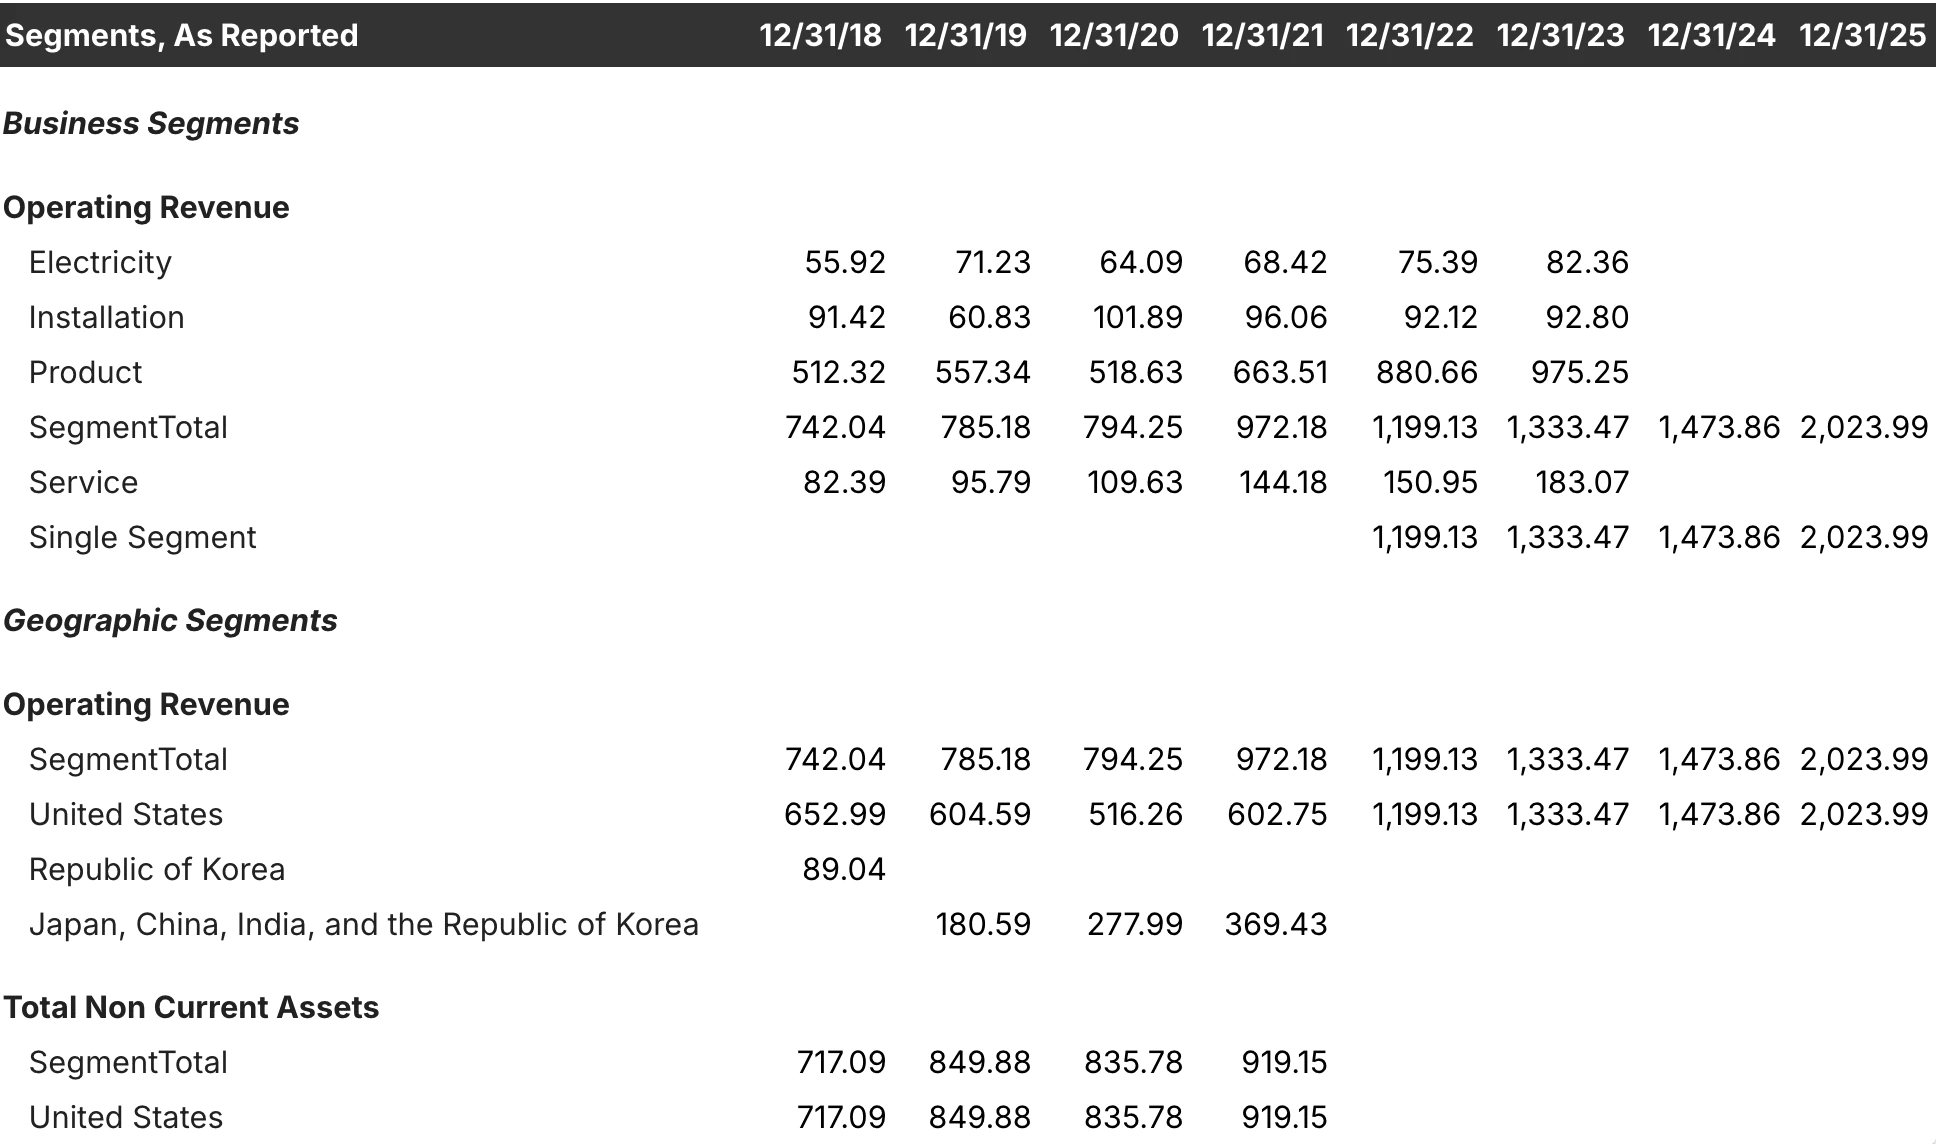
TIKR Tip: TIKR lets you analyze segment-level financial data, giving you the visibility to spot if high customer retention is driving superior margins and stable top-line growth.
Discover if your favorite stocks have high customer retention using TIKR (It’s free) >>>
Economies of Scale and Cost Leadership
A cost-based advantage occurs when a company produces goods or services at a lower cost than its competitors, allowing it to undercut rivals or achieve higher margins at the same price. This is driven by scale, where fixed costs are spread across massive volumes, creating a barrier that smaller entrants cannot match.
When a firm achieves true scale, it gains bargaining power over suppliers and optimizes distribution in ways impossible for smaller players. This advantage acts as a defensive shield; a new competitor would need to operate at a loss for years just to match the incumbent’s cost structure.
Look for evidence of this in the company’s operating margins relative to the industry. If the firm consistently reports lower-than-average operating expenses while maintaining output, it is likely benefiting from structural efficiencies. This cost leadership is durable because it is the cumulative result of years of operational discipline.
TIKR Tip: Use the “Detailed Financials” tab on TIKR to pull standardized income statements; this allows you to track operating expenses as a percentage of revenue over time to verify which companies are achieving true cost leadership.
Track the income statements of your favorite stocks on TIKR (It’s free) >>>
TIKR Takeaway
While market narratives can be misleading, TIKR Terminal provides the data required to prove that a competitive advantage exists. By using standardized financials to track margins, returns on invested capital, and market share over twenty years, you can see if a company is truly building a moat or simply benefiting from a temporary tailwind. Most investors guess at competitive advantage; TIKR allows you to verify it with facts.
Value Any Stock in Under 60 Seconds with TIKR
With TIKR’s new Valuation Model tool, you can estimate a stock’s potential share price in under a minute.
All it takes is three simple inputs:
- Revenue Growth
- Operating Margins
- Exit P/E Multiple
If you’re not sure what to enter, TIKR automatically fills in each input using analysts’ consensus estimates, giving you a quick, reliable starting point.
From there, TIKR calculates the potential share price and total returns under Bull, Base, and Bear scenarios so you can quickly see whether a stock looks undervalued or overvalued.
See a stock’s true value in under 60 seconds (Free with TIKR) >>>
Looking for New Opportunities?
- Discover which stocks billionaire investors are purchasing, so you can follow the smart money.
- Analyze stocks in as little as 5 minutes with TIKR’s all-in-one, easy-to-use platform.
- The more rocks you overturn… the more opportunities you’ll uncover. Search 100K+ global stocks, global top investor holdings, and more with TIKR.
Disclaimer:
Please note that the articles on TIKR are not intended to serve as investment or financial advice from TIKR or our content team, nor are they recommendations to buy or sell any stocks. We create our content based on TIKR Terminal’s investment data and analysts’ estimates. Our analysis might not include recent company news or important updates. TIKR has no position in any stocks mentioned. Thank you for reading, and happy investing!


