Valuing a stock has always been one of the most important parts of investing. It’s easy to know the price of a company, but it’s harder to know what a stock is truly worth.
Traditionally, investors spent hours building spreadsheets and tweaking assumptions to value stocks, only to end up with a valuation they were still unsure about.
TIKR’s Guided Valuation Model was built to change that. In under 30 seconds, you can estimate a company’s fair value range, expected return, and sensitivity to key assumptions.
Whether you are analyzing a fast-growing innovator like NVIDIA, a steady compounder like Apple, or a beaten-down turnaround opportunity, TIKR’s same valuation framework makes it easy to value any stock you’re interested in.
This helps to makes investing accessible for everyone, because you don’t need to use complicated spreadsheets or spend years getting a Finance degree.
Value Stocks in Under 30 Seconds with the Guided Valuation Model
TIKR’s Guided Valuation Model uses analysts’ average estimates for the next 2 years to estimate a stock’s fair value and expected returns.
These models tend to take about 15 seconds to build:

The model shows:
- Current vs. target price based on forward assumptions.
- Forecasted total and annualized returns (IRR) over a 1-2 year time horizon.
- Historical context, showing how growth, margins, and valuation multiple assumptions compare to a company’s past results.
Each input is dynamic, so you can change valuation assumptions and the model will recalculate expected returns instantly.
Value any stock in less than 30 seconds with TIKR’s Guided Valuation Model (It’s free) >>>
How This Model Calculates a Stock’s Fair Value
As noted above, the Guided Valuation Model focuses on these three drivers that determine how much a stock is really worth over time:
- Revenue Growth: How big the business will become.
- Profit Margins: How efficiently it converts sales into earnings.
- Valuation Multiple (P/E): How much investors are willing to pay for those earnings.
These three variables explain most of a company’s long-term stock performance. Over time, stock prices reflect the real growth and profitability of the businesses behind them.
As Ben Graham famously said, “In the short run, the market is a voting machine, but in the long run, it is a weighing machine.”
If the business grows and becomes more profitable, the stock price tends to rise as well. TIKR helps investors find stocks that are undervalued to their expected results going forward.
How to Build a Model (Under 30 Seconds)
Here’s how you can build a model to value Amazon stock in under 30 seconds:
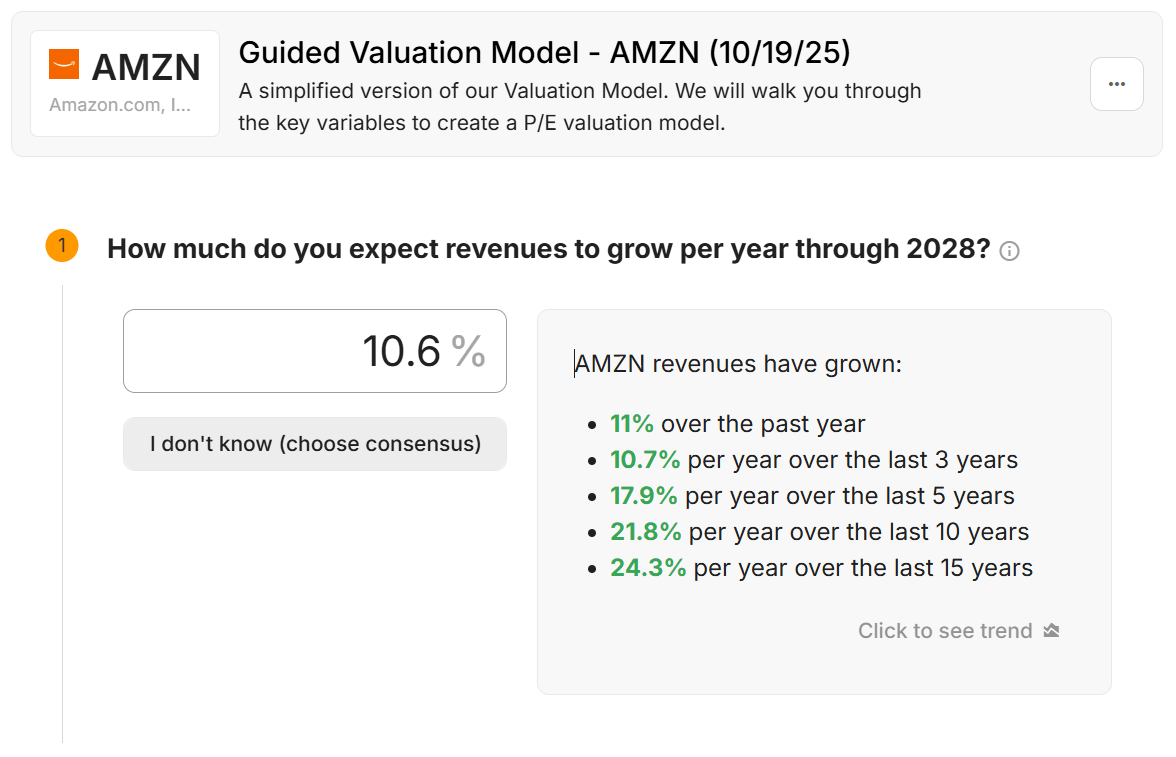
1) Revenue Growth

The first input we need to make in our model is revenue growth.
Revenue growth shows how fast a company’s sales expand over time. Consistent growth suggests rising demand and a stronger market position. It’s the first input investors enter because it determines how big the business can become in the future.
When you’re building a Guided Model, it’s typically best to just click, “I don’t know,” and the model will input analysts’ consensus estimates for you. This is the fastest way to build your valuation, and it tends to be quite accurate as well!
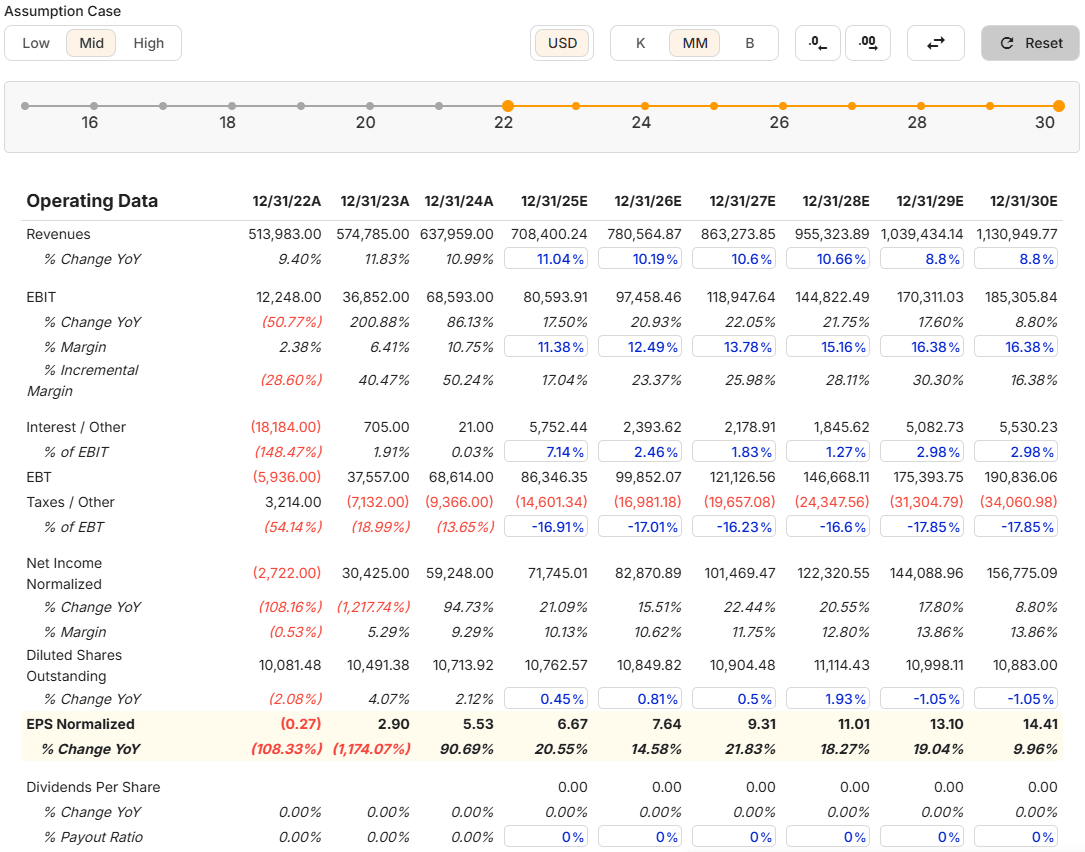
2) Profit Margins

Second, we need to input expected operating margins.
Margins reveal how much of each dollar in sales becomes profit. Expanding margins often signal cost control, pricing power, or product differentiation, all of which signal that the business is healthy. Declining margins can have the opposite effect and can compress returns even when revenue rises.
Again, we can click, “I don’t know,” as we’re building this Amazon Valuation Model, and the model will input analysts’ consensus estimates for Amazon’s expected operating margins through 2028.

Value any stock in less than 30 seconds with TIKR’s Guided Valuation Model (It’s free) >>>
3) Valuation Multiple (P/E Ratio)

Last, we need to enter an appropriate P/E ratio that we think the stock will trade at by the end of 2027.
The P/E ratio reflects market sentiment, how much investors are willing to pay for a company’s earnings. A stock trading at 30x earnings can fall even as profits grow if its multiple contracts to 20x. TIKR’s model helps you visualize this dynamic and understand how changes in valuation influence returns.
By combining these three levers, the model reveals how a business grows, how efficiently it runs, and how investors perceive that growth, all in one view.

See Amaon’s Fair Value and Expected Returns
Once we enter our 3 inputs, we’ll see our Guided Model:
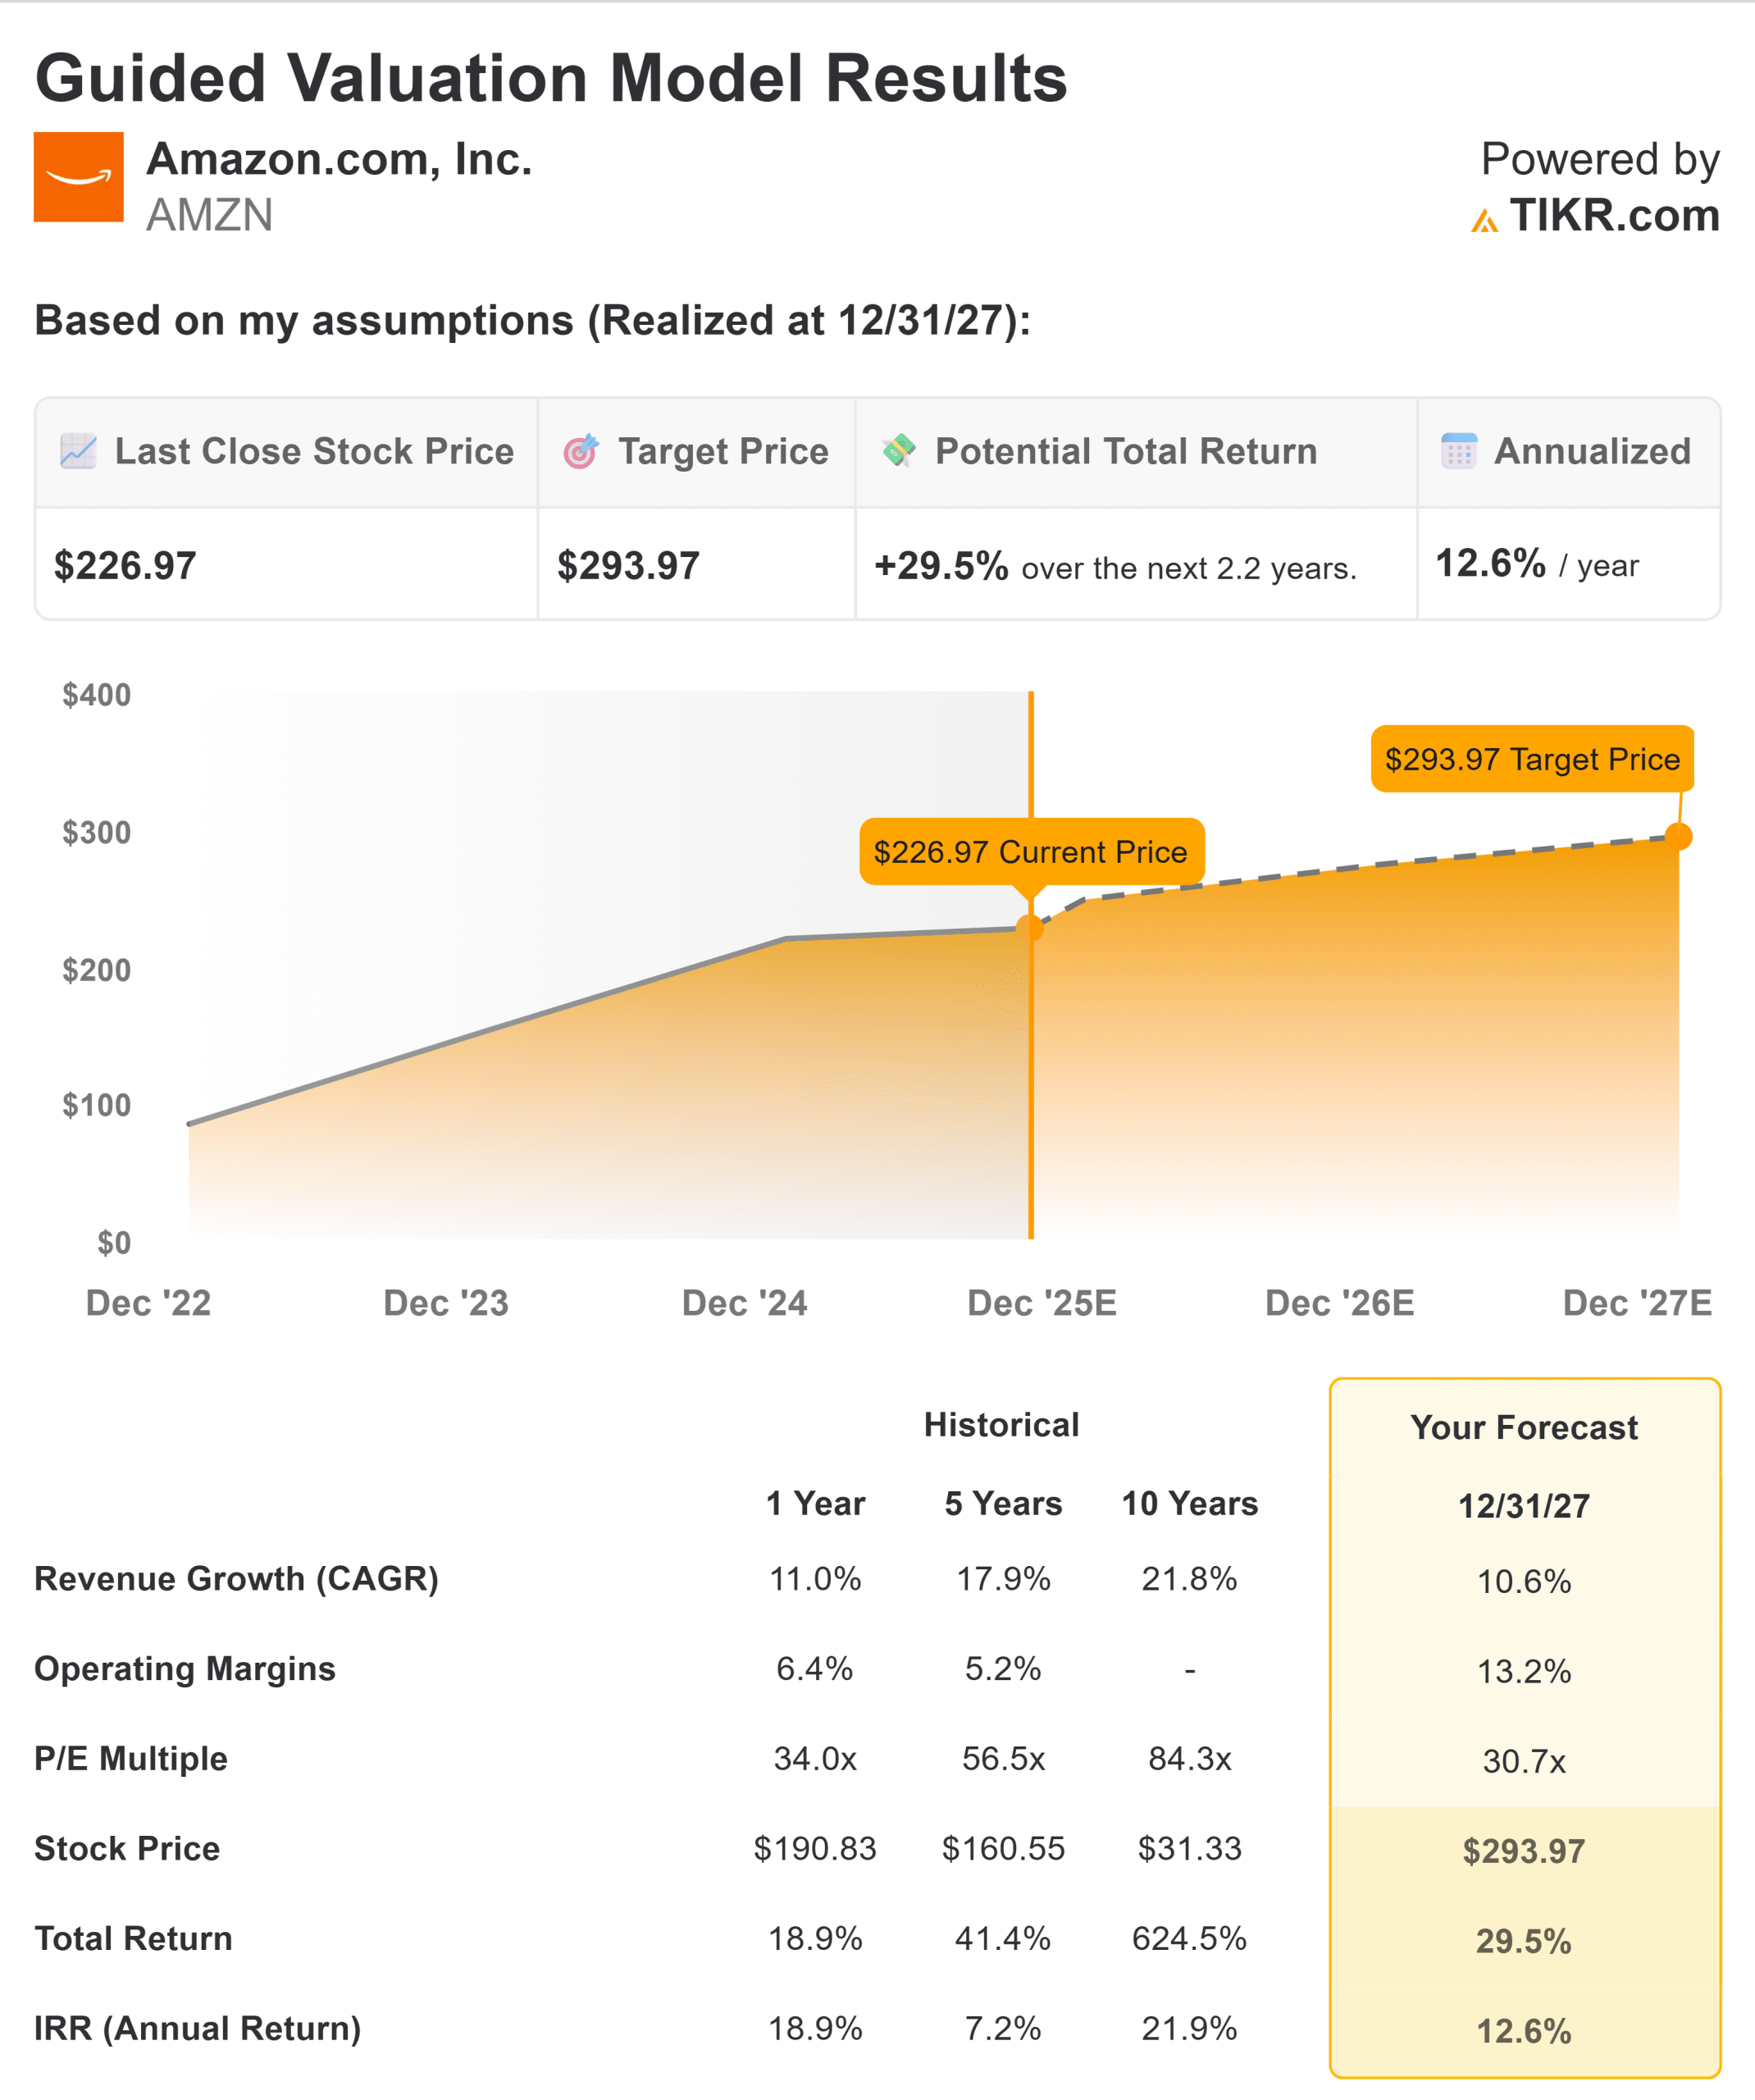
Based on our assumptions, the model estimates that Amazon stock could have 29.5% upside by the end of 2027 (2.2 years), which would be 12.6% annualized returns.
You can also see how expected returns stack up against the stock’s historical performance. This makes it easy to quantify whether return expectations seem realistic.
In this case, Amazon’s expected 12.6% returns seem reasonable because it’s based on 10.6% annual revenue growth, net margins expanding to 13.2%, and about a 31x P/E ratio. Those numbers don’t seem too crazy for a compounder like Amazon!
You can take your Valuation Models a step further with TIKR’s Advanced Valuation Models. These models are only available on paid TIKR plans, but these models unlock helpful insights like:
- Up to 5-year valuations (instead of just 2 years)
- Bull, base, and bear cases to test different potential outcomes for the stock
- Fully customizable model allowing you to change any line item of the model
This is an excellent tool for professional or serious investors. You’ll gain significant levels of confidence in the stock valuations you build, while simplifying your workflow and reducing the time you spend building each model.
Build a 5-Year Valuation Model (in Under a Minute)
Once you get comfortable with the Guided Valuation Model, you can upgrade your analysis with TIKR’s Advanced Valuation Models. These models show what a stock could return over the next 4-5 years instead of only 2 years. They also let you test different assumptions to see how much future performance matters.
You can build an Advanced Model from a Guided Model, by simply clicking, “See the underlying financial model used for this projection.” TIKR will automatically build a 5-year model with data imported based on analysts’ high, mid, and low forecasts. From there, the model calculates share price targets and total returns under all three scenarios.

For example, in this Advanced Model for Amazon, the mid case assumes Amazon could return about 95% by the end of 2029 (4.2 years), which works out to roughly 17% per year.
The stock currently trades around $227, and the model shows a 2029 price target of around $442.
The model assumes Amazon will see about 10% annual revenue growth, net income margins of 13%, and a gradually declining P/E multiple.

The model also shows a more cautious case with slower growth and lower market sentiment, along with a more optimistic valuation that shows what would happen if everything went right.
Customize Any Part of the Model & See Unique Insights
You can also customize every part of the Advanced Model to match your own view of the business.
You can adjust any line item, whether it’s revenue growth, margins, taxes, share count, or the valuation multiple, and see the impact instantly.
You can tweak any number used across the Mid case, as well as tweaking the assumptions used in the Low and High cases:
In the image below, you can see that the Forecasted Summary section at the bottom of the model shows the full range of expected returns and fair value for the stock.
Additionally, once you make changes and customize the model, you might be interested to know how the new assumptions within your new model compare to analysts’ average estimates.
The Delta to Street Estimates shows the difference between your estimates and Wall Street’s average estimates. This chart updates in real time, so you can easily see which parts of your estimates differ from Wall Street:

Analyze the Bull, Base, and Bear Cases
Valuation is never one number, it’s a range of outcomes.
TIKR’s Advanced Valuation Model makes that range visible by showing the bull, base, and bear cases in parallel.
- Bull Case (High): This scenario highlights the upside if business momentum accelerates. The company might exceed expectations through stronger revenue growth, rising profitability, or investors assigning a higher valuation multiple.
- Base Case (Mid): This scenario represents the most reasonable outcome based on known information. Assumptions match what analysts expect today. Typically, that means that growth remains steady, margins track current trends, and the company executes its existing plan.
- Bear Case (Low): This is when business performance falls short of expectations. This usually means that revenue softens, margins slip, or valuation multiples contract as investor sentiment weakens. This scenario shows what the downside could look like if challenges emerge.
Each scenario updates instantly as you adjust inputs. The model recalculates target price, total return, and IRR, letting you see how small shifts in fundamentals reshape a company’s potential.
In the bull case shown below, Amazon’s continued profitability improvements and stronger growth could push the expected return closer to 140% over the same period, translating to about 23% annual returns. That would mean a price target above $540 if execution and sentiment stay strong.
The bear case helps define downside risk. If revenue growth slows to around 9% annually and the market assigns a lower valuation multiple, Amazon might still produce a gain of about 55% over the next 4.2 years, or roughly 11% per year.
Even in that more cautious scenario, the stock still offers positive returns supported by steady business expansion.

This side-by-side framework clearly quantifies risk and reward. Instead of guessing how sentiment might move, you can measure it, helping you build conviction grounded in data.
Stay Organized With the Valuation Hub
Once you start building valuation models, you’ll want an easy way to keep track of them and see which stocks could be the best investments today.
TIKR’s Valuation Hub brings all of your models together in one clean dashboard so you can stay organized and instantly revisit the stocks you’ve analyzed.
Every model you build appears in this Hub automatically. You can sort the list by potential upside, annualized returns, or key fundamentals like revenue and EPS growth.
With a single click, your highest-conviction opportunities rise to the top, helping you focus your research where the upside looks strongest.
The Hub updates in real time as new earnings come in and analysts revise their forecasts. That means the models stay fresh without you having to rebuild spreadsheets or re-enter data. You always know which stocks look undervalued today, not six months ago.

It is a simple way to keep your best ideas close and continuously improve your process as markets change.
Keep all your best ideas in one place with TIKR’s Valuation Model Hub (It’s free) >>>
Share Your Analysis with the World
Excellent analysis is meant to be shared. Once your model is ready, TIKR lets you export, collaborate, and share your models with ease.
You can:
- Export as a PNG or JPG to post online.
- Share on social media for real-time collaboration.
- Post a visual showing forecasted outcomes.

Each summary includes the company’s target prices, expected returns, and key assumptions, which are perfect for posting on social media, sending as client updates, sharing with friends, or for your personal records.
Where to Look to Find Undervalued Stocks
Even the best valuation skills only pay off if you can find undervalued stocks that can rise over time.
TIKR makes it easier to find these hidden ideas with data on over 100,000 global companies.
Here are some smart places to find undervalued stock ideas inside of TIKR:
- Stocks near 52-week lows. Short pullbacks can create mispricing before fundamentals change. Use TIKR’s Global Screener and filter for stocks that are down 20% or more Year-to-Date, then layer quality filters like ROIC, FCF margin, and revenue growth.
- Out-of-favor sectors. Industries like energy, consumer cyclicals, or small caps often rotate between being out of favor to in the spotlight, so you can look for sectors that are out of favor in the moment.
- Insider and institutional buying. Ownership that is rising can confirm a gap between price and value. You can use TIKR’s Ownership tab to find stocks where both company insiders and top hedge funds are buying.
- Regional or currency-driven discounts. Strong companies in Europe or Japan, for instance, sometimes trade at lower multiples than comparable U.S. peers due to macro sentiment rather than fundamentals.
- Corporate actions and spin-offs. Restructurings and other special events can unlock value the market hasn’t priced in. You can use TIKR’s Events Calendar to find companies that are seeing spin-offs, tender offers, special dividends, buybacks, and M&A activity. Then, you can take a look at recent Public Filings and Earnings Transcripts right within TIKR to get up-to-speed on the company’s recent story.
You can use TIKR’s Global Screener, Ownership tab, and Events Calendar to surface companies that might be temporarily overlooked but are still fundamentally sound.
This is often the sweet spot for long-term investors to find excellent stock ideas.
Search over 50K stocks with TIKR’s Global Screener (It’s free) >>>
Mistakes to Avoid When Valuing Stocks
A stock valuation is only as reliable as the numbers behind it. There’s a reason investors say, “garbage in, garbage out,” when talking about how important it is to have reasonable assumptions used in a valuation model.
Here are some mistakes to watch for when valuing stocks:
- Overestimating growth potential. It’s tempting to assume yesterday’s growth continues indefinitely, but a company’s growth rates tend to fall over time. It’s best to make sure the auto-filled average analyst estimates feel reasonable in your valuation model.
- Ignoring margin trends. Expanding or contracting margins often tell the real story about the strength of a company’s business model. If margins are flattening or falling, it’s probably best to avoid assuming multiple expansion.
- Assuming today’s multiple will never change. A great company bought at too high of a valuation can still underperform if sentiment cools and the P/E ratio contracts. TIKR’s Valuation Model makes it easy to see whether today’s P/E ratio sits above long-term norms. You can also test lower exit multiples to see how sensitive returns are to market expectations.
- Skipping scenario analysis. Always test bull, base, and bear outcomes to understand how sensitive your valuation is to changes in growth or profitability. The Advanced Model makes this easy, but you can still do this on the Guided Model as well by simply changing the inputs.
- Failing to revisit assumptions. TIKR makes it easy to update assumptions. It’s a best practice to update your model for your top holdings after each earnings report or guidance change so that you know your model is always accurate.
TIKR’s Valuation Models were designed to reduce these risks when valuing stocks, but investors should still be cognizant of these items.
The TIKR Takeaway
With TIKR’s new Valuation Model tool, you can estimate a stock’s potential share price in under a minute.
All it takes is three simple inputs:
- Revenue Growth
- Operating Margins
- Exit P/E Multiple
If you’re not sure what to enter, TIKR automatically fills in each input using analysts’ consensus estimates, giving you a quick, reliable starting point.
From there, TIKR calculates the potential share price and total returns under Bull, Base, and Bear scenarios so you can quickly see whether a stock looks undervalued or overvalued.
Looking for New Opportunities?
- Discover which stocks billionaire investors are purchasing, so you can follow the smart money.
- Analyze stocks in as little as 5 minutes with TIKR’s all-in-one, easy-to-use platform.
- The more rocks you overturn… the more opportunities you’ll uncover. Search 100K+ global stocks, global top investor holdings, and more with TIKR.
Disclaimer:
Please note that the articles on TIKR are not intended to serve as investment or financial advice from TIKR or our content team, nor are they recommendations to buy or sell any stocks. We create our content based on TIKR Terminal’s investment data and analysts’ estimates. Our analysis might not include recent company news or important updates. TIKR has no position in any stocks mentioned. Thank you for reading, and happy investing!