

Key Stats: Home Depot (HD) Q1 2026
- Current price: ~$302 (May 19, 2026)
- Q1 revenue: $41.8B, up 4.8% YoY
- Q1 adjusted EPS: $3.43, down ~4% YoY
- Q1 comp sales: +0.6%
- FY2026 total sales growth guidance: 2.5% to 4.5%
- FY2026 comp sales guidance: flat to +2%
- FY2026 adjusted operating margin guidance: 12.8% to 13%
- FY2026 adjusted EPS guidance: flat to +4% vs. FY2025
- TIKR model price target: $477 (mid case)
- Implied upside: ~58%
Home Depot Q1 2026: Growth by Acquisition, Not by Demand
Home Depot stock (HD) opened Q1 2026 with $41.8B in total sales, up 4.8% from $39.9B in Q1 2025, driven by the SRS and GMS acquisitions rather than organic comp acceleration.
Adjusted diluted EPS came in at $3.43, a decline of roughly 4% from $3.56 in Q1 2025, as acquisition-related costs and a heavier distribution mix weighed on the bottom line.
Comp sales grew 0.6%, with U.S. comps up 0.4%, a modest improvement from the flat-to-slightly-negative trajectory that characterized much of fiscal 2025.
SRS delivered $4.0B in sales for the quarter, with positive total sales growth and positive organic sales growth, according to Richard McPhail, Executive Vice President and Chief Financial Officer, on the Q1 earnings call.
Roofing was the weak link inside SRS, with low single-digit negative comps driven by an industry-wide collapse in hail and hurricane storm activity that began in the back half of 2025.
Pro outperformed DIY again this quarter, with the strongest growth coming from what management calls the complex purchase occasion, including power, pipe and fittings, water heaters, fasteners, and paint categories.
Online sales grew more than 10% YoY for the fourth consecutive quarter, consistent with the company’s broader push to remove friction from the interconnected customer experience.
Last week, Home Depot completed the acquisition of Mingledorff’s, a leading HVAC wholesale distributor operating 42 locations across five Southeastern states, expanding the total addressable market to $1.2 trillion according to Ted Decker, Chair, President, and CEO, on the Q1 earnings call.
Management reaffirmed full-year guidance in its entirety, including comp sales growth of flat to 2%, total sales growth of 2.5% to 4.5%, and adjusted operating margin of 12.8% to 13%.
The company paid approximately $2.3B in dividends during the quarter and invested approximately $845M in capital expenditures.
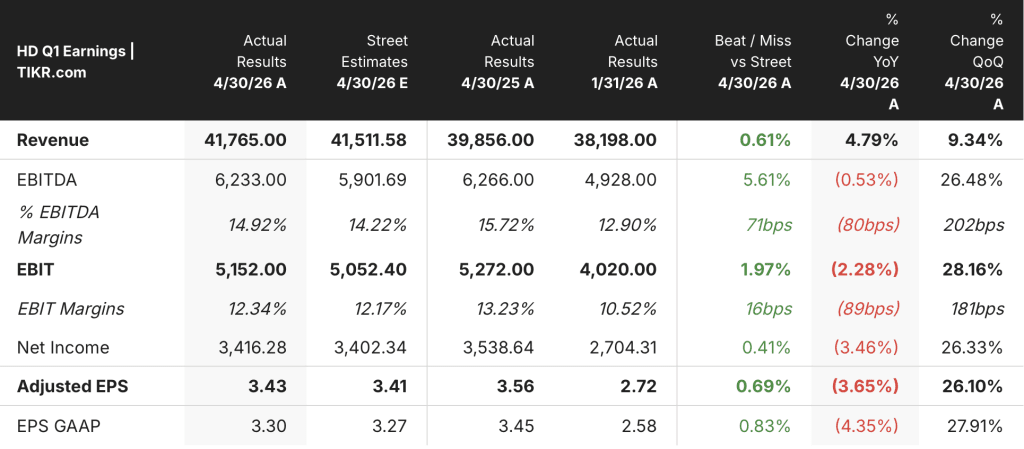
HD Stock Beats Estimates While Compressing on Every Margin That Matters
Home Depot stock delivered a clean beat at the revenue line, with actual Q1 revenue of $41.8B against a Street estimate of $41.5B, a 0.61% outperformance that reflects the broad contribution of the SRS and GMS platforms.
The beat held at the EBITDA level, where actual EBITDA of $6.2B exceeded the $5.9B estimate by 5.61%, the strongest percentage beat of the past five quarters.
EBIT at $5.2B also cleared estimates, coming in 1.97% above the $5.1B consensus, and EBIT margin of 12.3% was 16 basis points ahead of the 12.2% Street estimate.
Adjusted EPS of $3.43 beat the $3.41 consensus by a narrow $0.02, continuing the pattern of thin-margin beats that has defined Home Depot stock’s quarterly cadence over the past year.
What the beats mask is the YoY compression story.
Adjusted EPS fell 3.65% from Q1 2025’s $3.56, and net income declined 3.46% from $3.5B to $3.4B, as gross margin fell roughly 75 basis points to 33% because of the GMS acquisition mix shift, according to Richard McPhail on the Q1 earnings call.
The one clean miss this quarter was operating margin, where the GAAP figure came in at 11.9%, down 100 basis points from 12.9% in Q1 2025, and adjusted operating margin of 12.3% similarly trailed the prior-year 13.2%.
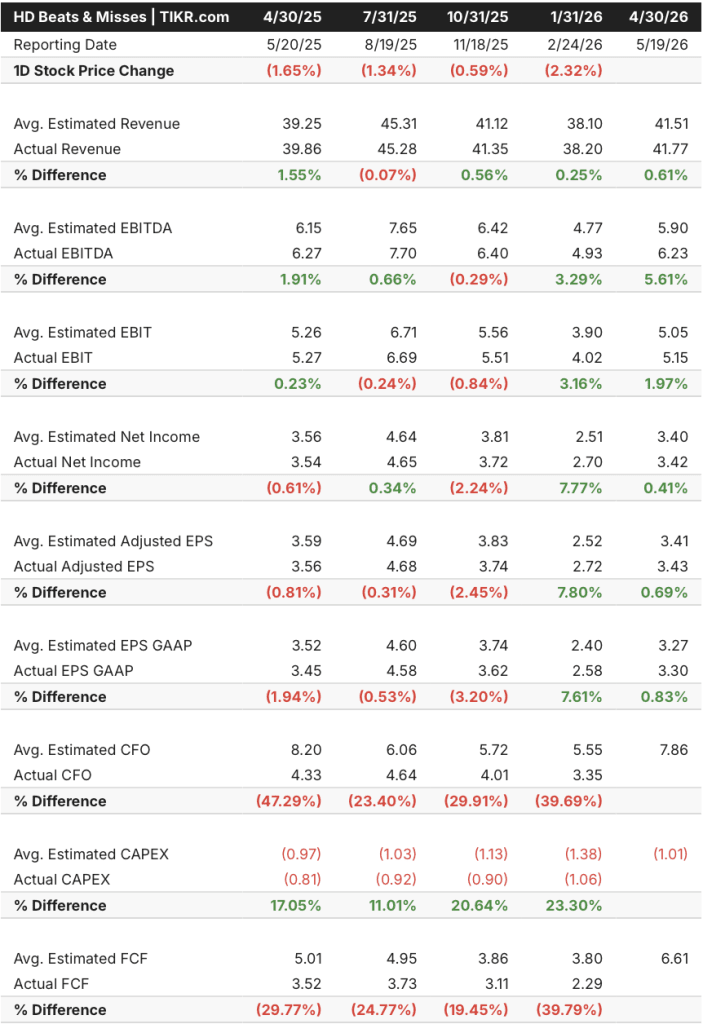
The pattern across the last five quarters tells the fuller story: Home Depot stock has consistently cleared Street estimates on revenue and EBITDA while absorbing persistent YoY EPS and margin compression, a trade-off the market has largely priced in but one that needs resolution for the re-rating to begin.
TIKR’s Model Gives HD Stock 58% Upside, With Multiple Compression Already Baked In
TIKR’s model prices Home Depot stock at $477 in the mid case, implying roughly 58% total upside from the current price of $302, with an annualized return of 10.2% over approximately 4.7 years.
The mid case assumes a 3.8% revenue CAGR and a 9.5% net income margin, both modest by historical standards, with TIKR embedding a 2.5% annual P/E compression rate into the forecast, meaning multiple contraction is already the assumed drag on HD stock’s path to $477.
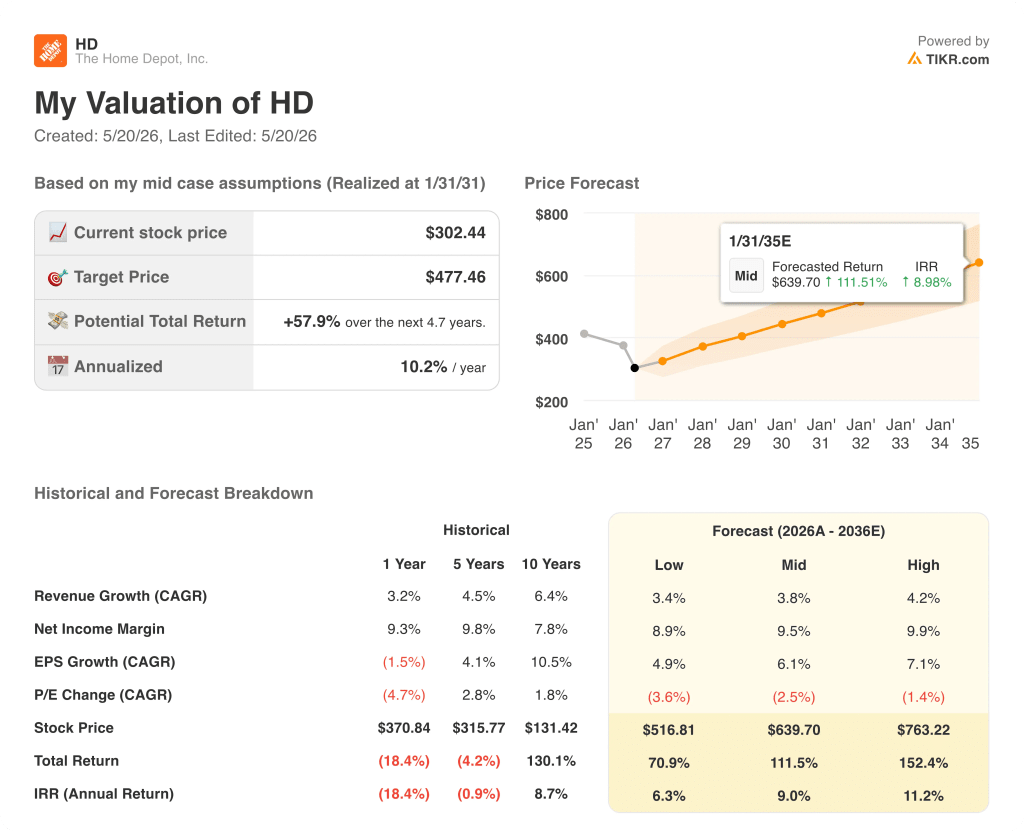
The Q1 print does not materially alter the risk/reward picture for HD stock: results were in line with expectations, guidance was reaffirmed in full, and the SRS integration is tracking to plan.
What TIKR’s model is essentially pricing in is that Home Depot stock does not need a multiple expansion to deliver double-digit annualized returns; it needs execution on a mid-single-digit organic growth path while the GMS gross margin drag fades through the back half of fiscal 2026.
Should You Invest in The Home Depot, Inc.?
The only way to really know is to look at the numbers yourself. TIKR gives you free access to the same institutional-quality financial data that professional analysts use to answer exactly that question.
Pull up The Home Depot, Inc. stock and you’ll see years of historical financials, what Wall Street analysts expect for revenue and earnings in the quarters ahead, how valuation multiples have moved over time, and whether price targets are trending up or down.
You can build a free watchlist to track The Home Depot, Inc. alongside every other stock on your radar. No credit card required. Just the data you need to decide for yourself.
Access Professional Tools to Analyze HD stock on TIKR for Free →


