
Key Stats for DD Stock
- Past-6-Month Performance: 60%
- 52-Week Range: $33 to $83
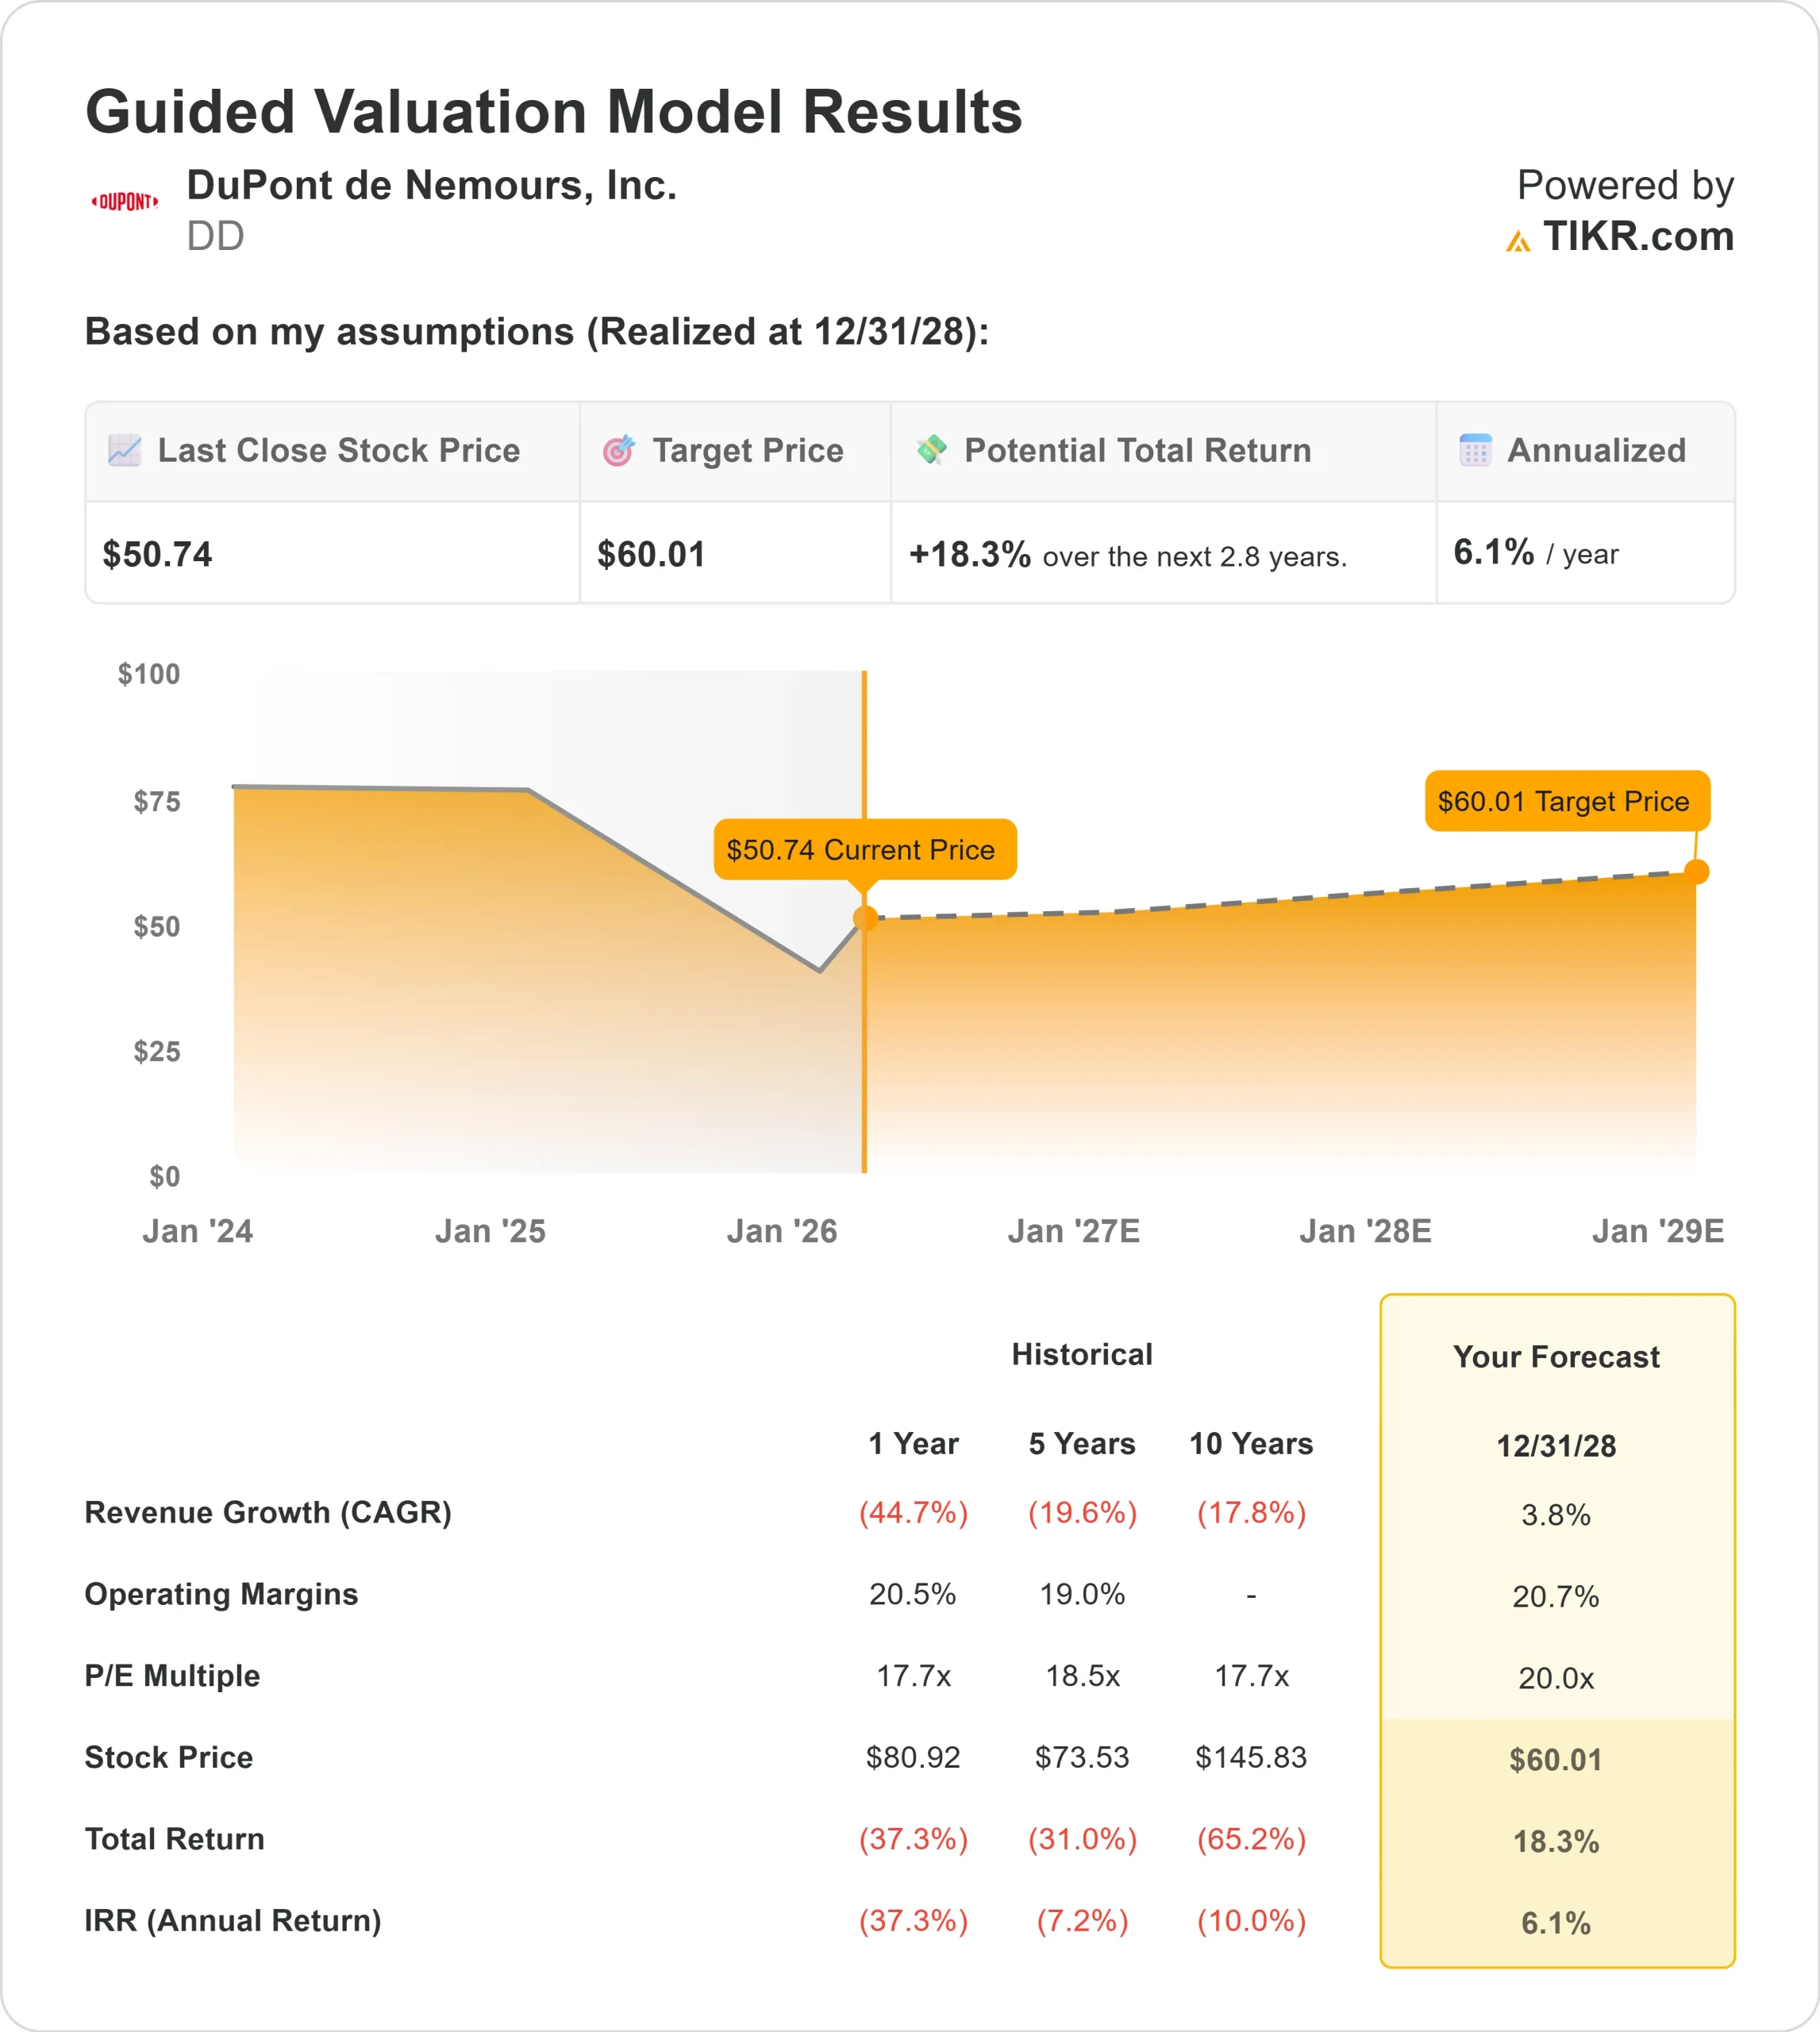
- Valuation Model Target Price: $60
- Implied Upside: 18.3%
Value your favorite stocks like DuPont de Nemours with 5 years of analysts’ forecasts using TIKR’s new Valuation Model (It’s free) >>>
What Happened?
DuPont de Nemours stock is up about 60% over the past six months, recently trading near $51 per share, as investors re-rated the business following margin expansion, portfolio simplification, and clearer 2026 earnings visibility.
Shares closed at $50.74, reflecting sustained buying interest after a sharp recovery from last year’s lows.
The rally has been driven primarily by stronger earnings execution and improved forward guidance. This week, DuPont reported fourth quarter results ahead of guidance, with net sales of $1.7 billion, operating EBITDA of $409 million up 4%, margin expanding 80 basis points to 24.2%, and adjusted EPS rising 18% to $0.46.
For the full year, organic sales grew 2%, operating EBITDA increased 6%, and adjusted EPS climbed 16% to $1.68, while CEO Lori Koch said, “We finished the year strong,” as the company guided 2026 adjusted EPS to $2.25 to $2.30 with about 3% expected organic growth and 60 to 80 basis points of further margin expansion.
Analyst updates reinforced the move. Wells Fargo raised its price target to $55 from $50 and maintained an Overweight rating, while Jefferies lifted its target to $59 from $51 and kept a Buy rating, implying roughly 8% to 16% upside from current levels.
Institutional positioning also strengthened, with Vanguard increasing its stake 6.7% to 50,867,267 shares, Mondrian Investment Partners initiating a new 1,777,954 share position worth about $138.5 million, Skandinaviska Enskilda Banken boosting its holdings by 1,135.4% to 1,159,785 shares, and PNC Financial Services Group raising its position 20.6% to 919,063 shares, as overall institutional ownership stands at 73.96%.
With 2026 guidance calling for net sales of about $7.1 billion, operating EBITDA of about $1.74 billion, adjusted EPS of $2.25 to $2.30, and free cash flow conversion above 90%, the stock’s surge reflects improving margin durability and disciplined capital allocation rather than a sudden spike in top line growth.
Expectations this year center on steady organic expansion, productivity gains, and continued strength in Healthcare & Water Technologies.
See analysts’ growth forecasts and price targets for DuPont de Nemours (It’s free) >>>
Is DD Undervalued?
Under valuation assumptions, the stock is modeled using:
- Revenue Growth (CAGR): 3.8%
- Operating Margins: 20.7%
- Exit P/E Multiple: 20x
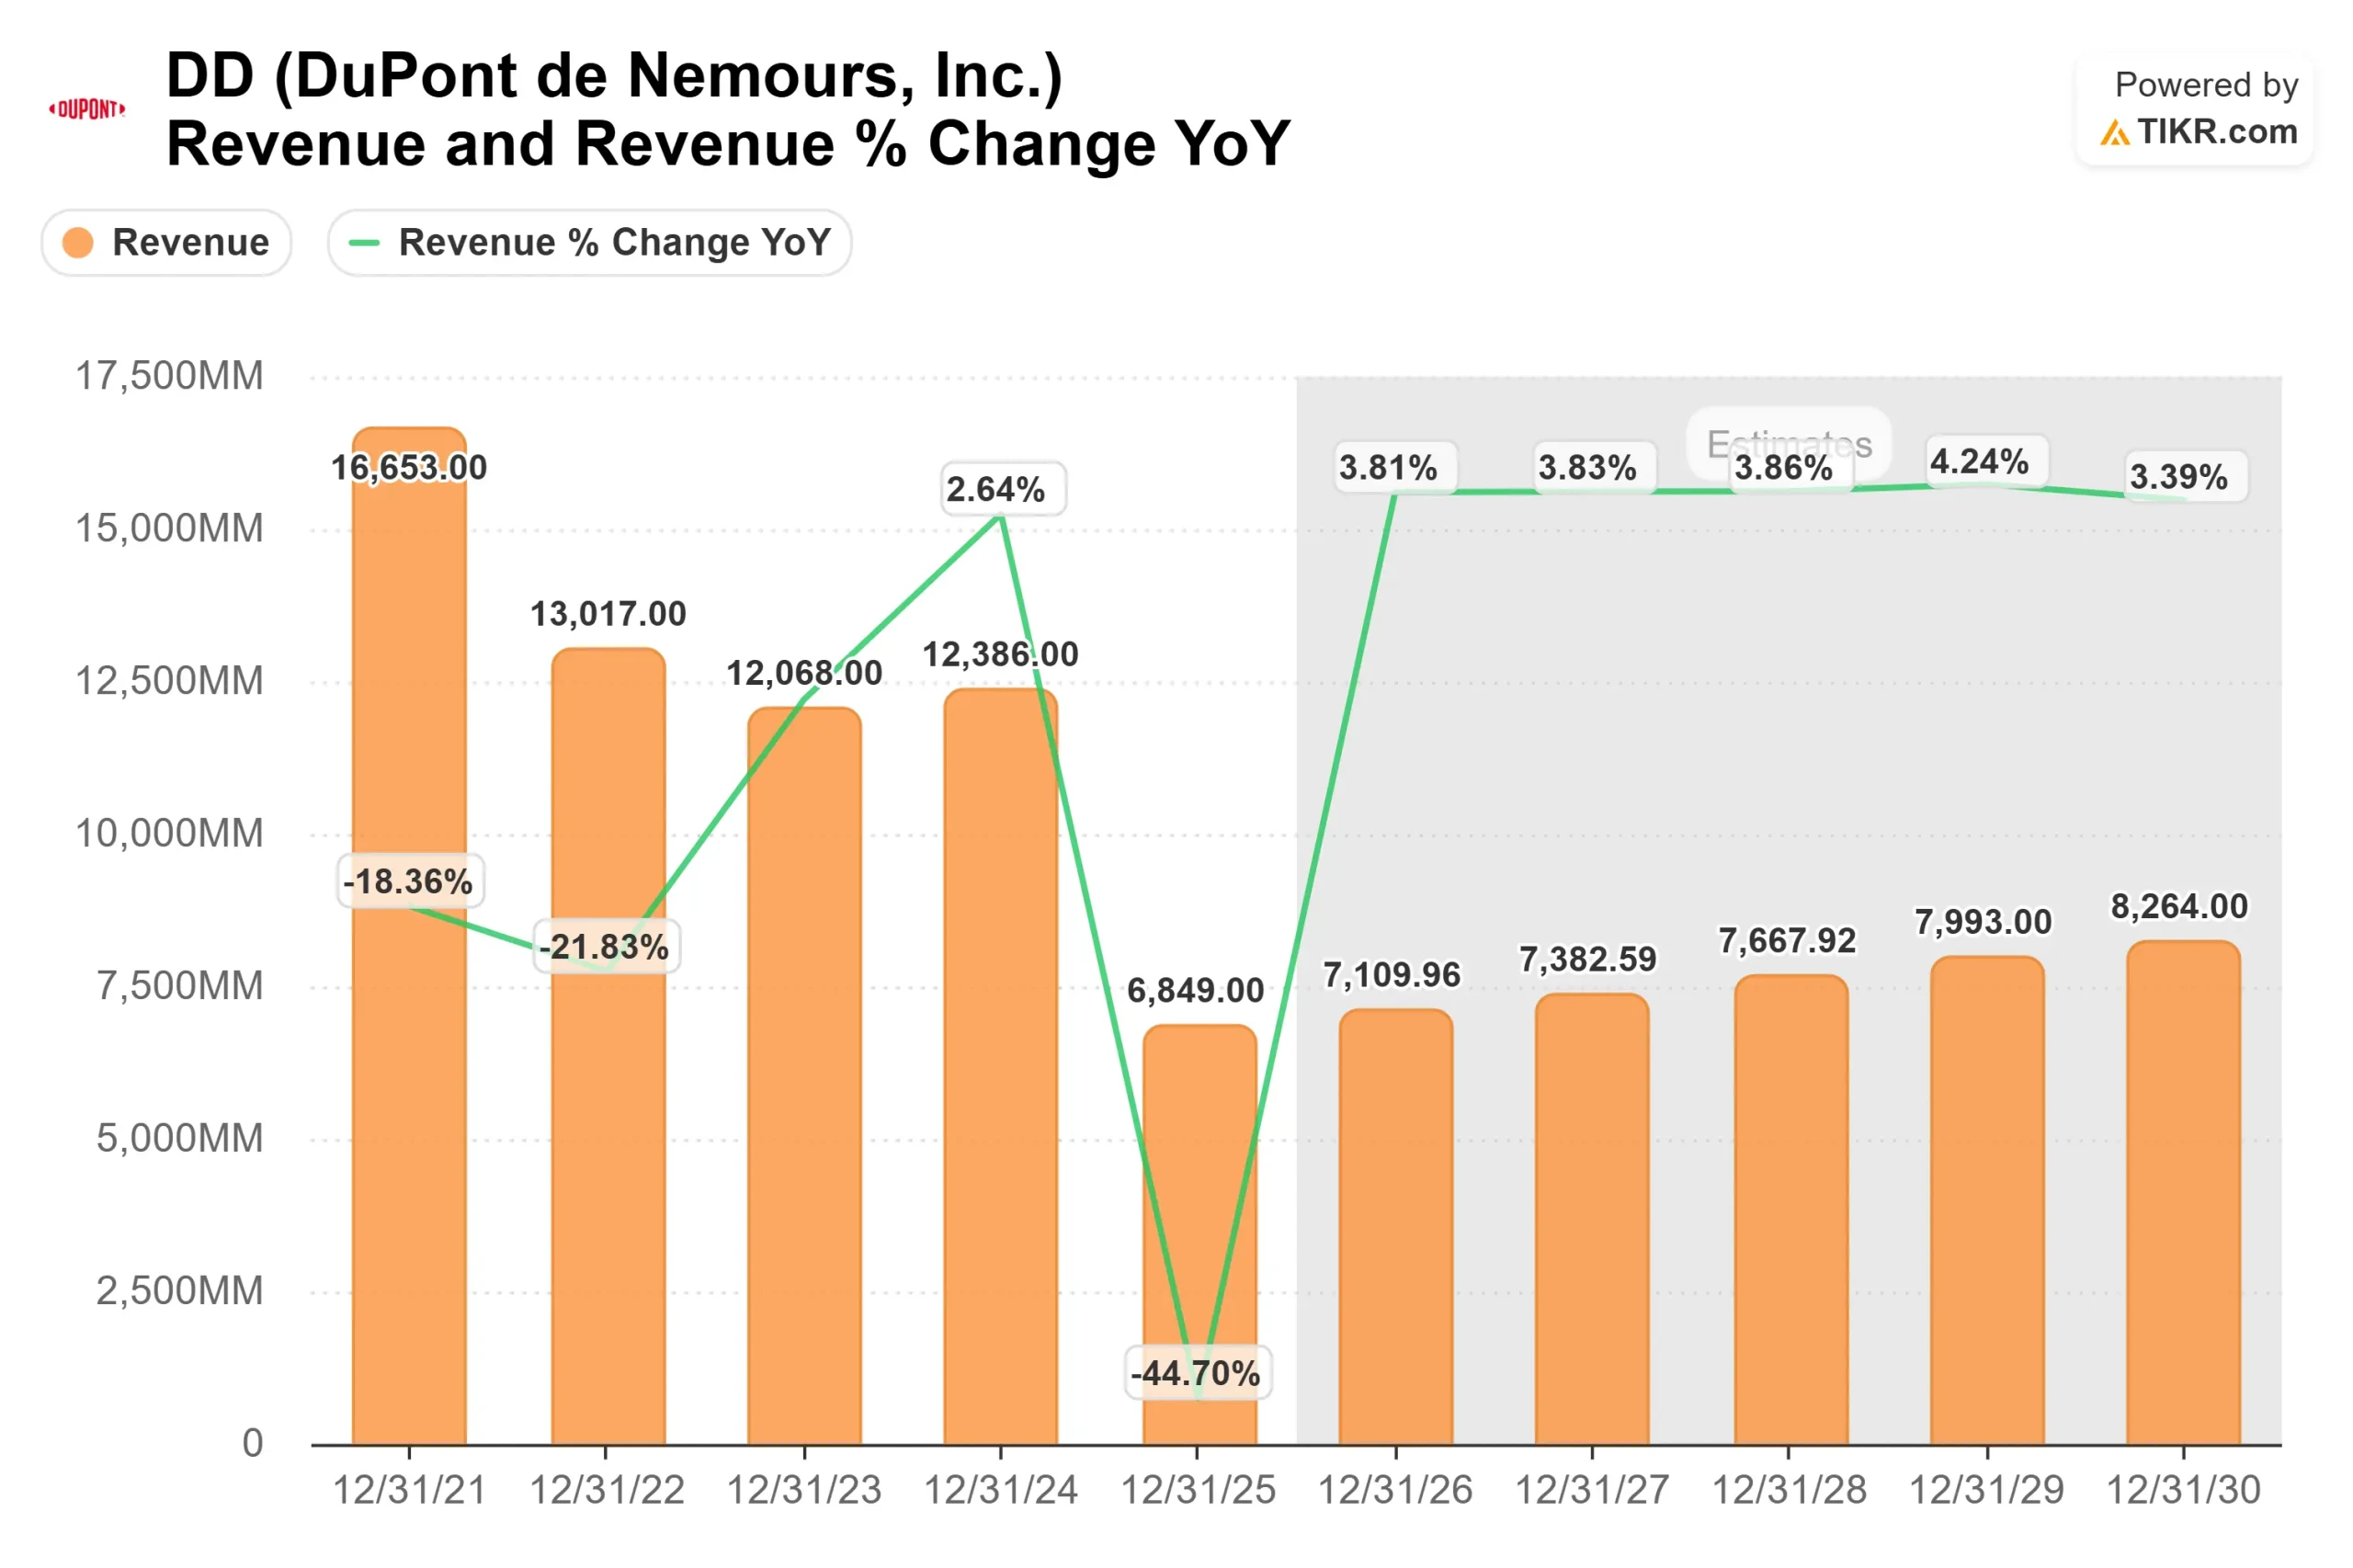
Revenue is projected to increase from about $6.8 billion in 2025 toward $8.3 billion by 2030, reflecting stabilization after divestitures and renewed growth in electronics materials, water filtration, and medical packaging rather than broad cyclical expansion.
Margin expansion toward 20.7% depends on higher semiconductor materials demand, continued productivity initiatives, and mix improvement within Healthcare & Water Technologies where operating margins already exceed 30%.
The most important driver over the next 12 months is execution in Healthcare & Water, where mid single digit organic growth is expected in 2026, supported by medical device demand, reverse osmosis adoption, and industrial water projects.
Productivity initiatives are expected to contribute at least 20 basis points of margin expansion this year, reinforcing operating leverage even in a mixed macro environment.
Based on these inputs, the valuation model estimates a target price of $60, implying about 18.3% total upside from the current price near $51 over the next several years.
That suggests DuPont appears modestly undervalued if management delivers on its 2026 margin and earnings targets. At current levels, future performance is likely to be driven primarily by semiconductor exposure, Healthcare growth, margin discipline, and strong free cash flow generation rather than aggressive revenue acceleration.
Estimate a company’s fair value instantly (Free with TIKR) >>>
Value Any Stock in Under 60 Seconds (It’s Free)
With TIKR’s new Valuation Model tool, you can estimate a stock’s potential share price in under a minute.
All it takes is three simple inputs:
- Revenue Growth
- Operating Margins
- Exit P/E Multiple
From there, TIKR calculates the potential share price and total returns under Bull, Base, and Bear scenarios so you can quickly see whether a stock looks undervalued or overvalued.
If you’re not sure what to enter, TIKR automatically fills in each input using analysts’ consensus estimates, giving you a quick, reliable starting point.
See a stock’s true value in under 60 seconds (Free with TIKR) >>>