Key Stats for DHI Stock
- Year-to-Date Performance: 9%
- 52-Week Range: $110 to $185
- Valuation Model Target Price: $185
- Implied Upside: 17%
Value your favorite stocks like D.R. Horton with 5 years of analysts’ forecasts using TIKR’s new Valuation Model (It’s free) >>>
What Happened?
D.R. Horton stock is up about 9% year to date, recently trading near $157 per share as investors responded to solid fiscal first quarter 2026 results, steady order growth, and reaffirmed full-year guidance despite continued affordability pressure in the housing market.
The gains followed first quarter results showing earnings per share of $2.03 on $6.9 billion of revenue and pretax income of $798 million with an 11.6% pretax margin, while net sales orders increased 3% year over year to 18,300 homes.
Management exceeded the high end of its revenue and closings guidance and reaffirmed fiscal 2026 expectations of $34 billion to $35 billion in revenue and 86,000 to 88,000 home closings, reinforcing confidence that volume growth remains intact even as incentives remain elevated.
President and CEO Paul Romanowski said “we exceeded the high end of our revenue and closings guidance,” supported by a 12% year-over-year increase in active selling communities and improved cycle times.
Home sales gross margin was 20.4% in the quarter, or 20% excluding a warranty recovery, and management guided second quarter gross margin to 19% to 19.5% as incentives remained elevated, though demand continued to respond to mortgage rates near 6%.
Institutional activity added to the narrative. NEOS Investment Management increased its stake by 44%, HighTower Advisors raised its holdings by 28%, and Mitchell Capital Management boosted its position by 140%, while Smead Capital trimmed its stake by 7%, Heartland Advisors reduced its position by 18%, ABN Amro cut 29%, and Illinois Municipal Retirement Fund lowered its holdings by 22%.
Institutional ownership remains high at about 91%, and although COO Michael Murray sold 120 shares in May, overall positioning reflects active but balanced institutional participation.

See analysts’ growth forecasts and price targets for D.R. Horton (It’s free) >>>
Is DHI Undervalued?
Under valuation assumptions, the stock is modeled using:
- Revenue Growth (CAGR): 4%
- Operating Margins: 10.5%
- Exit P/E Multiple: 12.5x
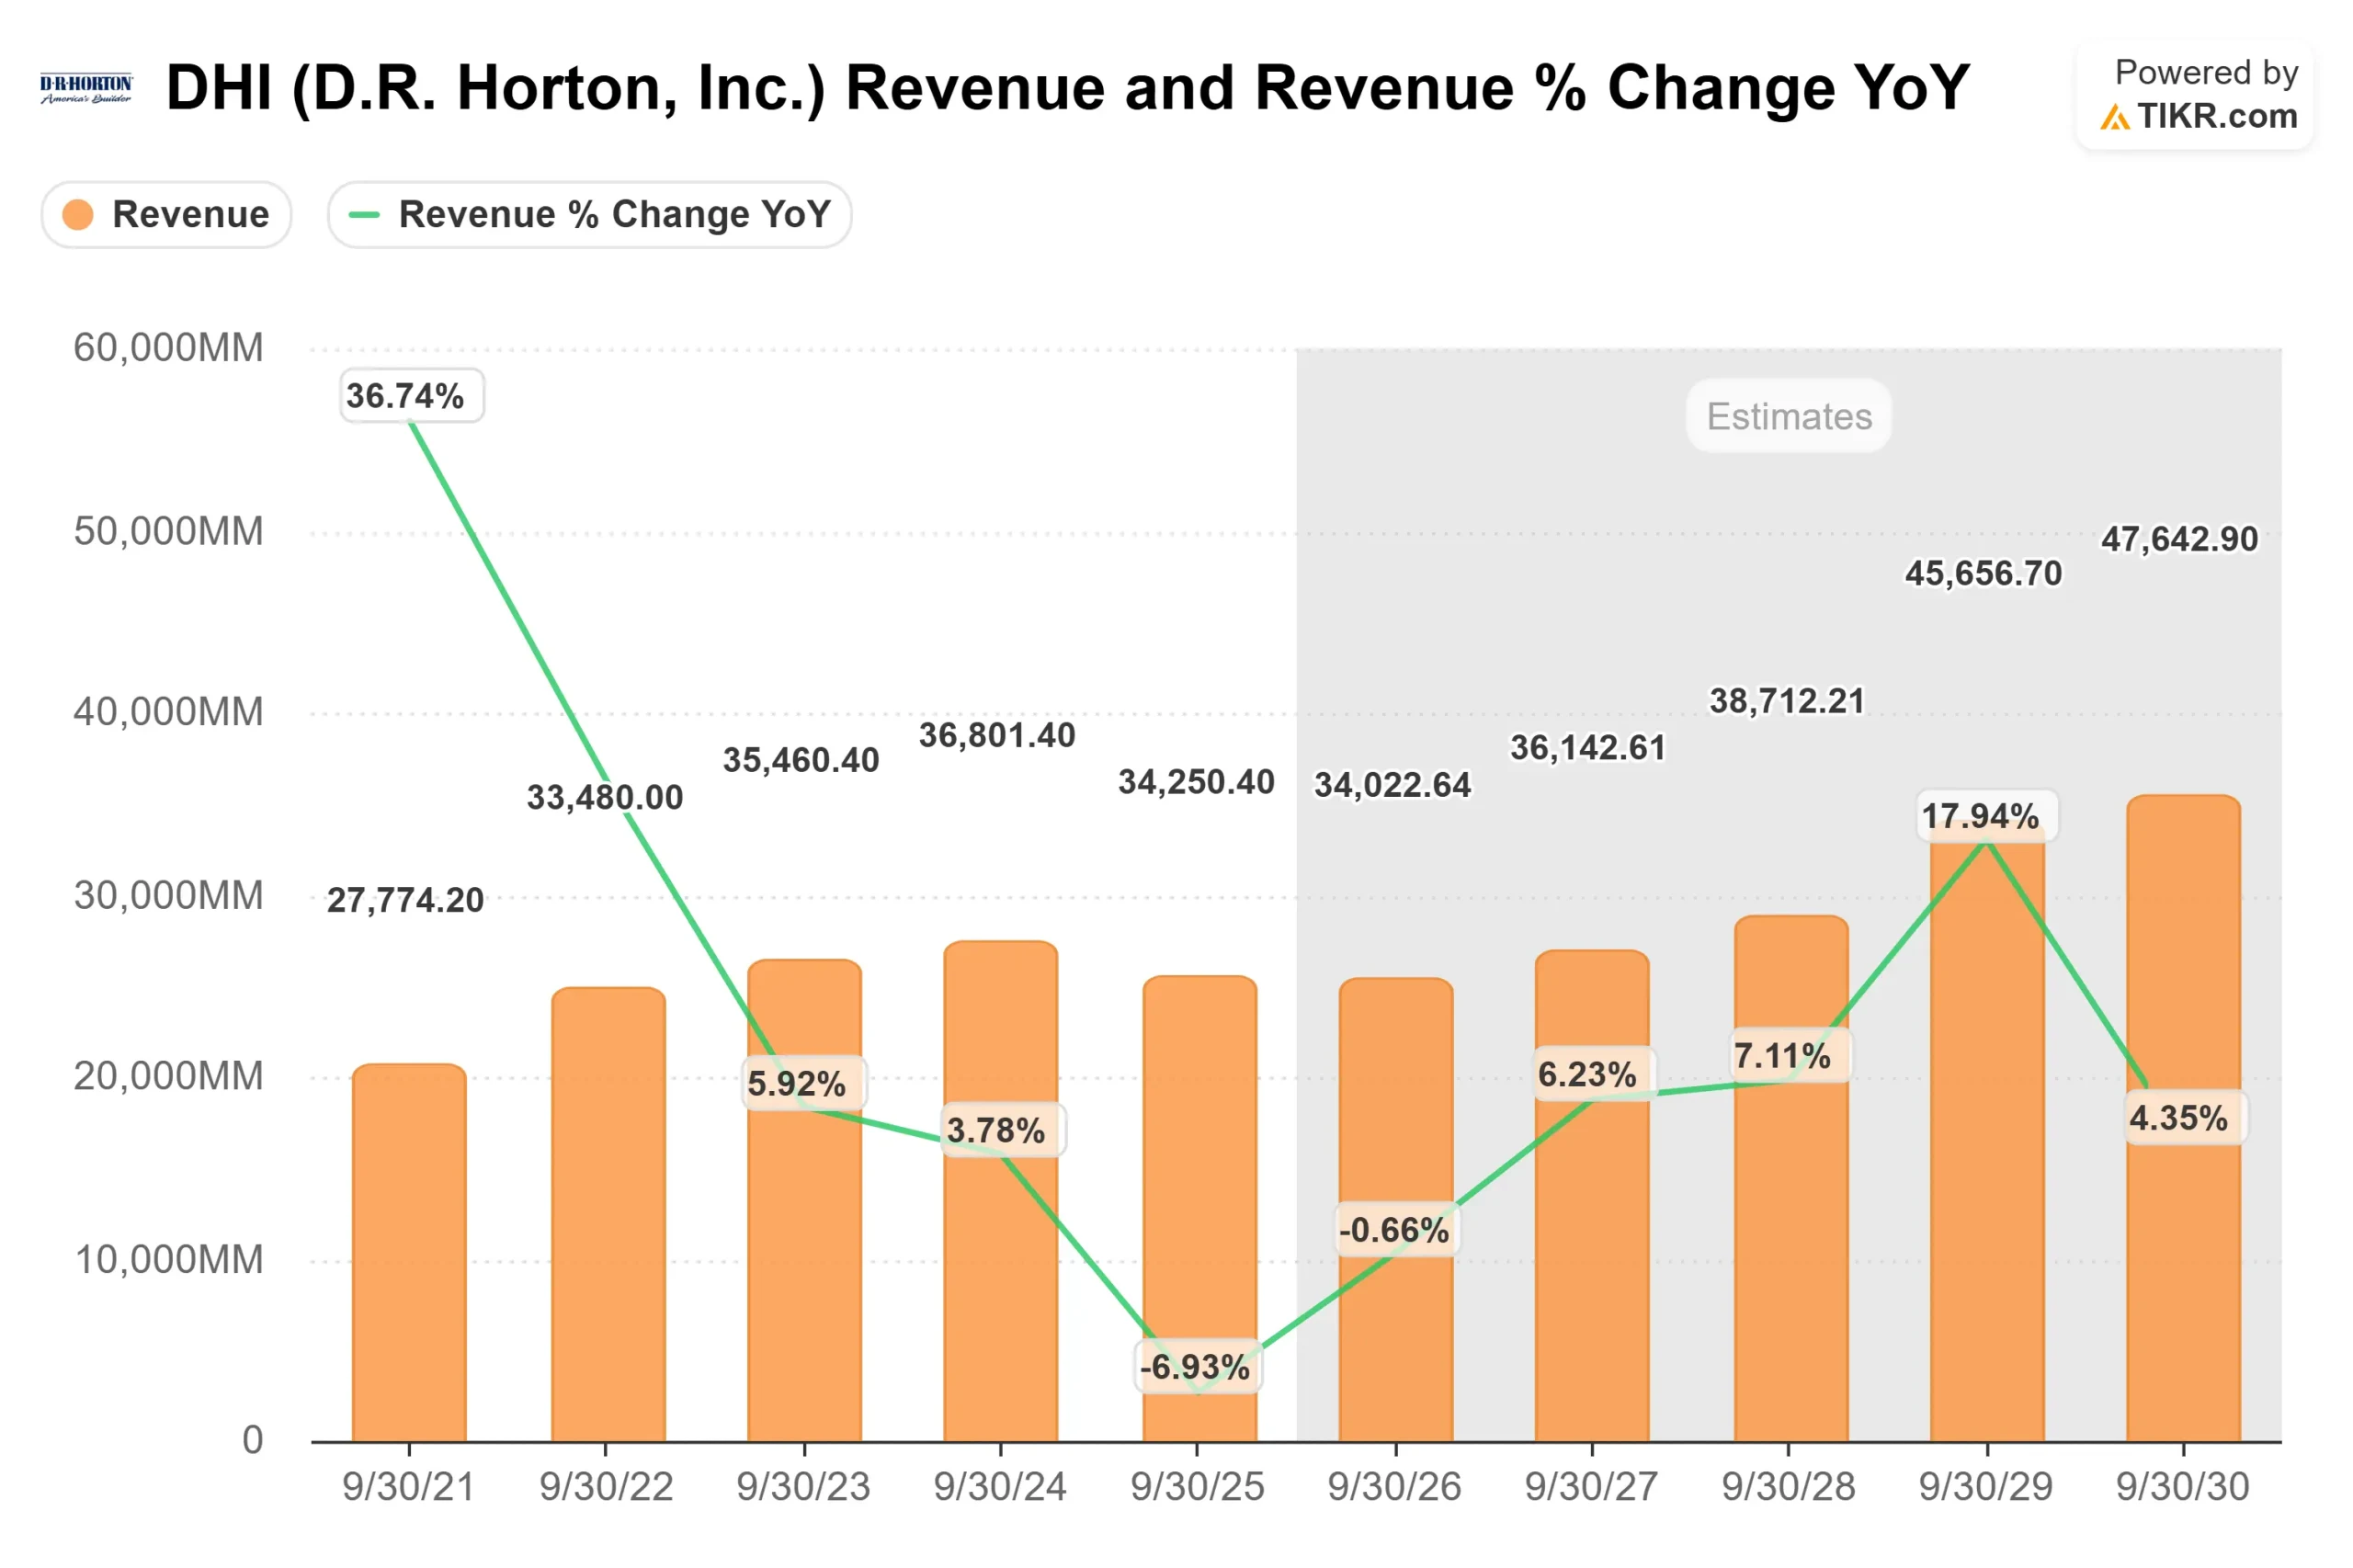
Revenue is projected to grow from about $34 billion in fiscal 2026 to roughly $48 billion by fiscal 2030, reflecting steady community expansion, entry-level demand, and disciplined land positioning rather than a return to peak housing cycle conditions.
Margins modeled at 10.5% assume incentives remain elevated but manageable, with improved cycle times and capital efficiency helping offset pricing pressure.
The company reduced completed unsold inventory sequentially and expects starts to increase in the second quarter, signaling confidence in spring demand while maintaining inventory discipline.
Over the next 12 months, key drivers include order growth, cancellation trends, incentive intensity, and mortgage rate direction.
Even modest rate compression around the 6% level has historically driven increased traffic in sales offices, which can improve absorption and backlog visibility across communities.
The company generated $854 million of operating cash flow in the quarter, repurchased $670 million of stock, and reiterated plans for approximately $2.5 billion of buybacks and around $500 million in dividends in fiscal 2026, supporting per-share earnings durability.
Based on these inputs, the valuation model implies a target price of $185, suggesting about 17% upside over the next 2 to 3 years.
At current levels near $157, D.R. Horton appears modestly undervalued, with future performance driven primarily by order momentum, margin discipline, and capital efficiency rather than rapid revenue acceleration.
Estimate a company’s fair value instantly (Free with TIKR) >>>
Value Any Stock in Under 60 Seconds (It’s Free)
With TIKR’s new Valuation Model tool, you can estimate a stock’s potential share price in under a minute.
All it takes is three simple inputs:
- Revenue Growth
- Operating Margins
- Exit P/E Multiple
From there, TIKR calculates the potential share price and total returns under Bull, Base, and Bear scenarios so you can quickly see whether a stock looks undervalued or overvalued.
If you’re not sure what to enter, TIKR automatically fills in each input using analysts’ consensus estimates, giving you a quick, reliable starting point.
See a stock’s true value in under 60 seconds (Free with TIKR) >>>