


Key Stats for Circle Internet Group Stock
- Price change for Circle Internet Group stock in the last 1 month: -12%
- $CRCL Stock Price as of Aug. 3: $60
- 52-Week High: $190
- $CRCL Stock Price Target: $117
Now Live: Discover how much upside your favorite stocks could have using TIKR’s new Valuation Model (It’s free)>>>
What Happened?
Circle Internet Group (CRCL) stock dropped more than 5% in pre-market trading on Monday after Morgan Stanley downgraded the company to Underweight from Equal Weight.
Analyst James Faucette also slashed the price target dramatically, cutting it to $38 from $106. That’s a huge cut, and it implies nearly 40% downside from where the stock closed on Friday.
The downgrade centers on USDC, the stablecoin Circle issues. Faucette said the amount of USDC in circulation may not grow as fast as investors expect, which matters because Circle earns revenue based on that circulation.
He described it as a shift toward lower-margin transaction revenue instead. He also flagged that Circle’s tokenized money market fund carries weaker underlying economics than the market may be pricing in.
Not every analyst agrees with the bearish take.
TD Cowen actually started coverage on Circle Internet Group stock with a Buy rating and an $82 price target, calling the company’s mix of growth and diversification “compelling.” TD Cowen pointed to Circle’s fast-growing, high-margin fee-based revenue as a strength.
Still, even that more bullish $82 target sits well below the broader market average price target of $117, which implies close to 90% upside from Friday’s close.
The downgrade also landed during a rough day for crypto more broadly. Bitcoin slipped below $63,000, down 0.8% over 24 hours, dragging down crypto-linked stocks across the board.
Strategy (MSTR) fell 0.8% pre-market, Bitmine Immersion Technologies (BMNR) dropped more than 1.5%, and Coinbase (COIN), which partners with Circle on USDC revenue, slipped about 0.8%. Circle Internet Group stock led the losses among large-cap crypto names.

On top of that, the crypto industry is watching Washington closely.
The CLARITY Act, a piece of legislation the industry has been counting on for regulatory certainty, didn’t appear on the Senate’s calendar this week.
The Senate is scheduled to go into recess starting August 10, which adds more uncertainty.
If a closure motion gets filed by Wednesday, a procedural vote could happen as early as Friday, but final passage wouldn’t come right away.
See analysts’ growth forecasts and price targets for Circle Internet Group stock (It’s free) >>>
What the Market Is Telling Us About Circle Internet Group Stock
The sharp drop in Circle Internet Group stock shows investors are taking Morgan Stanley’s warning seriously, especially the concern about USDC circulation slowing down.
Since Circle’s revenue model leans heavily on how much USDC is in circulation, any sign of a slowdown hits right at the core of the investment thesis.
The split between Morgan Stanley’s bearish call and TD Cowen’s bullish one also tells a story.
Wall Street doesn’t agree on where Circle Internet Group stock is headed next, and that kind of disagreement usually means more volatility ahead.
With the stock already down over 28% this year and more than 63% over the past 12 months, investors are clearly still working through how to value Circle amid regulatory uncertainty and a broader crypto pullback.
Estimate a company’s fair value instantly (Free with TIKR) >>>
How Much Upside Does Circle Internet Group Stock Have From Here?
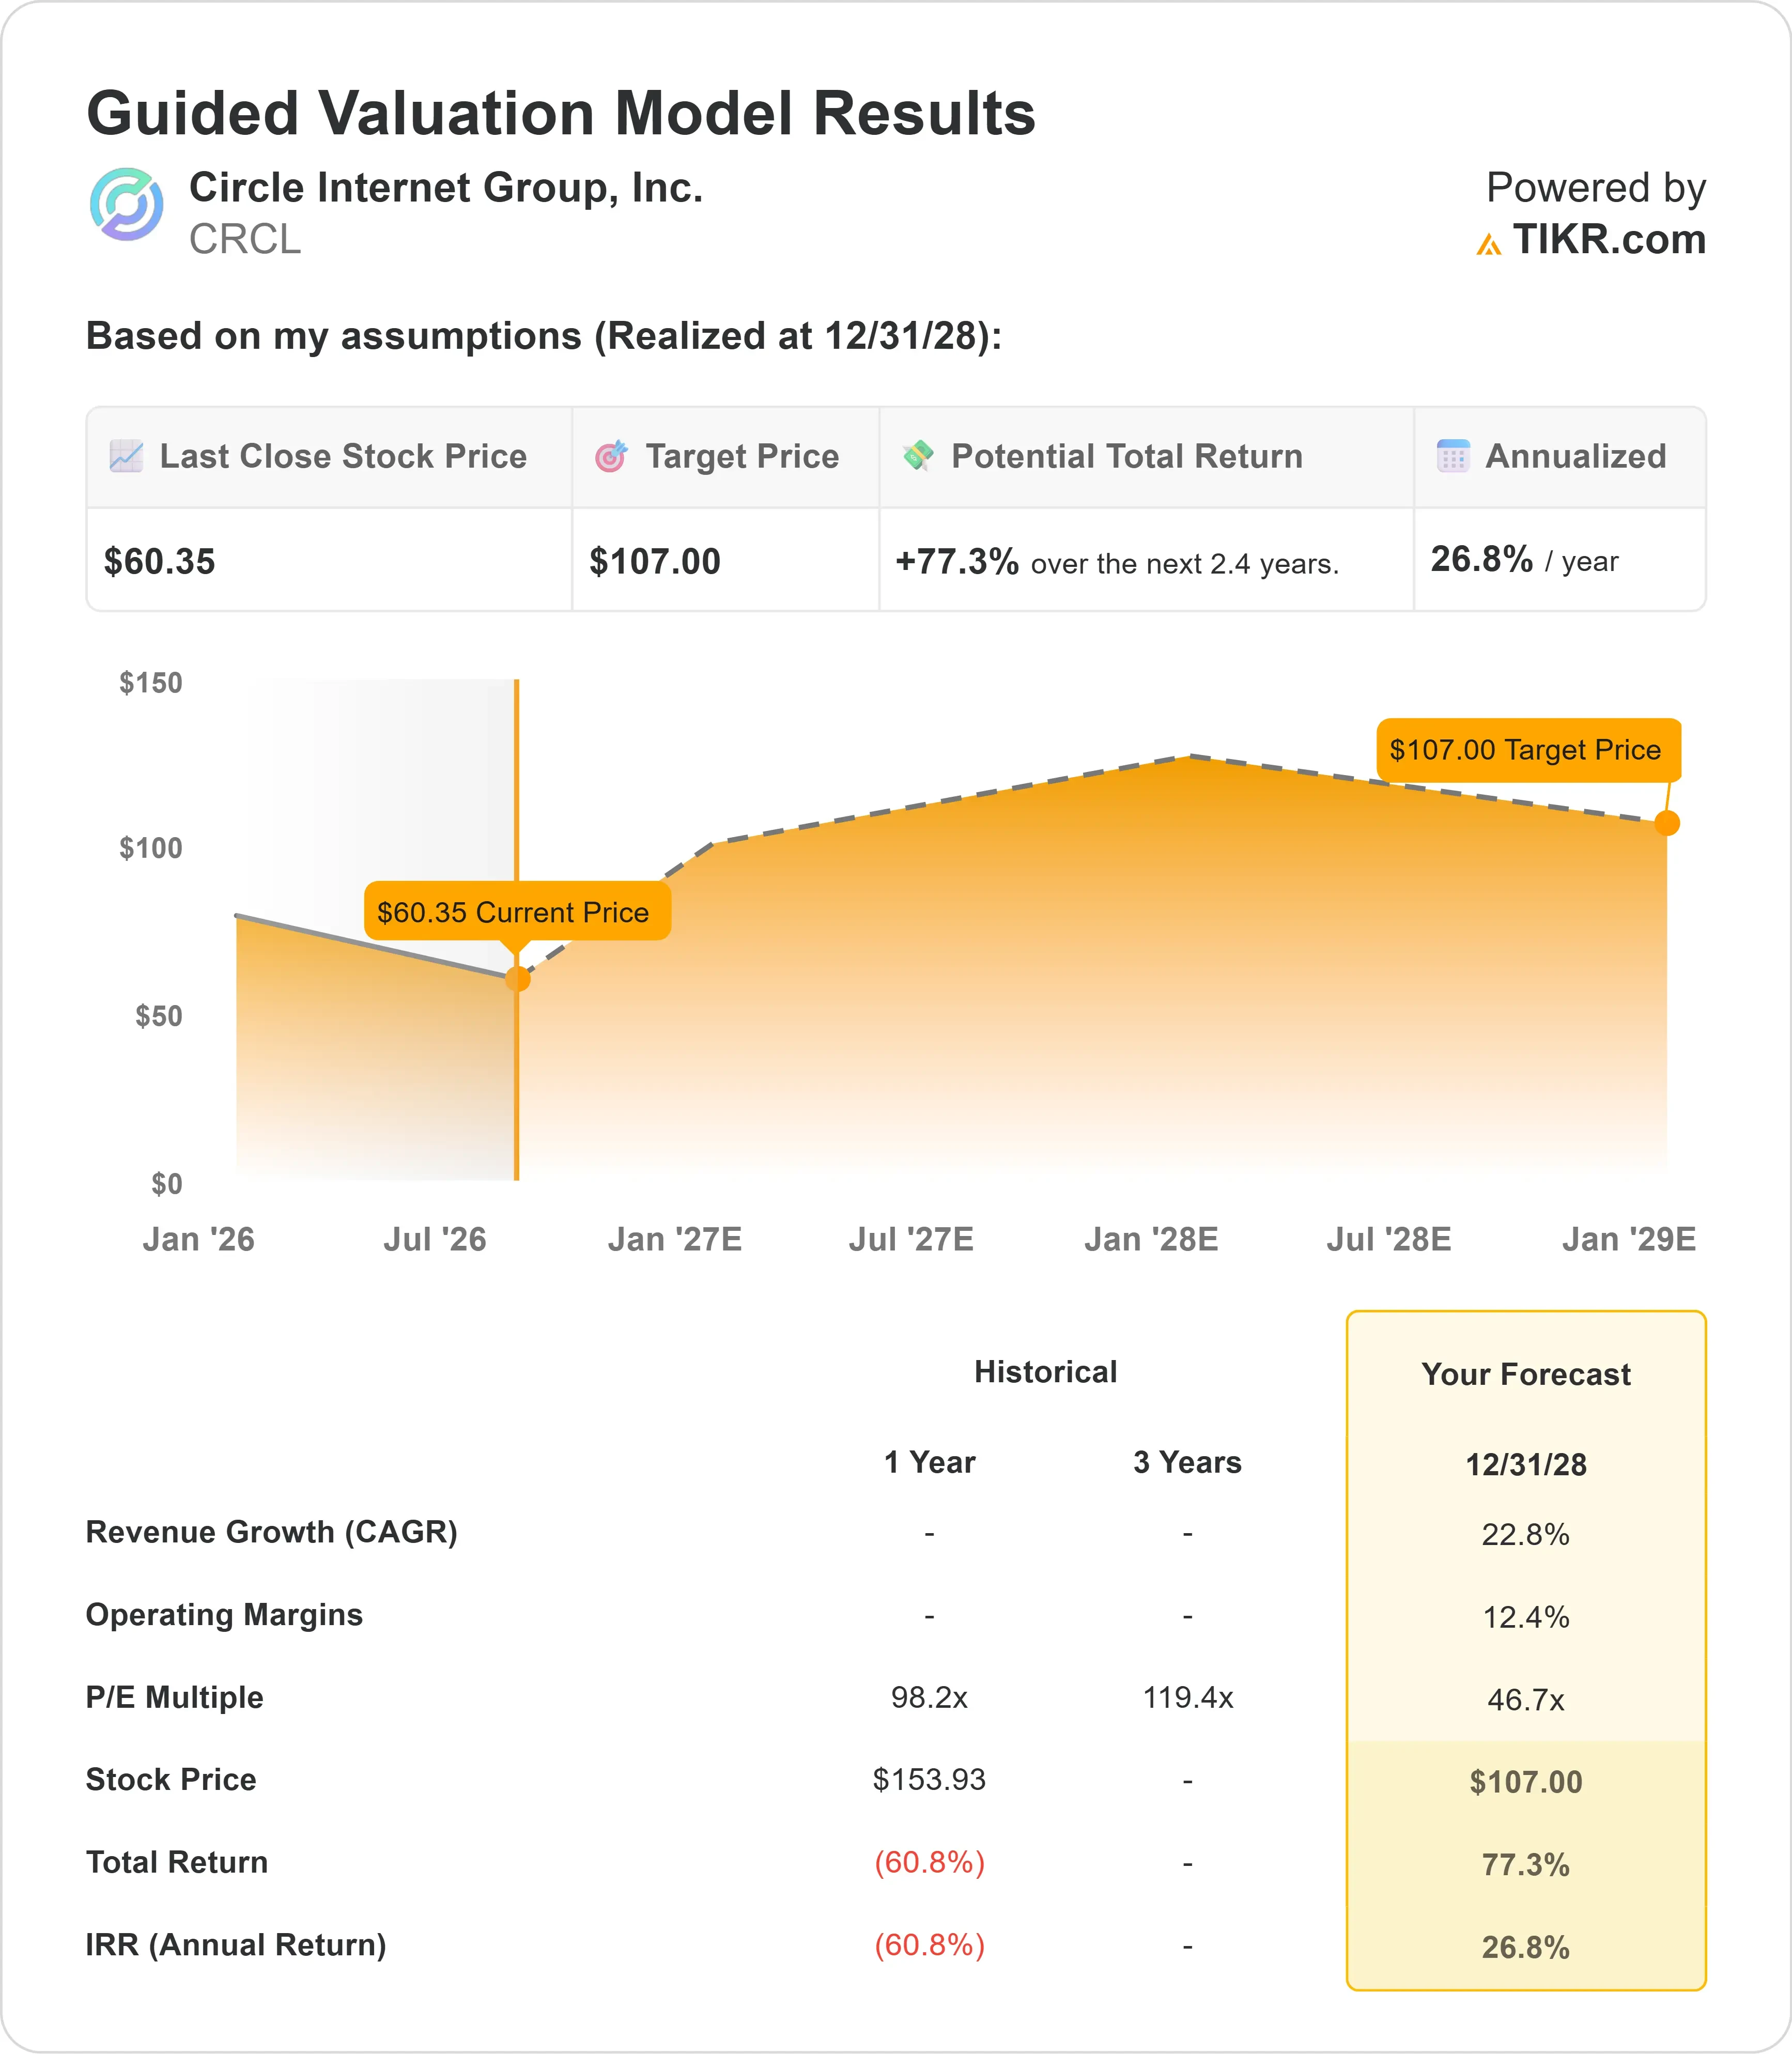
With TIKR’s new Valuation Model tool, you can estimate a stock’s potential share price in under a minute.
All it takes is three simple inputs:
- Revenue Growth
- Operating Margins
- Exit P/E Multiple
If you’re not sure what to enter, TIKR automatically fills in each input using analysts’ consensus estimates, giving you a quick, reliable starting point.
From there, TIKR calculates the potential share price and total returns under Bull, Base, and Bear scenarios so you can quickly see whether a stock looks undervalued or overvalued.
See a stock’s true value in under 60 seconds (Free with TIKR) >>>
Looking for New Opportunities?
- See what stocks billionaire investors are buying so you can follow the smart money.
- Analyze stocks in as little as 5 minutes with TIKR’s all-in-one, easy-to-use platform.
- The more rocks you overturn… the more opportunities you’ll uncover. Search 100K+ global stocks, global top investor holdings, and more with TIKR.
Disclaimer:
Please note that the articles on TIKR are not intended to serve as investment or financial advice from TIKR or our content team, nor are they recommendations to buy or sell any stocks. We create our content based on TIKR Terminal’s investment data and analysts’ estimates. Our analysis might not include recent company news or important updates. TIKR has no position in any stocks mentioned. Thank you for reading, and happy investing!


