


Key Stats for Charter Communications Stock
- 52-Week Range: $137 to $422
- Current Price: $145
- Street Mean Target: $243
- Street High Target: $413
- Analyst Consensus: 5 Buys / 10 Holds / 5 Sells
- TIKR Model Target (Dec. 2030): $186
Charter Communications Stock Falls 65% from Its Peak as Broadband Losses Mount — But the CapEx Story Changes Everything
Charter Communications (CHTR), the nation’s largest cable operator by subscribers, shed more than 18% in a single session on April 24, 2026, after reporting that it lost 120,000 internet customers in Q1, wider than analysts’ estimate of around 100,000 losses.
The stock was already down from a 52-week high of around $422. After earnings, it fell further, trading around $146 today, a collapse of roughly 65% from that peak.
The subscriber headline was bad. The reaction may have been worse.
Charter’s Q1 revenue came in at $13.60 billion, essentially flat versus the prior year and roughly in line with the Wall Street estimate of around $13.55 billion. The miss was not revenue. It was optics: more broadband losses than expected, and CFO Jessica Fischer’s comment that broadband ARPU growth for the year would be “close either way” to flat.
CEO Christopher Winfrey was direct about why the market reacted the way it did at the MoffettNathanson conference. “I think more importantly, if you think about how we’ve always managed the business, we’ve never managed it for short-term ARPU, much less product ARPU,” he said, adding that the market reaction to Fischer’s honest in-quarter assessment was disproportionate to the underlying fundamentals.
At the same conference, he framed the core investment case bluntly: “If you take consensus 2026 free cash flow and substitute our expected 2028 CapEx for 2026 CapEx, our current stock price would imply a free cash flow multiple of only about 3.8x, and a free cash flow yield of over 25%.”
That is the number the market has not yet priced in.
Charter is spending around $11.4 billion in capital expenditures in 2026 to complete two overlapping investment cycles: a nationwide network evolution project to multi-gigabit symmetrical speeds, and a subsidized rural fiber buildout targeting more than 1.7 million new locations. Both conclude in 2027. After that, management has guided total CapEx to fall below $8 billion per year, a reduction equivalent to more than $28 of free cash flow per share at the current share count.
The Cox Communications acquisition, approved federally and pending only California regulatory sign-off with a summer close expected, adds another layer. Charter now estimates at least $800 million in run-rate operating expense synergies, up from an initial $500 million estimate. The deal itself deleverages the balance sheet at close, with management targeting the low end of a 3.5 to 3.75 leverage ratio within three years of closing.
Meanwhile, Spectrum Mobile continues to grow. Charter crossed 12 million mobile lines in Q1, adding around 370,000 lines in the quarter and nearly 1.8 million over the trailing twelve months, representing over 17% growth year-over-year despite heavy device subsidy activity from the three major carriers.
The fiber buildout continues on a county-by-county basis: Harrison County, Indiana (4,000 locations), Panola County, Texas (4,000 locations), Wayne County, Indiana (3,100 locations), Johnson County, Missouri (3,800 locations), all reached in the past six weeks, each part of a multi-year rural program backed by more than $7 billion in private investment.
The thesis is not that Charter’s broadband subscriber trends will reverse overnight. They will not. The thesis is that the market is pricing Charter Communications stock as a declining cable operator while the company is spending capital at a rate it will never repeat and sitting a year away from one of the largest free cash flow inflections in the sector.
What Analysts Say About CHTR Stock — and Why the Consensus Undersells the Setup

Wall Street is split on Charter Communications stock. The current consensus breaks down as 5 Buys, 10 Holds, and 5 Sells, with a mean price target of around $244 against a current price of around $146. That mean target implies roughly 67% upside from current levels. The street high target sits at around $413.
The debate inside the analyst community is not about whether Charter’s network is good. It is about whether subscriber trends can inflect before the company is forced to compete on price. That tension defines why the consensus leans Hold rather than Buy despite the target implying significant upside.

The metric that best captures the forward case is EPS. Charter’s Q1 2026 GAAP EPS came in at $9.17. TIKR’s forward estimates show consensus EPS rising to around $10 per share for Q2 2026, around $10 for Q3, and around $12 for Q4, with full-year 2027 estimates implying further expansion.
The EPS growth trajectory is accelerating even as revenue holds flat, driven by lower programming costs, operating cost reductions, and share repurchases. Charter bought back 4.3 million shares for around $963 million in Q1 alone, at an average price of around $225 per share.
Free cash flow tells the more compelling story. Q1 2026 FCF came in at $1.37 billion, up from a depressed Q4 2025 figure. Forward estimates show Q2 2026 FCF around $1.16 billion and Q4 2026 around $1.42 billion, with the CapEx step-down beginning to show in the numbers.
The FCF margin for the trailing period sits around 10%, and as network evolution spending concludes, that margin is expected to expand materially.
TIKR’s data shows the street’s mean target of around $244 represents a 67% implied upside, which places Charter Communications stock firmly in undervalued territory relative to consensus expectations even before any Cox synergy credit.
Is Charter Communications Stock Undervalued? TIKR’s $186 Target and the Free Cash Flow Inflection Ahead
TIKR’s base case values Charter Communications at around $186 by December 2030, implying roughly 28% total return from the current price of around $146, or around 6% annualized over 4.6 years.
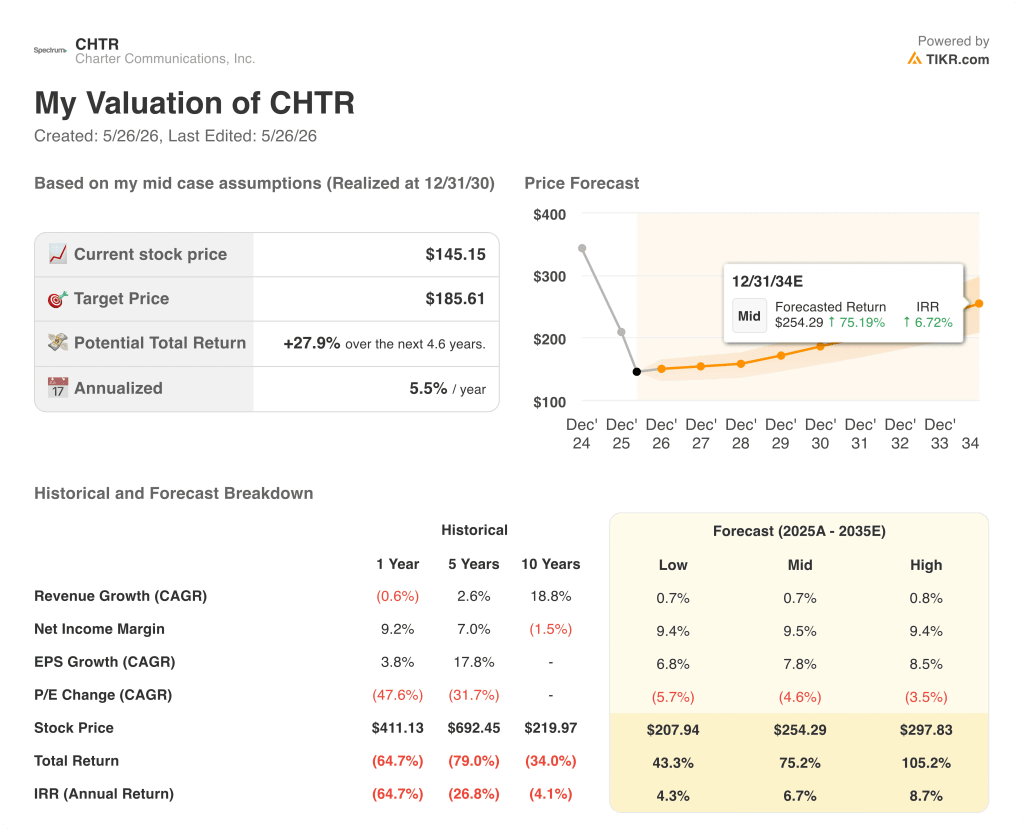
The low case, anchored to a revenue CAGR of around 1% and EPS CAGR of around 7%, projects a stock price of around $208 by December 2035, a total return of around 43% and an IRR of roughly 4%. This scenario assumes competitive pressure keeps broadband subscriber trends negative through mid-decade and Cox synergies come in at the low end of guidance.
The mid case, which assumes a similar revenue CAGR of around 1% alongside an EPS CAGR of around 8% and modest P/E multiple expansion, projects Charter stock at around $254 by December 2035, a total return of around 75% and an IRR of roughly 7%. This is the scenario where Cox closes on schedule, CapEx falls as guided, and the mobile business continues compounding toward full household penetration.
In the high case, where EPS compounds at roughly 9% and the P/E contraction slows from its current pace, Charter stock reaches around $298 by December 2035, a total return of around 105% and an IRR of roughly 9%. This scenario requires the Cox integration to exceed synergy targets and the mobile business to begin closing the gap between Charter’s current around 20% broadband customer penetration for mobile and the national household average of above 2.5 lines per account.
At around $146, Charter Communications stock is undervalued relative to all three scenarios in the TIKR model. The market’s current implied price reflects a business with no free cash flow inflection and no synergy credit from the largest cable acquisition in a decade. TIKR’s data shows that even the low case produces material upside from current levels.
Is Charter Communications stock a buy right now?
Charter Communications stock is undervalued against TIKR’s mid-case target of around $254 by December 2035, which implies a roughly 75% total return and an IRR of around 7%.
The near-term risk is continued broadband subscriber pressure from fixed wireless and fiber competition, but the free cash flow inflection expected as CapEx falls below $8 billion annually by 2028 is not yet reflected in the stock’s current price of around $146.
Should You Invest in Charter Communications, Inc.?
The only way to really know is to look at the numbers yourself. TIKR gives you free access to the same institutional-quality financial data that professional analysts use to answer exactly that question.
Pull up Charter Communications, Inc. stock and you’ll see years of historical financials, what Wall Street analysts expect for revenue and earnings in the quarters ahead, how valuation multiples have moved over time, and whether price targets are trending up or down.
You can build a free watchlist to track Charter Communications, Inc. alongside every other stock on your radar. No credit card required. Just the data you need to decide for yourself.
Access Professional Tools to Analyze CHTR stock on TIKR for Free →


