
Finding a “compounder” stock is often described as the holy grail of investing. These are the rare businesses that don’t just grow, they possess a specialized “internal engine” that allows them to reinvest earnings at high rates of return. Over time, this creates a snowball effect where the company’s intrinsic value grows exponentially, regardless of short-term market volatility.
Historically, identifying these “100-baggers” required deep-dive access to years of financial statements and the ability to manually calculate complex capital allocation metrics. For the retail investor, it was easy to get distracted by “fast growers” that were actually burning cash to achieve their numbers. A true compounder, however, is defined by its Return on Invested Capital (ROIC) and its ability to maintain that return over a multi-decade horizon.
The following tools act as your specialized filter for finding these high-quality businesses. By using these platforms to screen for persistent profitability, track management’s capital allocation history, and audit long-term margin stability, you can move away from “stock picking” and toward building a portfolio of durable wealth creators. These are the best free resources for identifying businesses with the structural DNA to compound your capital over the next 20 years.
1. TIKR
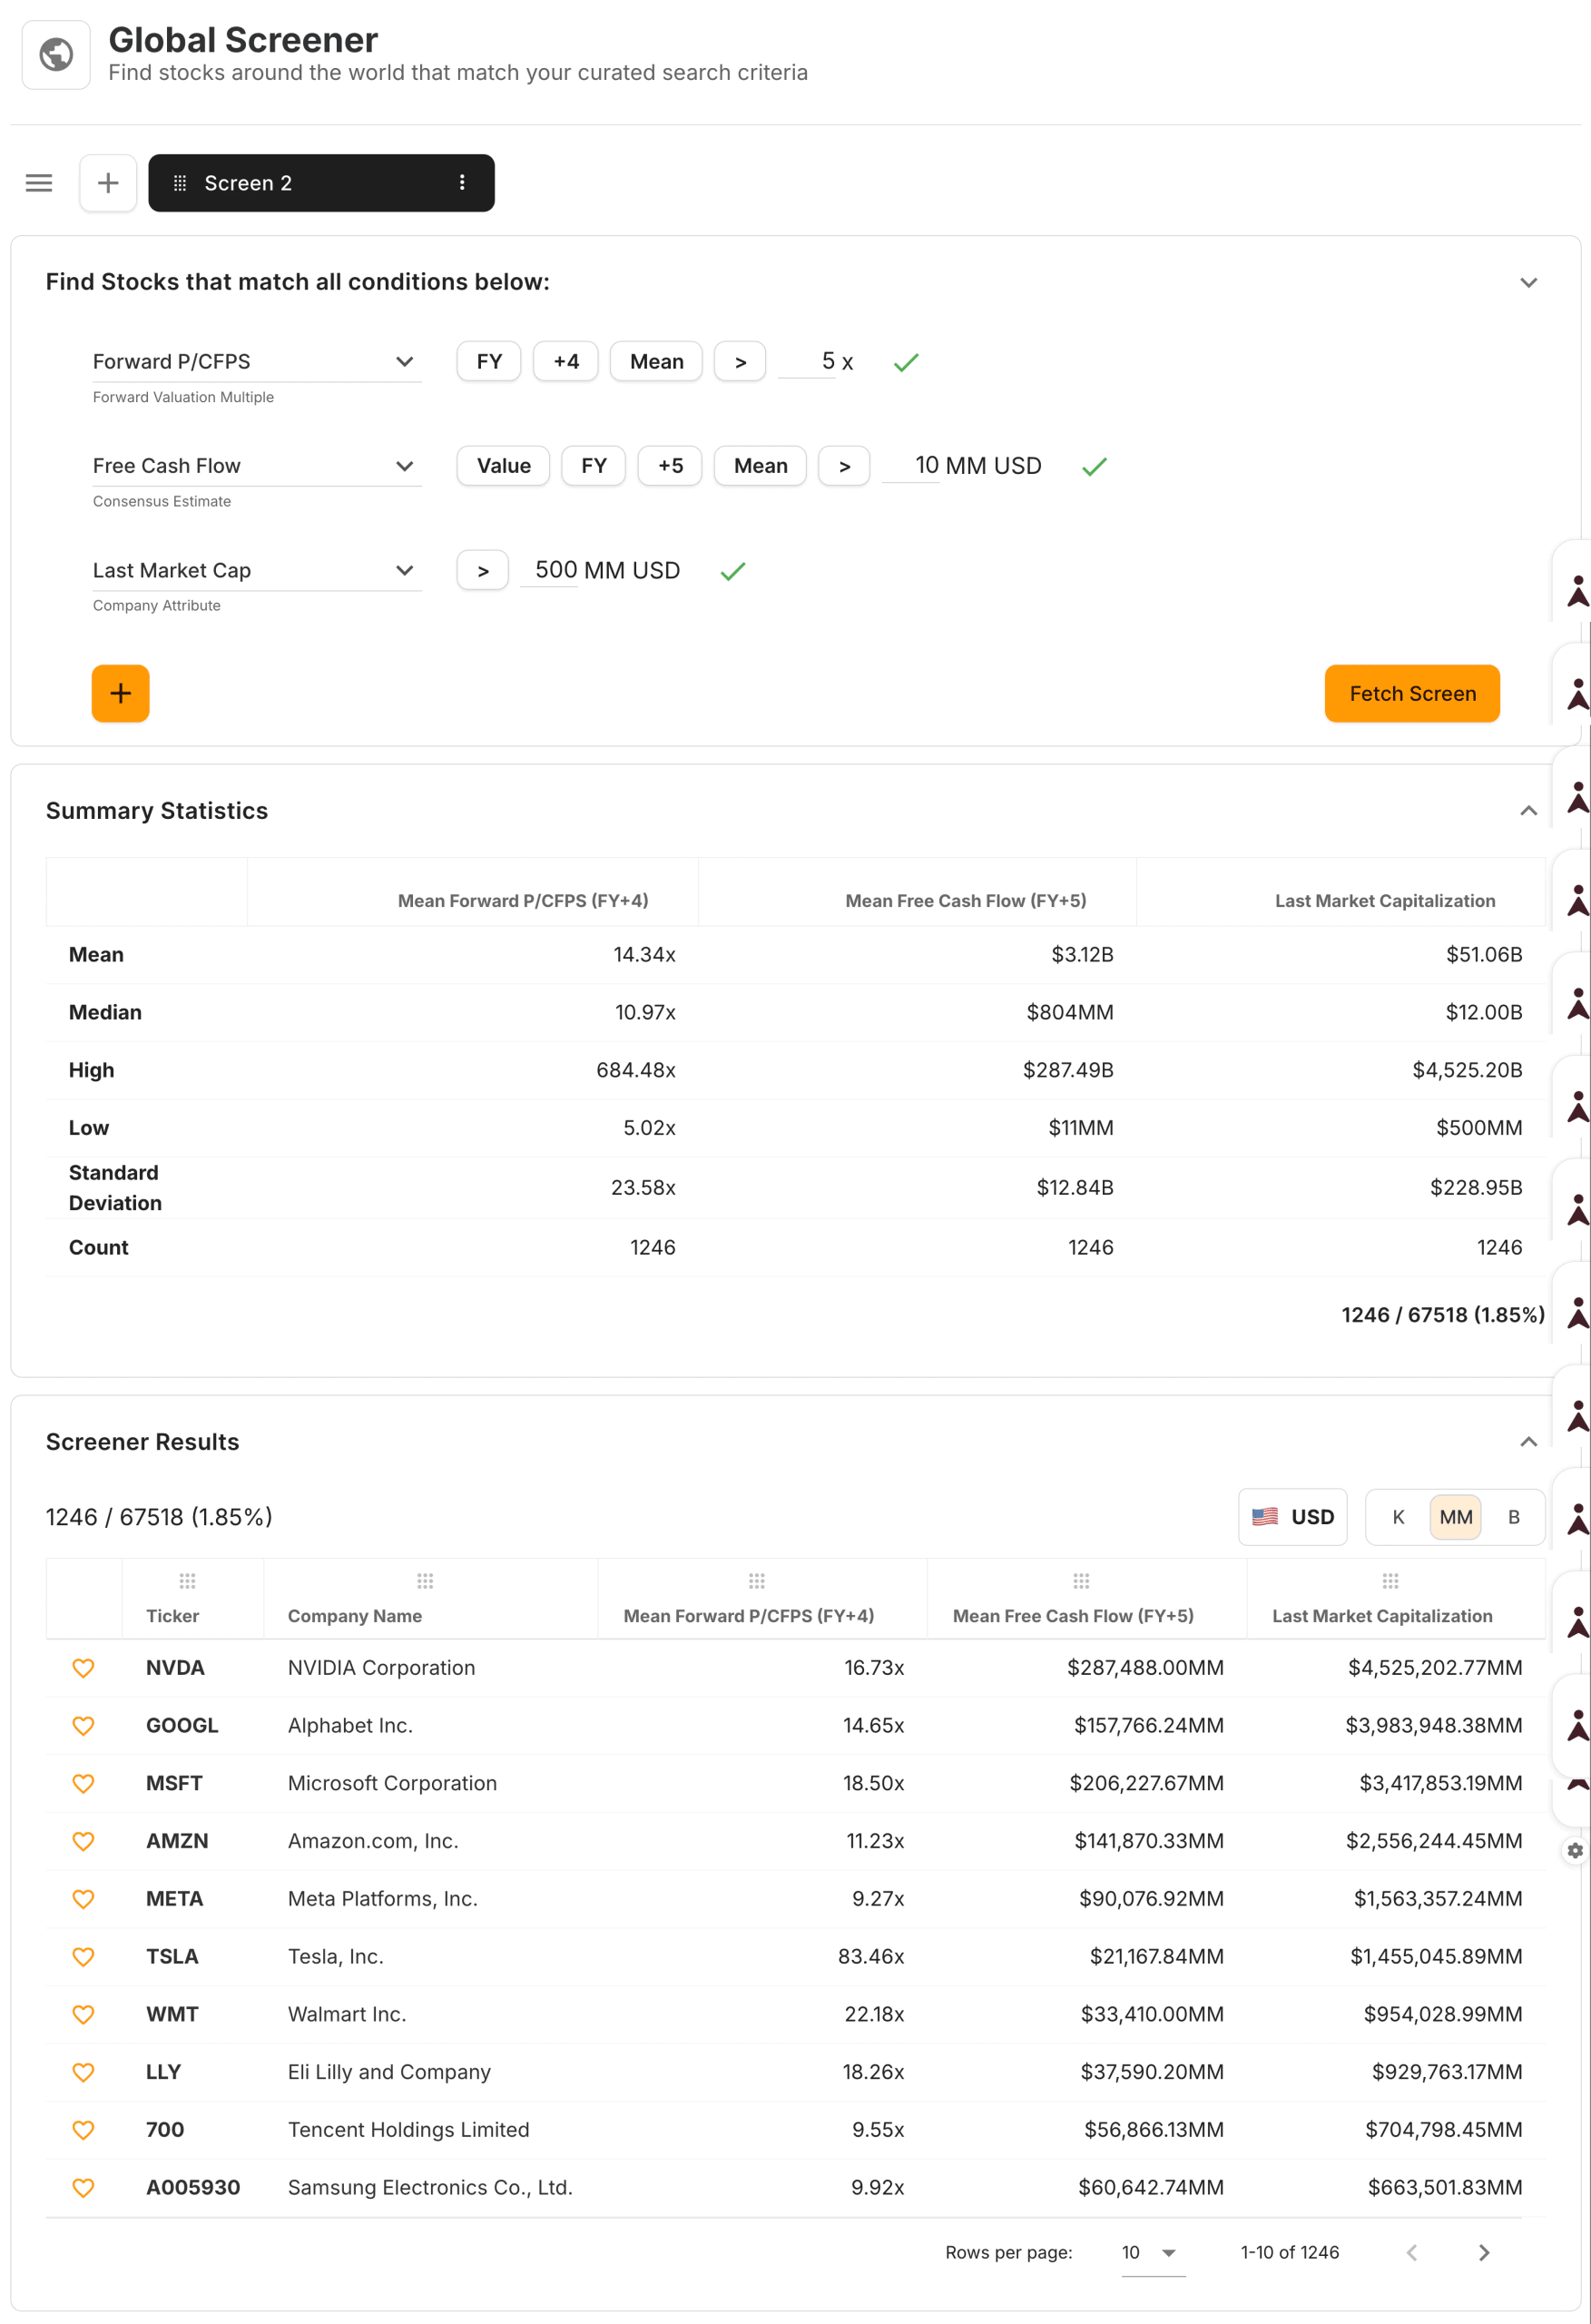
TIKR is the premier platform for identifying compounders because it provides multiple years of standardized financial data necessary to see a compounding story unfold. While most free tools only give you a three-to-five-year snapshot, TIKR allows you to track a company’s ROIC and Free Cash Flow (FCF) margins across multiple economic cycles. This long-term perspective is the only way to verify if a company’s high returns are a permanent structural advantage or just a temporary peak.

The platform’s Global Screener is a massive advantage for compounder hunting, as it allows you to search across 100,000+ stocks for specific “quality” filters. You can screen for companies that have maintained an ROIC above a certain percentage or evaluate free cash flow levels over a decade while simultaneously growing their book value. Once you find a candidate, the Transcripts integration lets you audit management’s past capital allocation decisions to see whether they actually followed through on their promises to reinvest for growth.
Best Features:
- 15+ Years of ROIC Data: Verify the long-term durability of a company’s “internal engine” by auditing returns on capital across a decade or more.
- Global Quality Screener: Filter 100k+ stocks by FCF yield, ROIC, and debt-to-equity to find high-quality businesses in any market.
- Capital Allocation History: Use the “Detailed Financials” to see exactly how much of the cash flow is being reinvested into CAPEX vs. being paid out.
- Transcript Cross-Referencing: Search management commentary for “reinvestment opportunities” to see if the moat is widening or shrinking.
Build your own screener to find the best stocks to buy today (Free with TIKR) >>>
2. Morningstar
Morningstar is the industry standard for qualitative moat analysis, which is the defensive half of the compounding equation. While other tools focus on the numbers, Morningstar provides “Economic Moat” ratings (Wide, Narrow, or None) that help you understand the “why” behind a company’s high returns. It helps you identify if a compounder’s edge comes from a brand, network effects, or cost advantages that are difficult for competitors to replicate.
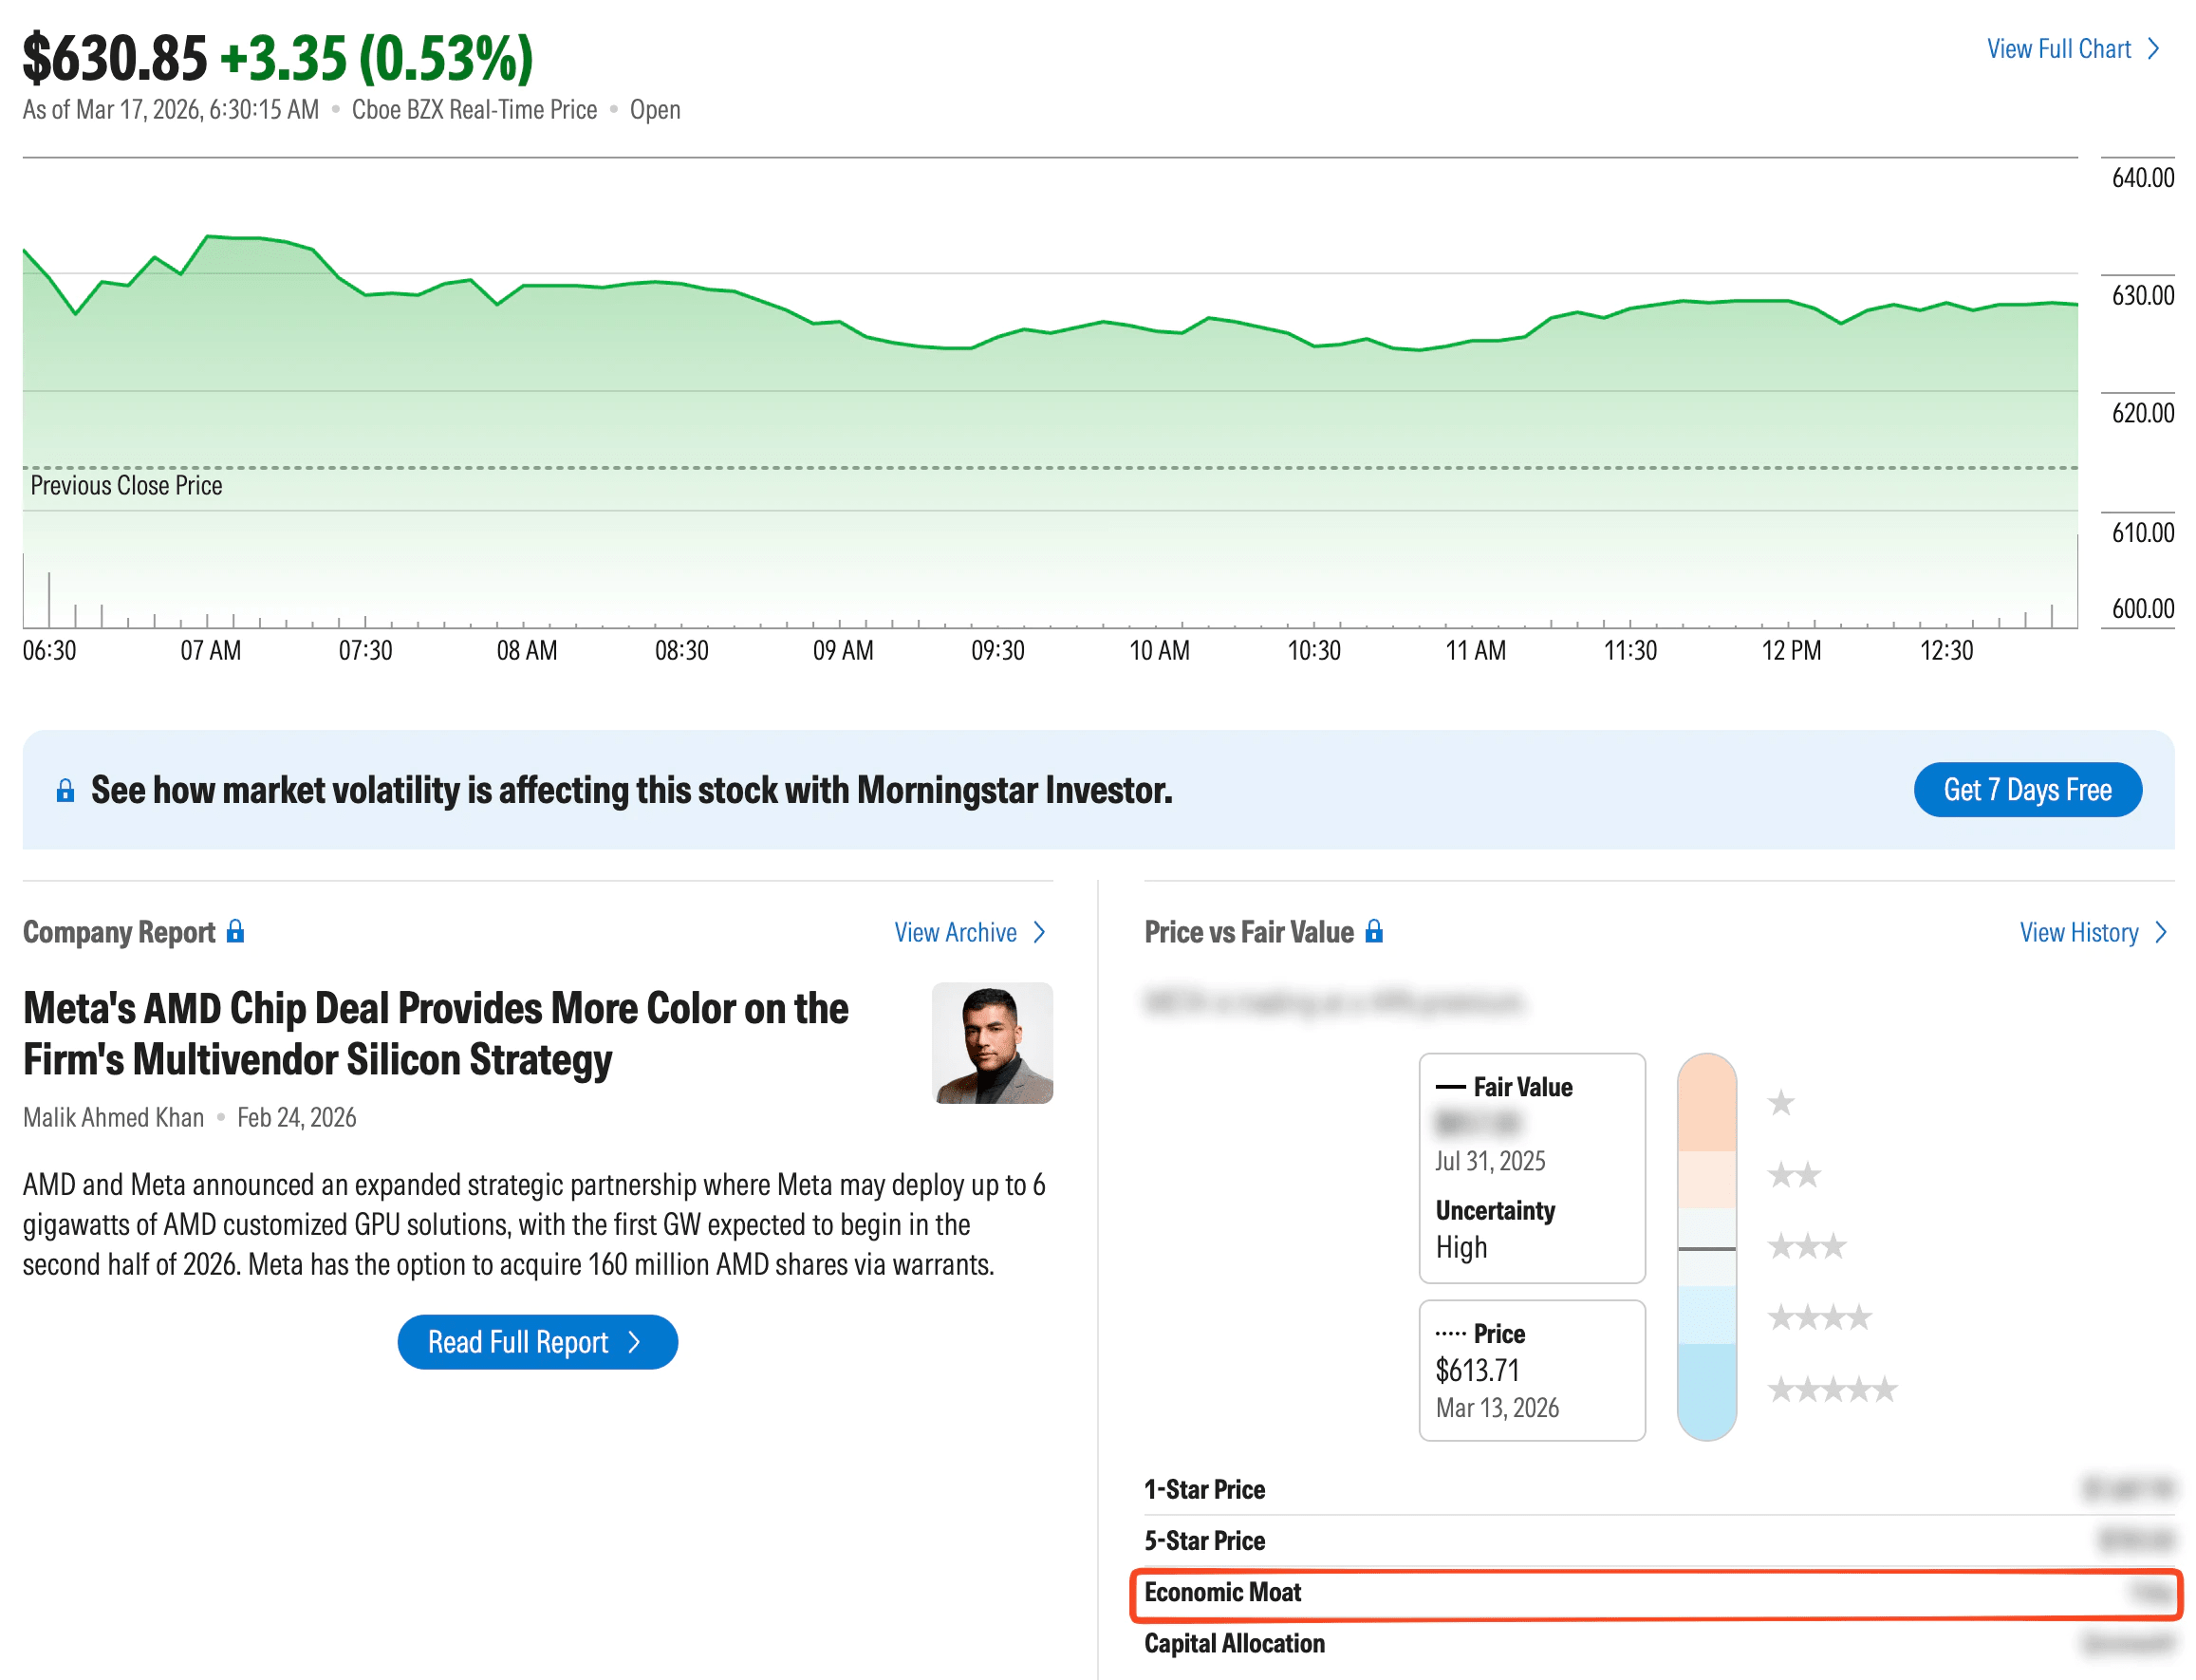
The platform also provides a Capital Stewardship rating, which audits how effectively management has used shareholder capital in the past. This is a vital “sanity check” for any compounder thesis; even a great business can be ruined by a management team that overpays for acquisitions or wastes cash on unproductive projects.
Best Features:
- Morningstar does this best by providing an Economic Moat Rating that helps you identify the structural durability of a company’s competitive advantage.
3. Finviz
Finviz is the go-to tool for rapidly identifying margin leaders across the entire market. Its screener allows you to filter for stocks that have shown consistent “EPS growth past 5 years” combined with “High Operating Margins.” This helps you build a “top-of-funnel” list of companies that are showing the initial mathematical signs of being a compounder before you dive into a deep-dive audit.

The tool’s visual interface is particularly helpful for spotting performance outliers in specific sectors. By using the heatmap and the screener’s performance filters, you can identify companies that consistently outperform their peers, which is often the first sign that a business has a superior compounding engine.
Best Features:
- Finviz does this best by providing Margin Trend Filters that let you find companies with superior profitability compared to their industry averages in seconds.
Use TIKR’s Global Screener tool to evaluate free cash flow on any stock (It’s free) >>>
4. Stock Rover
Stock Rover excels at providing detailed quality and growth scores that rank stocks against their historical performance and their industry peers. It offers a specialized “Quality Score” that aggregates metrics like ROIC, net margin, and debt-to-equity into a single number. This makes it incredibly easy to compare two potential compounders side by side to see which has the “cleaner” financial profile.

The platform also allows detailed portfolio backtesting, helping you see how a group of high-quality stocks would have performed over time. This helps build the psychological conviction needed to hold a compounder through the inevitable market drawdowns, as you can see the historical proof of the compounding effect.
Best Features:
- Stock Rover does this best by offering Comprehensive Quality Scoring that ranks companies based on their track record in efficiency and capital allocation.
Identify compounder stocks in under 60 seconds (Free with TIKR) >>>
5. GuruFocus
GuruFocus is designed for investors who want to verify a compounder’s financial strength and safety. It provides a suite of forensic scores, like the Piotroski F-Score and the Altman Z-Score, to ensure that a company’s high returns aren’t being propped up by excessive debt or aggressive accounting. This is an essential “defense” tool to ensure your compounder isn’t a “house of cards.”
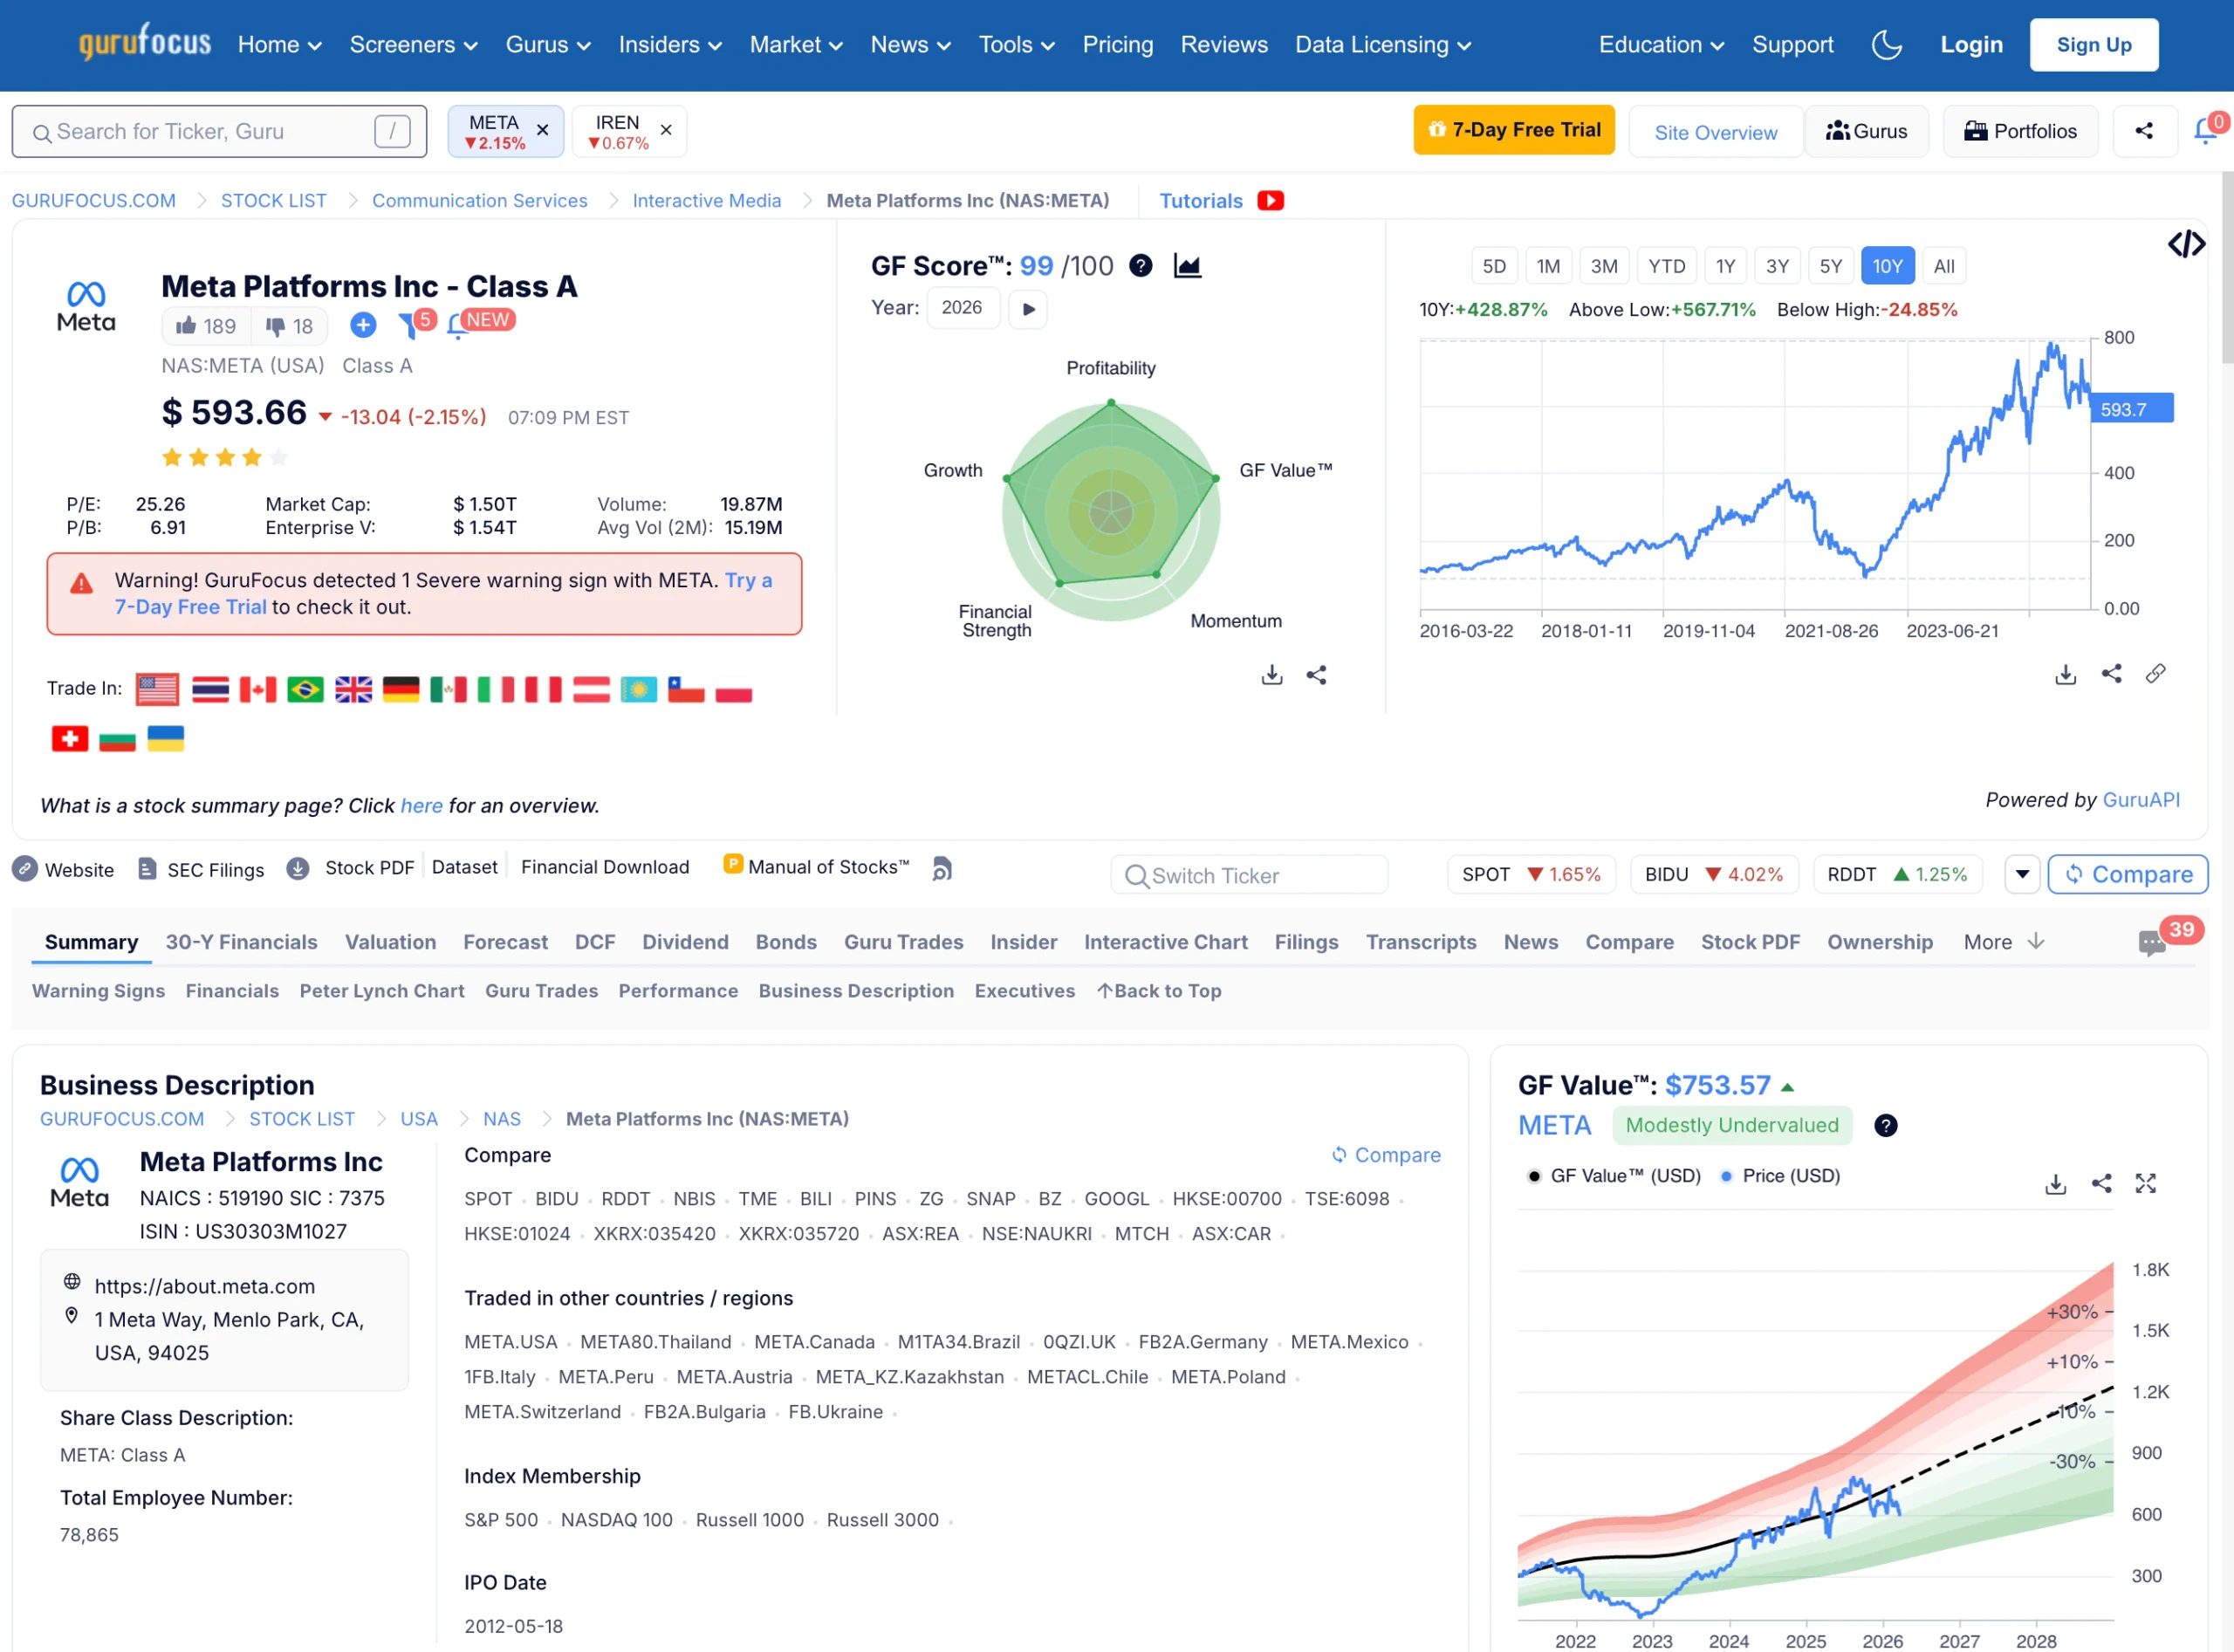
The platform’s 10-Year Financials view is specifically tailored for value investors, allowing you to see the “long-term predictability” of a business. For a compounder, predictability is key; GuruFocus lets you see whether a company’s growth has been steady and reliable or erratic and capital-intensive.
Best Features:
- GuruFocus does this best by providing Financial Predictability Ranks and forensic safety scores to ensure a company’s compounding is sustainable.
TIKR Takeaway
Identifying a true compounder isn’t about chasing the latest trend; it’s about verifying a long-term track record of capital efficiency. TIKR is the only platform that provides the deep historical data and segment-level insights needed to prove a company’s “internal engine” is actually built to last.
By allowing you to audit 15+ years of ROIC and management’s reinvestment strategy through transcripts, TIKR gives you the tools to distinguish between a temporary winner and a durable wealth creator. It turns the search for compounders from a qualitative guessing game into a quantitative, evidence-based process.
Find undervalued stocks in less than 60 seconds with TIKR’s new Valuation Model (It’s free) >>>
Value Any Stock in Under 60 Seconds with TIKR
With TIKR’s new Valuation Model tool, you can estimate a stock’s potential share price in under a minute.
All it takes is three simple inputs:
- Revenue Growth
- Operating Margins
- Exit P/E Multiple
If you’re not sure what to enter, TIKR automatically fills in each input using analysts’ consensus estimates, giving you a quick, reliable starting point.
From there, TIKR calculates the potential share price and total returns under Bull, Base, and Bear scenarios so you can quickly see whether a stock looks undervalued or overvalued.
See a stock’s true value in under 60 seconds (Free with TIKR) >>>
Looking for New Opportunities?
- Discover which stocks billionaire investors are purchasing, so you can follow the smart money.
- Analyze stocks in as little as 5 minutes with TIKR’s all-in-one, easy-to-use platform.
- The more rocks you overturn… the more opportunities you’ll uncover. Search 100K+ global stocks, global top investor holdings, and more with TIKR.
Disclaimer:
Please note that the articles on TIKR are not intended to serve as investment or financial advice from TIKR or our content team, nor are they recommendations to buy or sell any stocks. We create our content based on TIKR Terminal’s investment data and analysts’ estimates. Our analysis might not include recent company news or important updates. TIKR has no position in any stocks mentioned. Thank you for reading, and happy investing!