


Key Takeaways
- AT&T yields 4.6% and plans to hold its dividend at $1.11 a share, while Enbridge yields 6.0% and raised its dividend 3% in December 2025 for the 31st year in a row.
- AT&T’s dividend took 45% of its free cash flow over the 12 months to June 30, 2026, and buybacks take most of the rest of its 2026 free cash flow outlook.
- Enbridge’s distributable cash flow covered its dividend 1.51x in fiscal 2025, but its net debt is 6.3x EBITDA, against 2.91x for AT&T.
- The 10-year income math depends on whether Enbridge can keep raising its dividend while it brings its debt back into its target range by the end of 2026.
AT&T (T) said in July that it would speed up its buybacks to about $10 billion this year, while its dividend stays at $1.11 a share. Nine days later, Enbridge (ENB) reaffirmed its 2026 guidance and its plan to grow distributable cash flow per share about 5% a year after 2026.
So income investors are weighing a flat check from AT&T at a 4.6% yield against a rising one from Enbridge at 6.0%, with a lot more debt behind it. Which one pays you more over the next 10 years?
| Metric | AT&T (T) | Enbridge (ENB) |
|---|---|---|
| Dividend yield | 4.6% | 6.0% |
| Dividend growth, fiscal 2020 to fiscal 2025 | -11.8% a year | 3.1% a year |
| Coverage, last reported | Cash dividend payout ratio: 45% (TTM to June 30, 2026) | Distributable cash flow coverage: 1.51x (fiscal 2025) |
| Coverage, forward | Cash dividend payout ratio: 46% (fiscal 2026 consensus) | Distributable cash flow coverage: 1.50x (fiscal 2026 consensus) |
| Net debt/EBITDA (LTM) | 2.91x | 6.3x |
| Interest coverage (LTM) | 3.86x | 2.27x |
AT&T has plenty of room and no raises planned
AT&T’s growth comes from fiber and wireless. Its Advanced Connectivity service revenue rose 5.1% to $23.5 billion in the second quarter of 2026 from the same quarter a year earlier.
The dividend is well-covered. It took 45% of free cash flow over the 12 months to June 30, 2026, and takes 46% on fiscal 2026 consensus. That cushion came from a smaller dividend. Dividends paid fell from $15.1 billion in fiscal 2021 to $8.18 billion in fiscal 2025, and the cash dividend payout ratio fell from 57.0% to 42.1%.
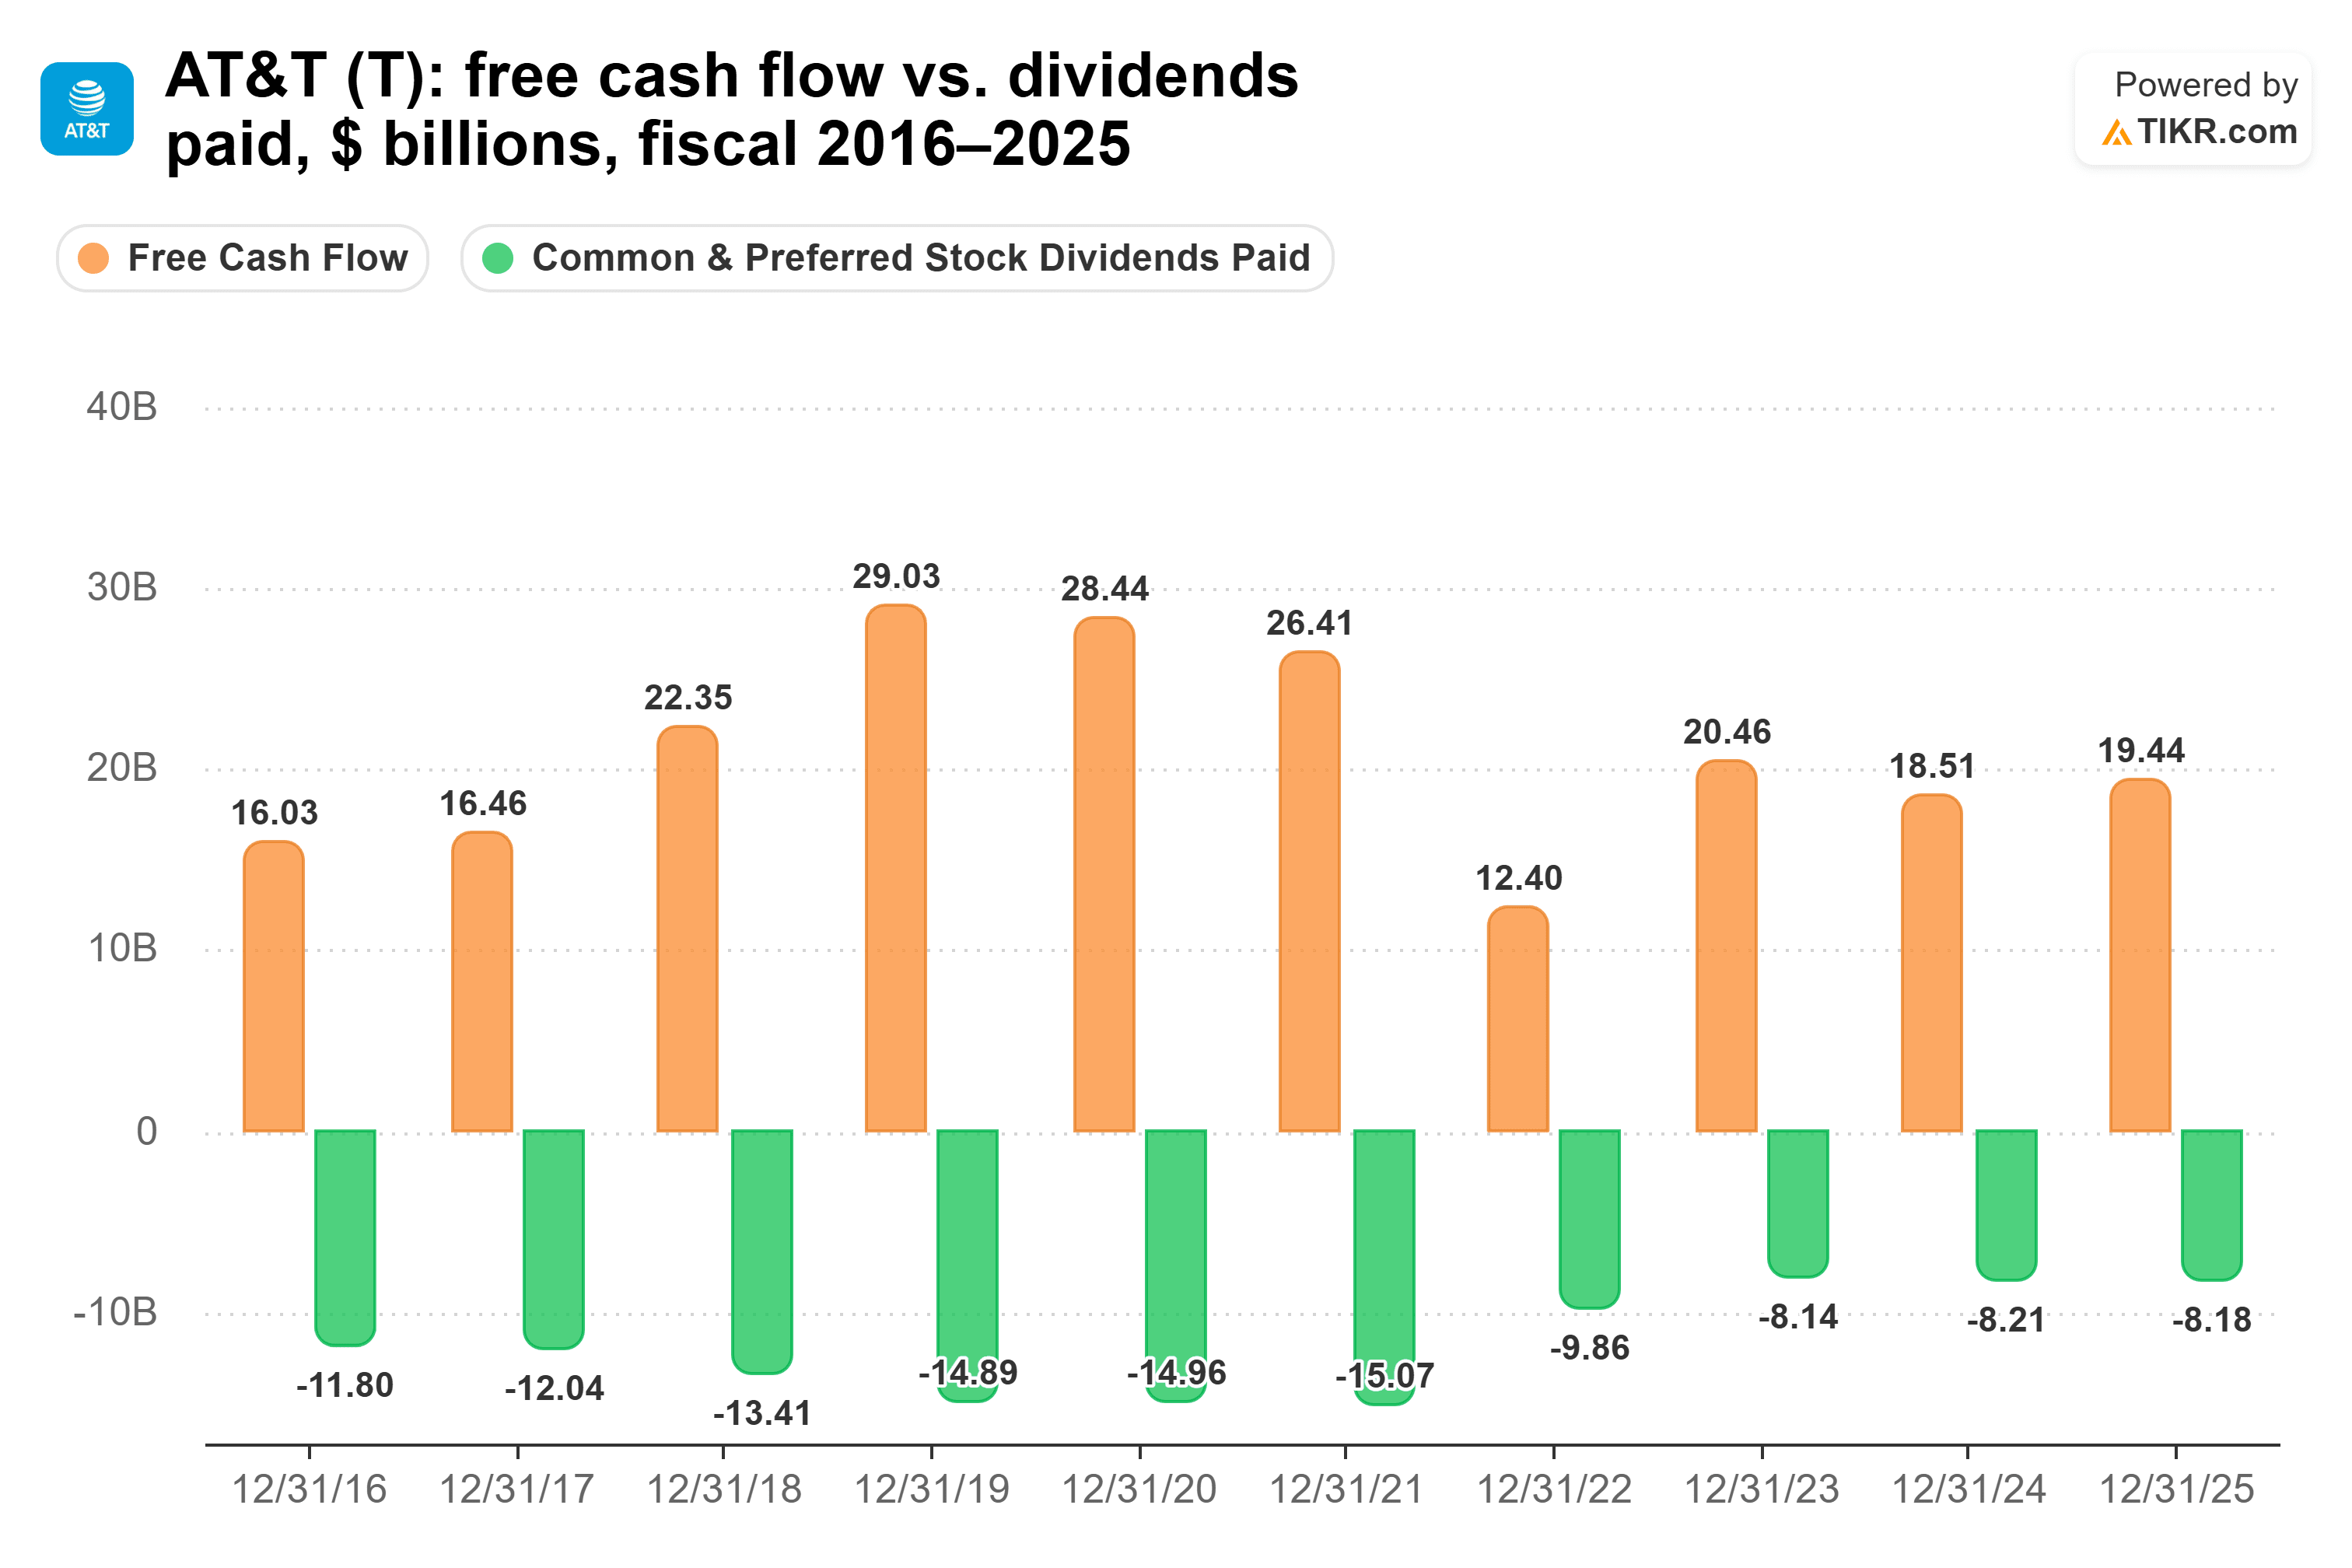
That’s also why AT&T’s 5-year dividend growth rate reads -11.8% a year, from $2.08 a share in fiscal 2020 to $1.11 in fiscal 2025.
AT&T expects dividends and buybacks to total about $18 billion in 2026. CEO John Stankey made the priority plain on the July call: “I’d like to buy more of it back because I think it’s incredibly undervalued.”
The risk is debt. AT&T expects its leverage to rise after its EchoStar deal closes, then return to its 2.5x target within about three years.
Enbridge keeps raising its dividend on more debt
AT&T is holding its dividend flat, while Enbridge raised its own in December 2025 for the 31st year in a row, by 3% to C$3.88 a share a year. Enbridge sets its dividend in Canadian dollars, so a US holder’s check moves with the exchange rate.
The cash behind that dividend is growing. Adjusted EBITDA rose to C$4.8 billion in the second quarter of 2026 from C$4.6 billion a year earlier. Distributable cash flow covered the dividend a comfortable 1.51x in fiscal 2025, and 1.50x on fiscal 2026 consensus.
Dividends per share rose from C$2.12 in fiscal 2016 to C$3.77 in fiscal 2025. Over the same years, distributable cash flow per share went from C$4.08 to C$5.71, which kept coverage between 1.44x and 1.92x.

A 3% raise leaves room under the roughly 5% a year growth CEO Greg Ebel is aiming for: “We will continue to add visibility to, and extend, our 5% growth outlook further into the future.”
The risk is leverage. By Enbridge’s own measure, debt was 5.1x EBITDA at the end of June, above its 4.5x-5.0x target range.
So which dividend wins?
Enbridge pays you more over the next 10 years, by a wide margin. Take each dividend at its pace now: AT&T’s is flat, and Enbridge’s rose 3.0% in fiscal 2025. At those rates, $10,000 in Enbridge pays about $6,880 over the decade, with its growth figured in Canadian dollars, against about $4,600 from AT&T. At each company’s 5-year rate, the gap is even wider: about $6,903 against $2,787.
Enbridge can likely keep up that pace, with distributable cash flow covering the dividend 1.5x.
AT&T’s dividend isn’t in trouble. It’s well-covered, its debt is far lighter, and management expects free cash flow to climb from $18 billion+ in 2026 to $21 billion+ in 2028. The catch is that AT&T is sending its extra cash to buybacks. For income, a bigger check that keeps rising beats a smaller one that holds still.
Of course, Enbridge still has to bring its debt back into its target range by the end of 2026. Its next raise will show whether the 3% pace holds.
So what is Enbridge stock actually worth?
TIKR lets you forecast the future price of any stock in less than a minute. Just enter a few assumptions into TIKR’s valuation model and see what Enbridge could be worth. Start from Wall Street consensus estimates, or adjust the inputs to reflect your own view of the business. It’s free to use.
Disclaimer:
Please note that the articles on TIKR are not intended to serve as investment or financial advice from TIKR or our content team, nor are they recommendations to buy or sell any stocks. We create our content based on TIKR Terminal’s investment data and analysts’ estimates. Our analysis might not include recent company news or important updates. TIKR has no position in any of the stocks mentioned. Thank you for reading, and happy investing!


