

Key Stats for Apollo Stock
- Current Price: $122.60
- Target Price (Mid): ~$250
- Street Target: ~$150
- Potential Total Return: ~102% over the next 4.5 years
- Annualized IRR: around 17% / year
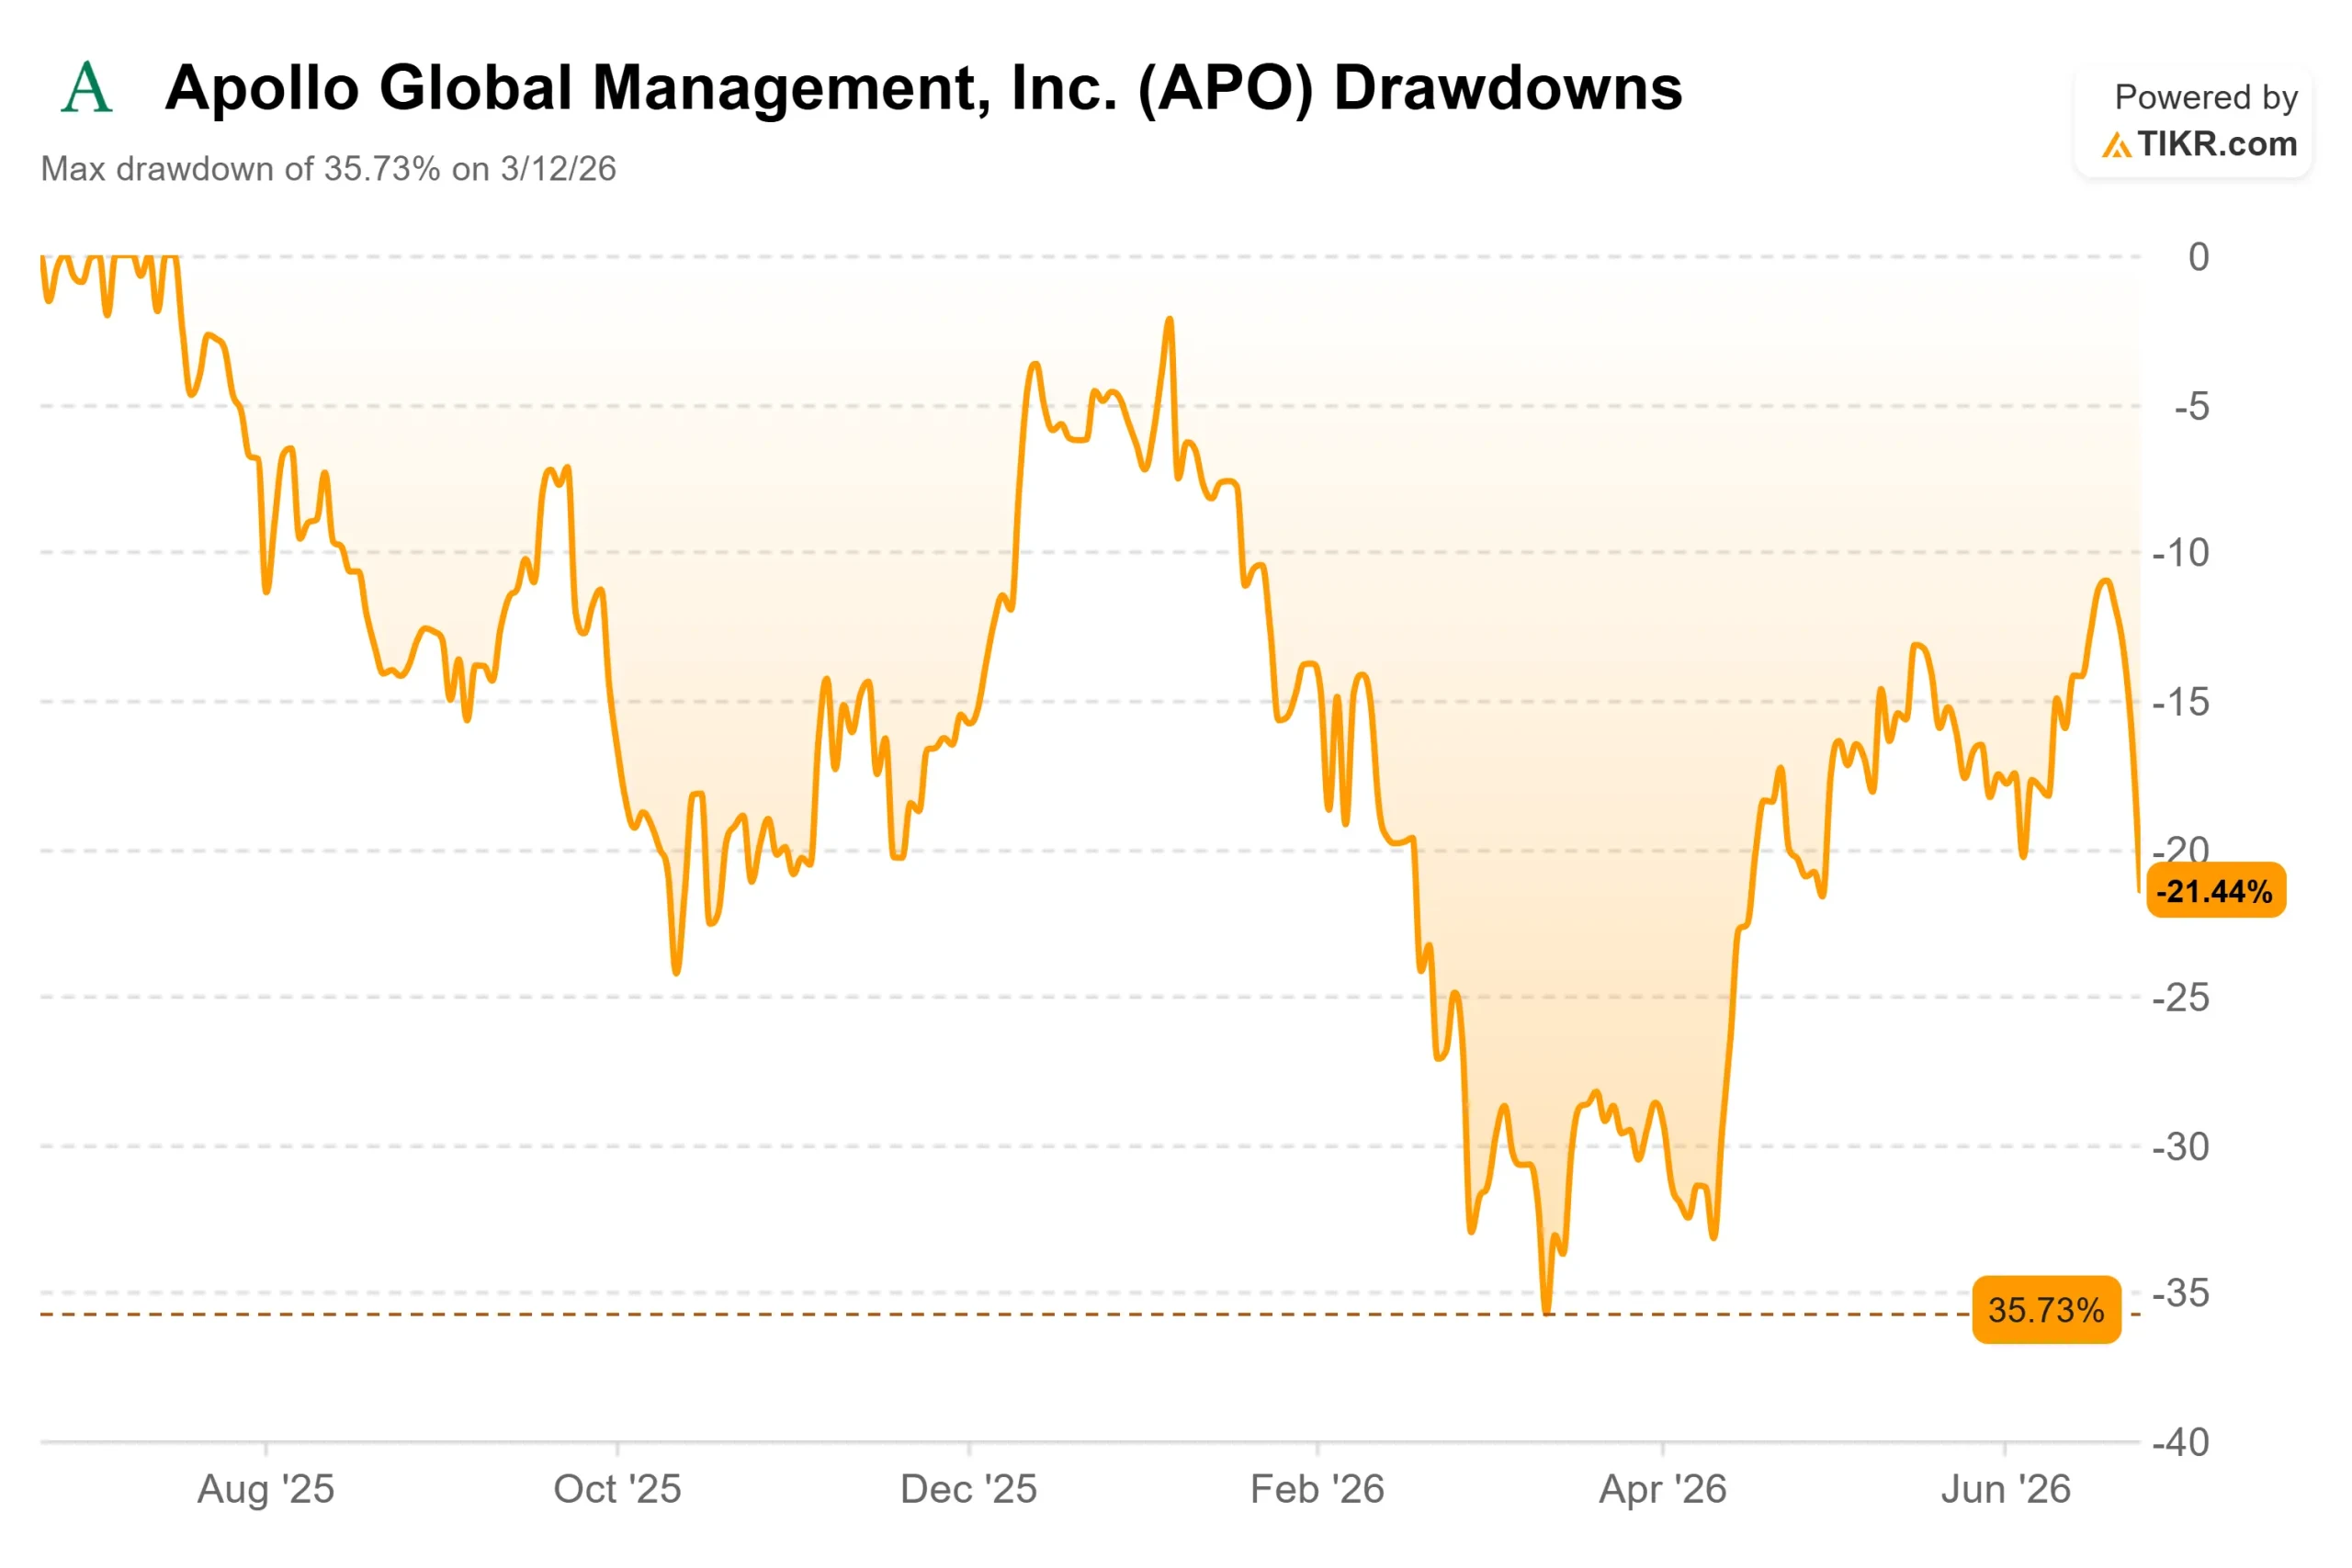
- Max Drawdown: -35.73% (March 12, 2026)
Now Live: Discover how much upside your favorite stocks could have using TIKR’s new Valuation Model (It’s free) >>>
What Happened?
Apollo Global Management (APO) just gave investors the one headline they least wanted to see twice in a row. For the second straight quarter, the firm capped withdrawals from its flagship retail private credit fund. Apollo stock fell 6.13% on June 24, 2026, closing at $122.60, an $8.01 drop in a single session.
One gate could be a one-off. A second gate, with even larger requests, reads like a pattern. That is the real story, and it is why the market reacted. The fight between bulls and bears is no longer about whether Apollo can survive a redemption wave. It is whether these gates signal something structurally wrong with retail private credit, or whether the fear has simply detached from a business still compounding earnings. The one thing the market cannot yet answer is how long the outflows last.
What Actually Happened
On June 22, Apollo Debt Solutions told shareholders it would limit quarterly redemptions to 5% of outstanding shares. Investors had requested to pull roughly 16.8% of the fund, around $2.4 billion. Apollo Debt Solutions, or ADS, is the firm’s roughly $26 billion business development company, the main vehicle it uses to bring retail wealth clients into private credit.
The detail that spooked the market was the trajectory. Last quarter’s requests came in at 11.2%. This quarter, they jumped to 16.8%. The pressure was also lopsided: onshore U.S. requests moderated to about 4.3%, while offshore investors asked to pull roughly 12.5%. The wave is accelerating, and international clients are driving it. Apollo has held its 5% cap steady through both quarters, framing the discipline as protecting long-term fund investors rather than a sign of distress.
See historical and forward estimates for Apollo stock (It’s free!) >>>
Why Management Says the Structure Is Working
The most direct rebuttal to the bear case came two weeks before the gate. At the Morgan Stanley US Financials Conference on June 10, John Zito, Co-President of Apollo Asset Management, addressed the pressure head-on.
“Redemptions are high right now. There’s no way to hide from that,” Zito said. But he argued the structure is doing its job. He walked through the logic: a fund with deep liquidity, assets whose income matches the distribution yield, and an average asset life of 3.5 years matched against a 3.5-year liability structure. “For credit, it’s a really actually appropriate structure,” he said.
That reframes the gate. A redemption cap is not a fund freezing because it cannot pay. It is a fund deliberately throttling outflows to avoid dumping assets at bad prices, the exact failure mode the structure exists to prevent. As Zito put it, despite the pressure, “there’s been no run. There’s been no SVB. There’s been no financial institutions failing.” He was also candid that the pain is not over, warning redemptions could rise further if investors try to “game the system” by front-running the limits. That honesty is part of why June 24 was a controlled 6% rather than a panic. The market is repricing a known headwind, not discovering a new one.
The Part of Apollo the Redemptions Don’t Touch
ADS is the visible, retail-facing slice of Apollo. It is not the engine. That engine is Athene, the retirement services subsidiary, which provides permanent long-duration capital structurally separate from retail redemptions. Policyholders cannot click “redeem” the way a wealth client can.
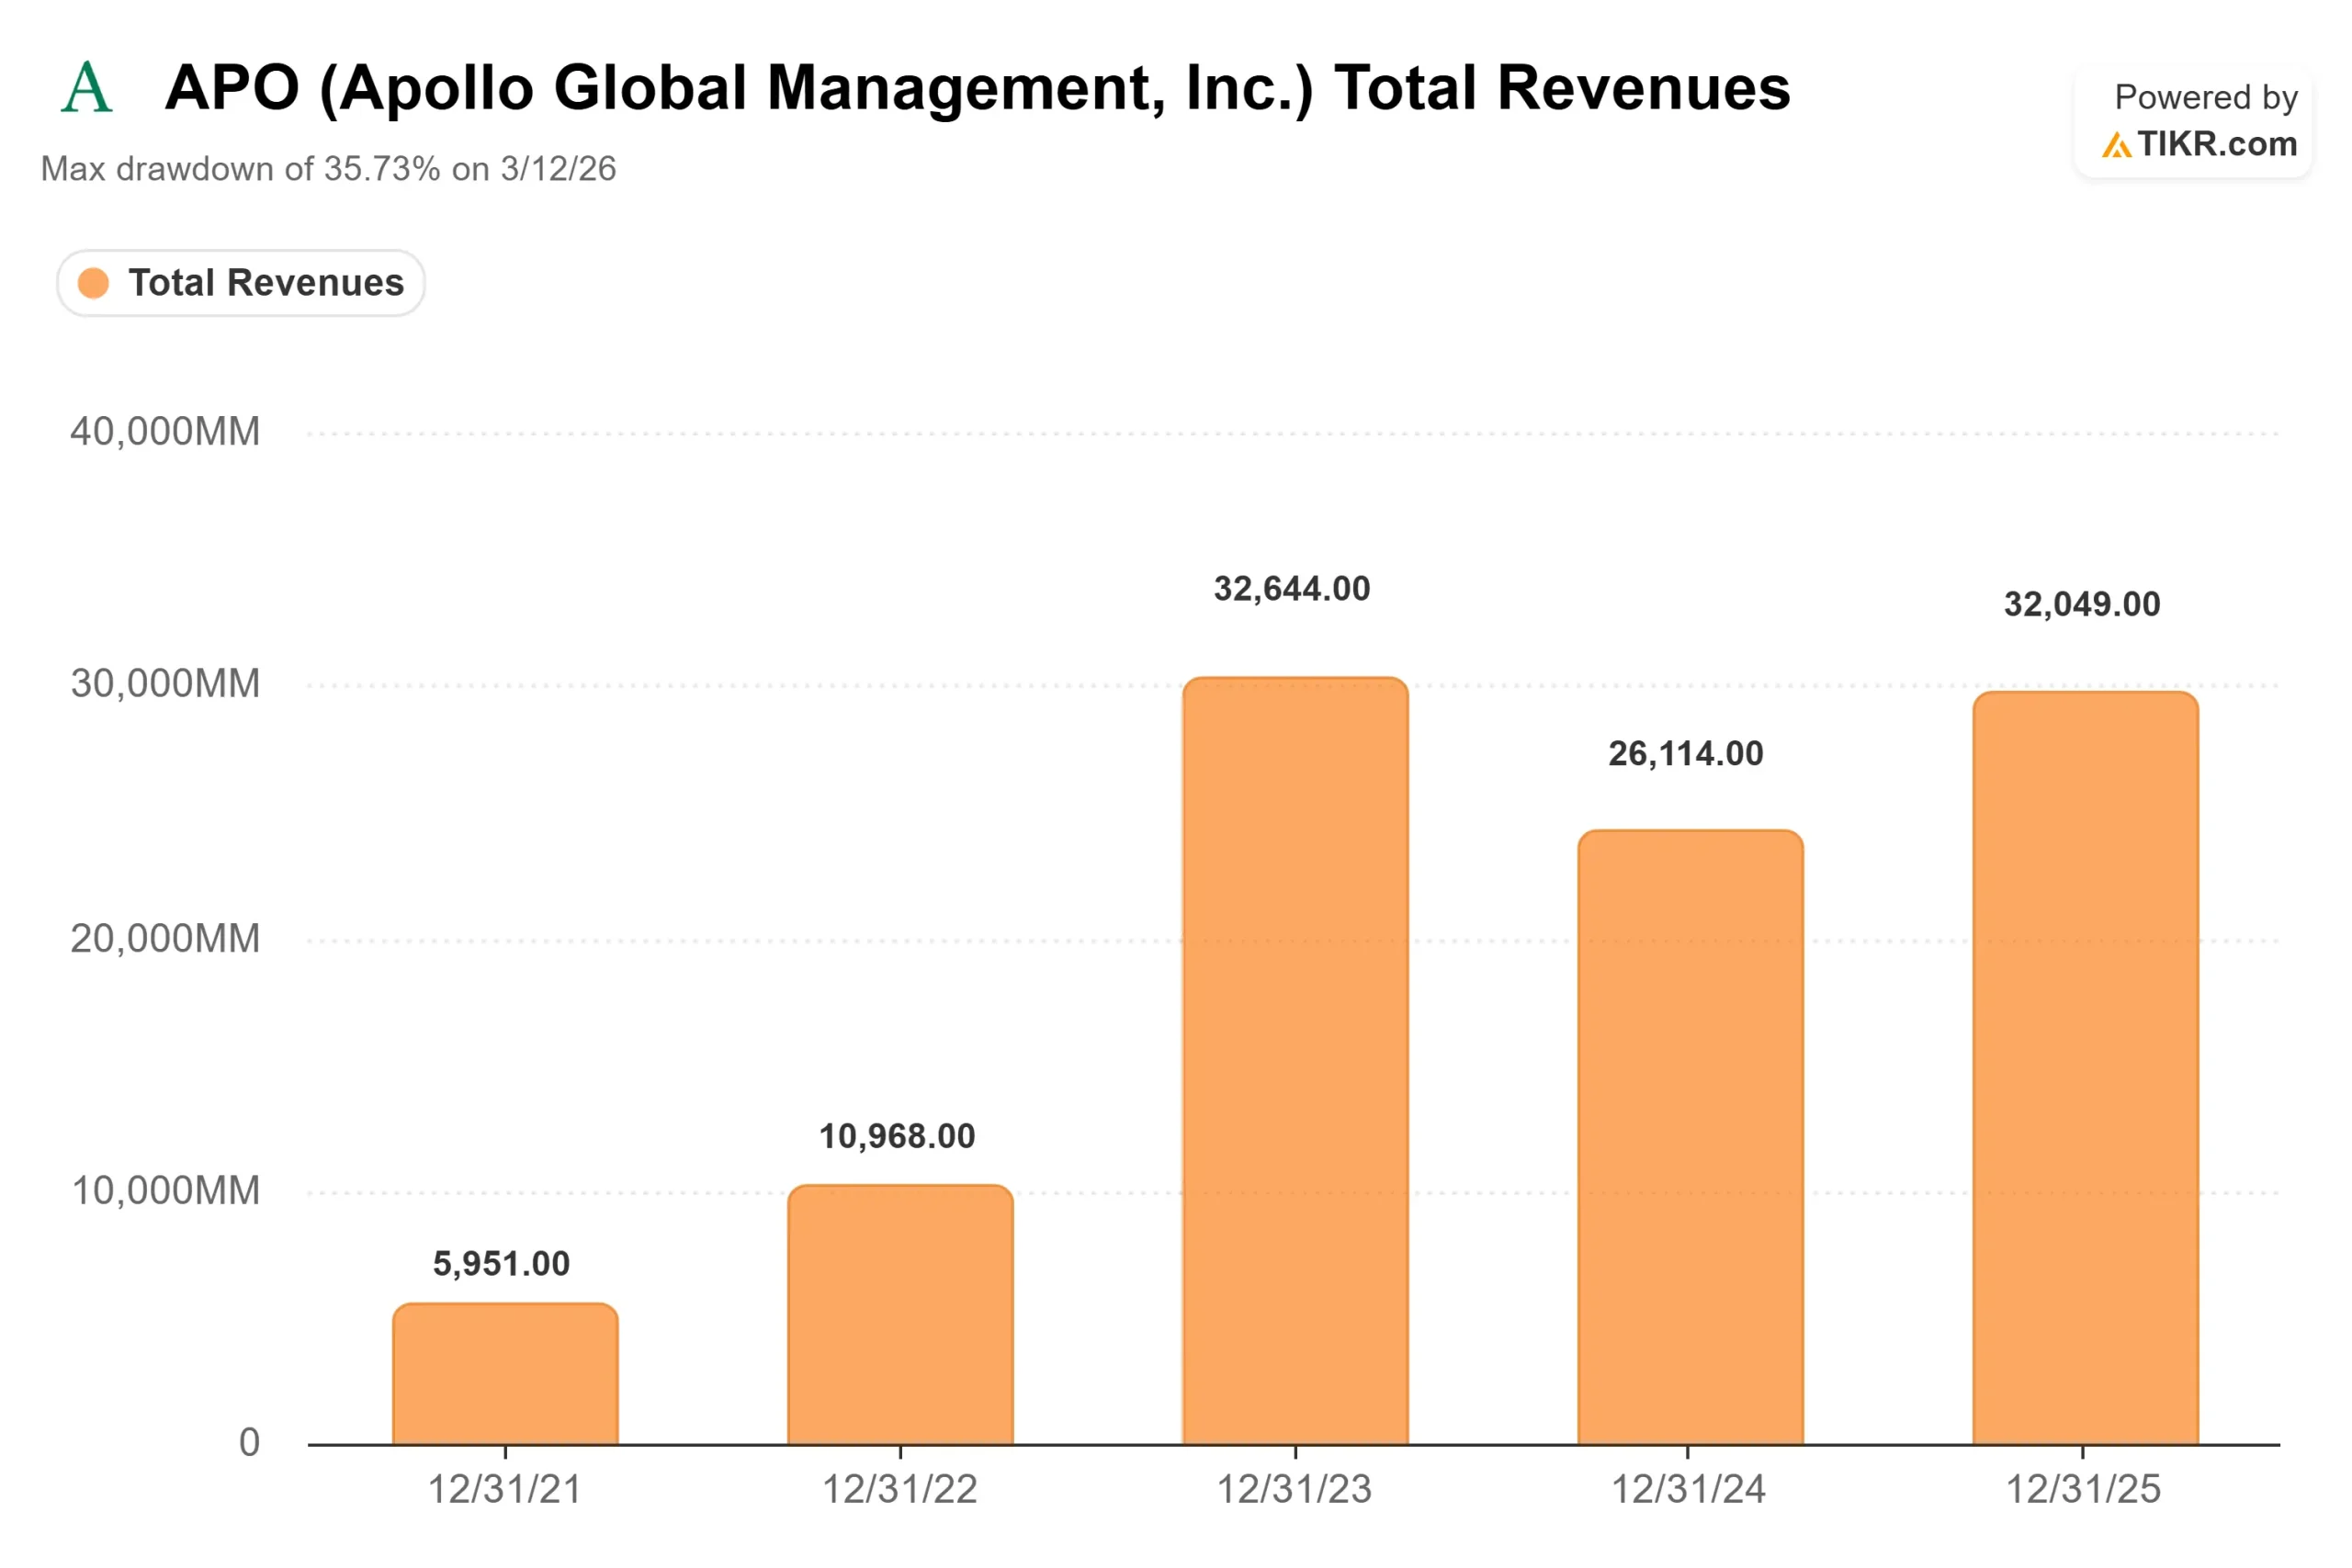
Q1 2026 showed how the two halves diverge. In its May 6 earnings report, Apollo posted record fee-related earnings (FRE, the recurring management fees Apollo earns from its funds) of $728 million, up 30% year over year, as assets under management crossed $1 trillion. Management reaffirmed full-year guidance for 20%-plus FRE growth. So the firm reporting record fee earnings and the firm gating a retail fund are the same firm, and the market is currently weighing the gate more heavily.
The broader weather matters too. The SEC’s 2026 exam priorities put heightened scrutiny on private credit, fiduciary duty, and valuation practices across the whole industry, not Apollo specifically. It adds to the cloud over the wealth channel that the multiple is reacting to.
See how Apollo performs against its peers in TIKR (It’s free!) >>>
Valuation: What the Discount Is Pricing
At $122.60, Apollo trades at an NTM P/E (next twelve months price-to-earnings) of 12.90x. For a business that grew revenue 22.3% last year, with TIKR data showing forward two-year revenue growth near 19%, that is a compressed multiple by Apollo’s own history. The gap is the price of the legal and redemption overhang, not a verdict on earnings.
The Street has not capitulated. The mean analyst target of $150.38 sits roughly 23% above the current price, built on 10 Buys, 3 Outperforms, and 6 Holds, with no Underperforms or Sells. Analysts trimmed the high end through 2026, with the top target easing from $214 in early 2025 to $173 now, but the recommendation mix stayed constructive. That points to a discounted compounder, not a broken one.
The honest tension is simple. If the redemption wave keeps accelerating and bleeds into institutional confidence or fundraising, the discount is justified and could deepen toward the $99.56 low from March. If the gates are the wealth channel doing exactly what Zito described, a controlled throttling of a small slice of the platform, then sub-13x earnings on a business compounding fees at 20% is the opportunity. The data leans toward the latter. The catalyst that settles it has not arrived.
TIKR Advanced Model Analysis
- Current Price: $122.60
- Target Price (Mid): ~$250
- Potential Total Return: ~102% over the next 4.5 years
- Annualized IRR: ~17% / year

See analysts’ growth forecasts and price targets for Apollo stock (It’s free!) >>>
Two engines drive the target: continued fee-related earnings growth in asset management, where management guides to 20%-plus, and spread income compounding at Athene as origination keeps feeding its balance sheet. The main margin driver is spread-related earnings at Athene. The upside case is that redemption pressure proves contained, fundraising holds, and the multiple re-rates as the legal overhang clears. The downside case is that outflows reach the institutional channel or a legal development reignites the discount, pushing the stock back toward its March low. The single biggest risk is that retail private credit stress stops being a sentiment story and starts denting actual FRE growth.
Conclusion
The number to watch is the next ADS redemption print, and the next read comes with Apollo’s Q2 2026 earnings on July 30. Zito already defined bad: requests climbing above this quarter’s 16.8% would confirm the wave is still building. Good looks like the request rate flattening, with the onshore moderation holding and the offshore spike cooling. If FRE growth stays on its 20%-plus track and redemptions stop climbing, June will look like a sentiment-driven discount on a compounder. If they accelerate into fundraising, the bears will have earned their caution. July 30 starts to answer it.
See what stocks billionaire investors are buying so you can follow the smart money with TIKR.
Should You Invest in Apollo?
The only way to really know is to look at the numbers yourself. TIKR gives you free access to the same institutional-quality financial data that professional analysts use to answer exactly that question.
Pull up Apollo, and you’ll see years of historical financials, what Wall Street analysts expect for revenue and earnings in the quarters ahead, how valuation multiples have moved over time, and whether price targets are trending up or down.
You can build a free watchlist to track Apollo alongside every other stock on your radar. No credit card required. Just the data you need to decide for yourself.
Looking for New Opportunities?
- See what stocks billionaire investors are buying so you can follow the smart money.
- Analyze stocks in as little as 5 minutes with TIKR’s all-in-one, easy-to-use platform.
- The more rocks you overturn… the more opportunities you’ll uncover. Search 100K+ global stocks, global top investor holdings, and more with TIKR.
Disclaimer:
Please note that the articles on TIKR are not intended to serve as investment or financial advice from TIKR or our content team, nor are they recommendations to buy or sell any stocks. We create our content based on TIKR Terminal’s investment data and analysts’ estimates. Our analysis might not include recent company news or important updates. TIKR has no position in any stocks mentioned. Thank you for reading, and happy investing!


