Building a dividend portfolio is a commitment to long-term wealth, where the true goal is a growing income stream that consistently outpaces inflation. Success, however, requires looking past current yield to the underlying business health that sustains those payouts. A high yield is meaningless if it isn’t backed by consistent earnings and cash flow growth.
Historically, tracking dividend history meant maintaining complex spreadsheets and manually scrubbing through years of annual reports to verify payout safety. Today, the challenge isn’t accessing the data, it’s filtering out the noise to see the true trend. Investors need a way to instantly visualize whether a company’s dividend growth is supported by rising earnings or if it is becoming an unsustainable burden on the company’s capital.
The right tools allow you to focus on the metrics that define sustainable payouts: earnings per share, payout ratios, free cash flow, and shares outstanding. By observing how a company managed its dividend through past market cycles, you gain confidence in projecting its future performance. The following five platforms help you organize that financial history into a coherent narrative of durability and compounded growth.
Review the dividend history of thousands of stocks with TIKR (It’s free) >>>
1. TIKR
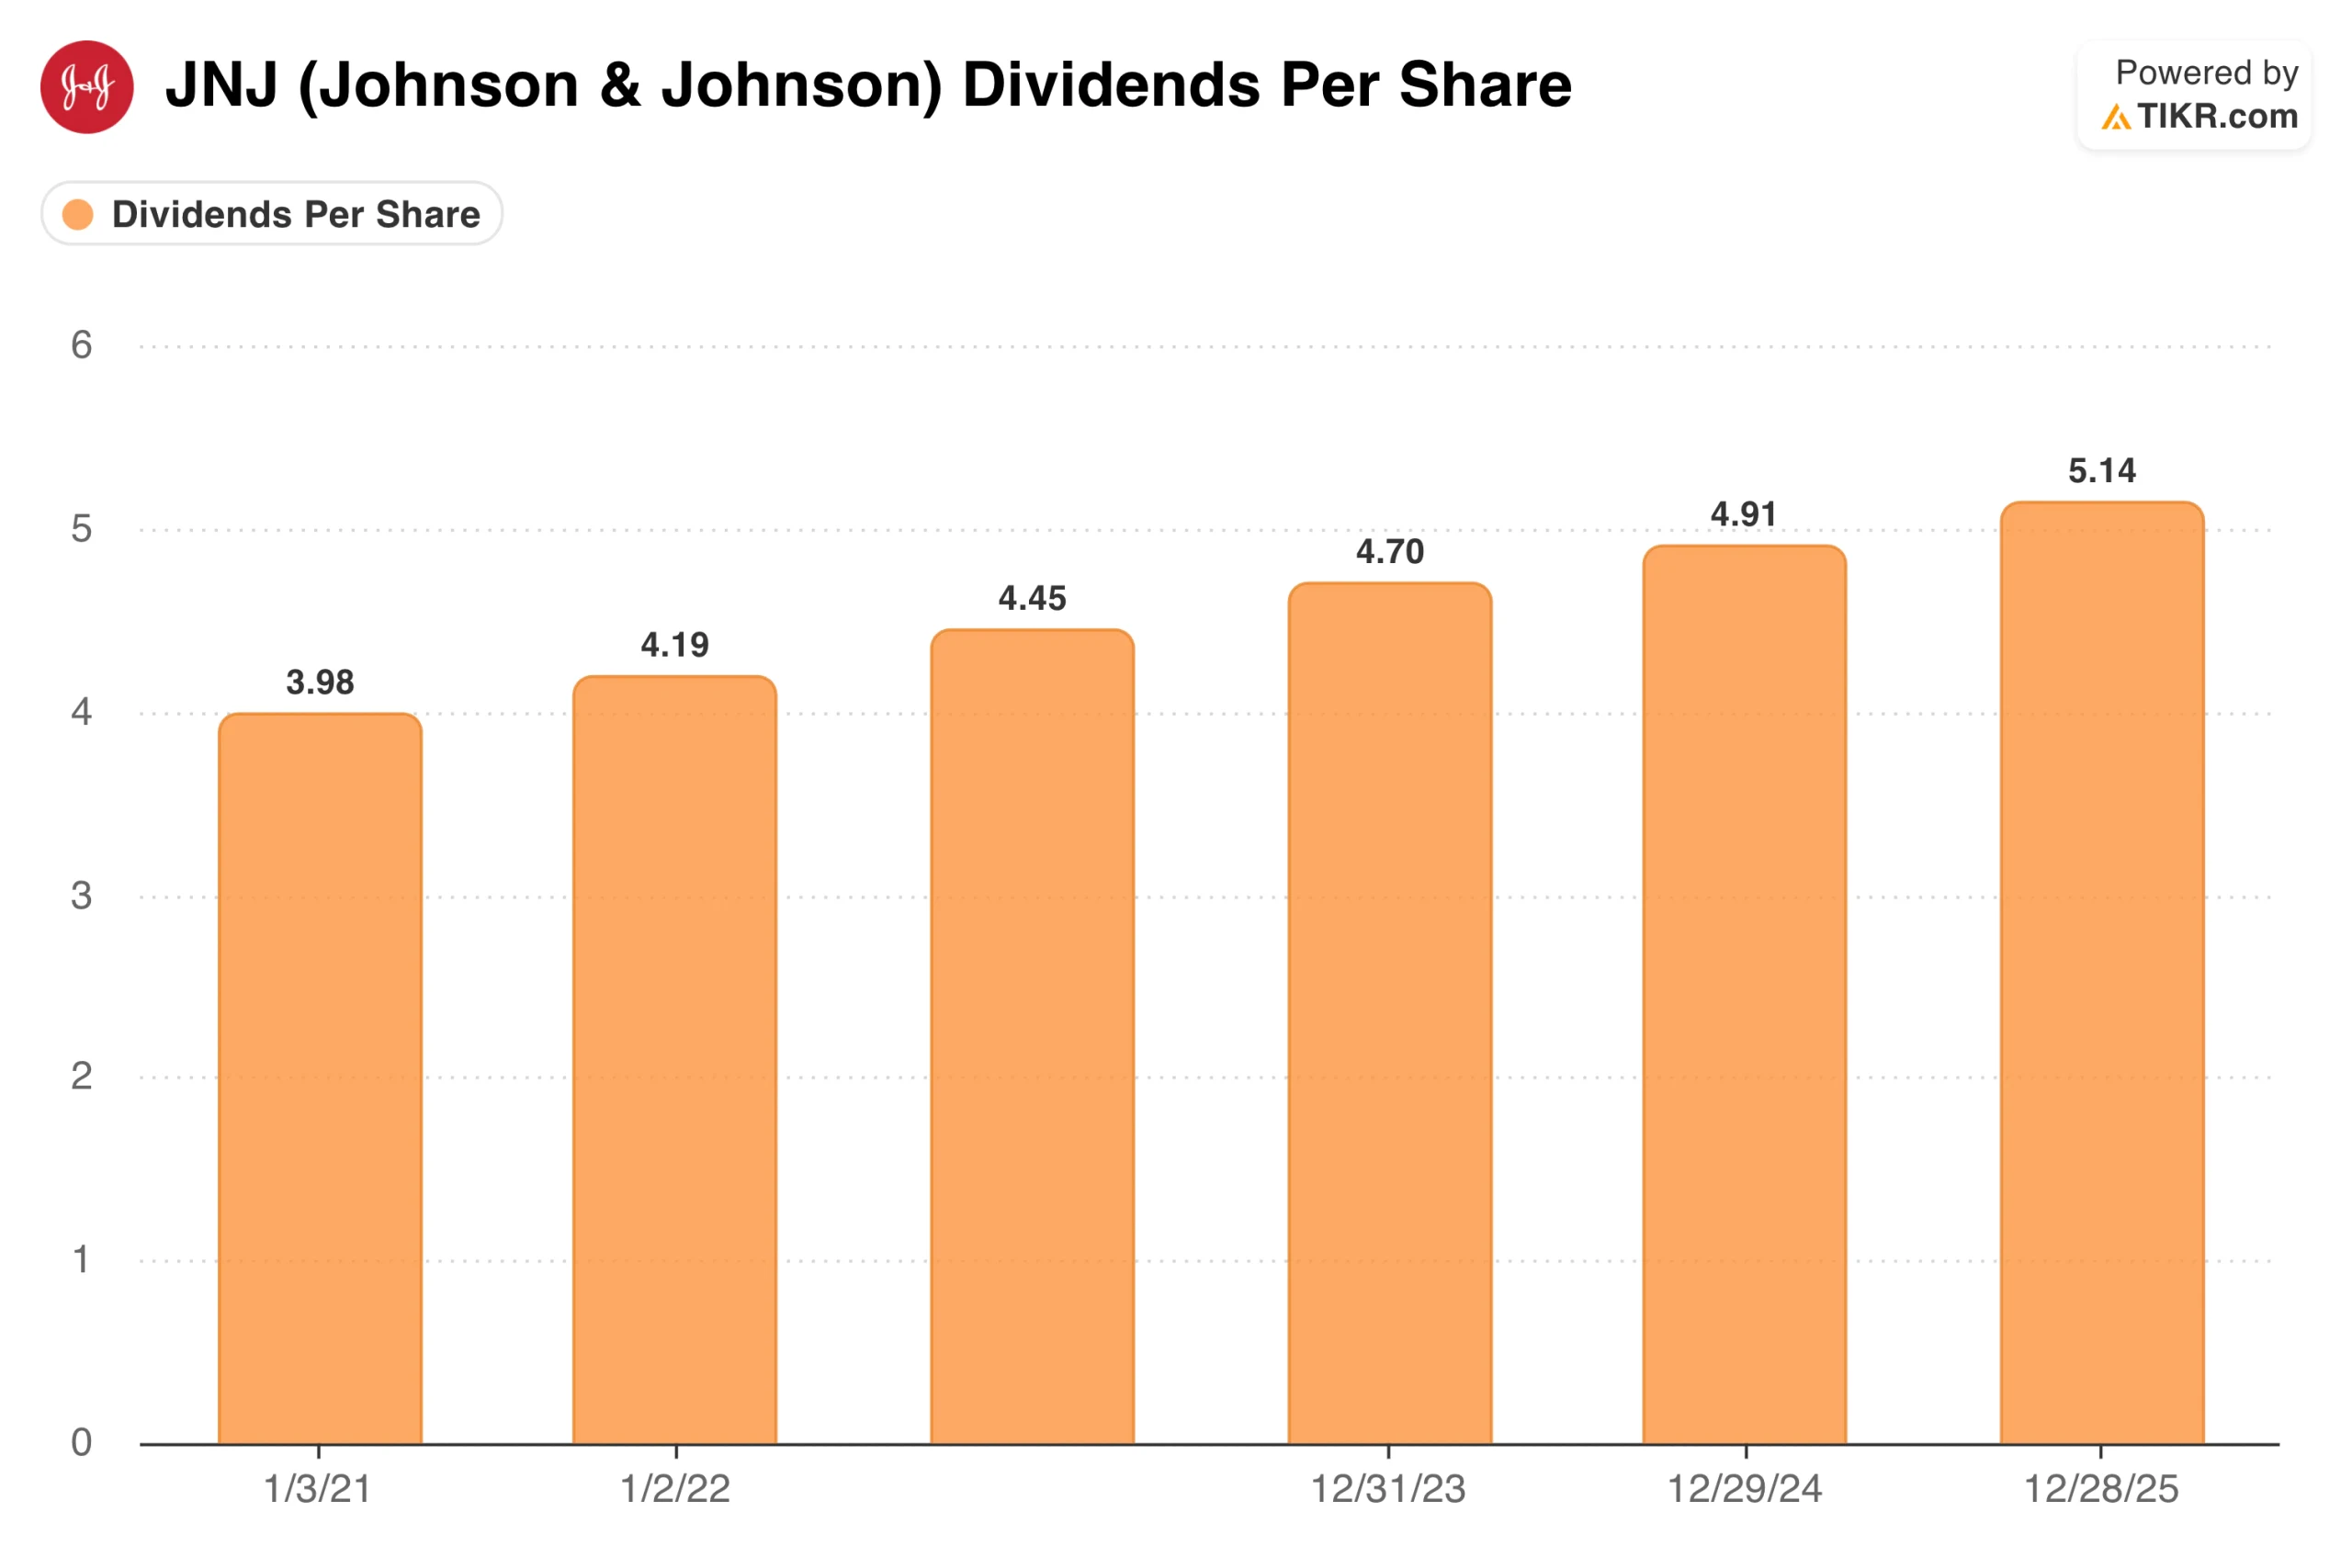
TIKR is the primary choice for investors who want to see the complete financial story behind a dividend. While most tools just show you the payment history, TIKR lets you view dividends alongside 15+ years of detailed financial statements for over 100,000 global stocks.
This depth is essential because it shows how much of a company’s free cash flow is consumed by dividends over a long period.
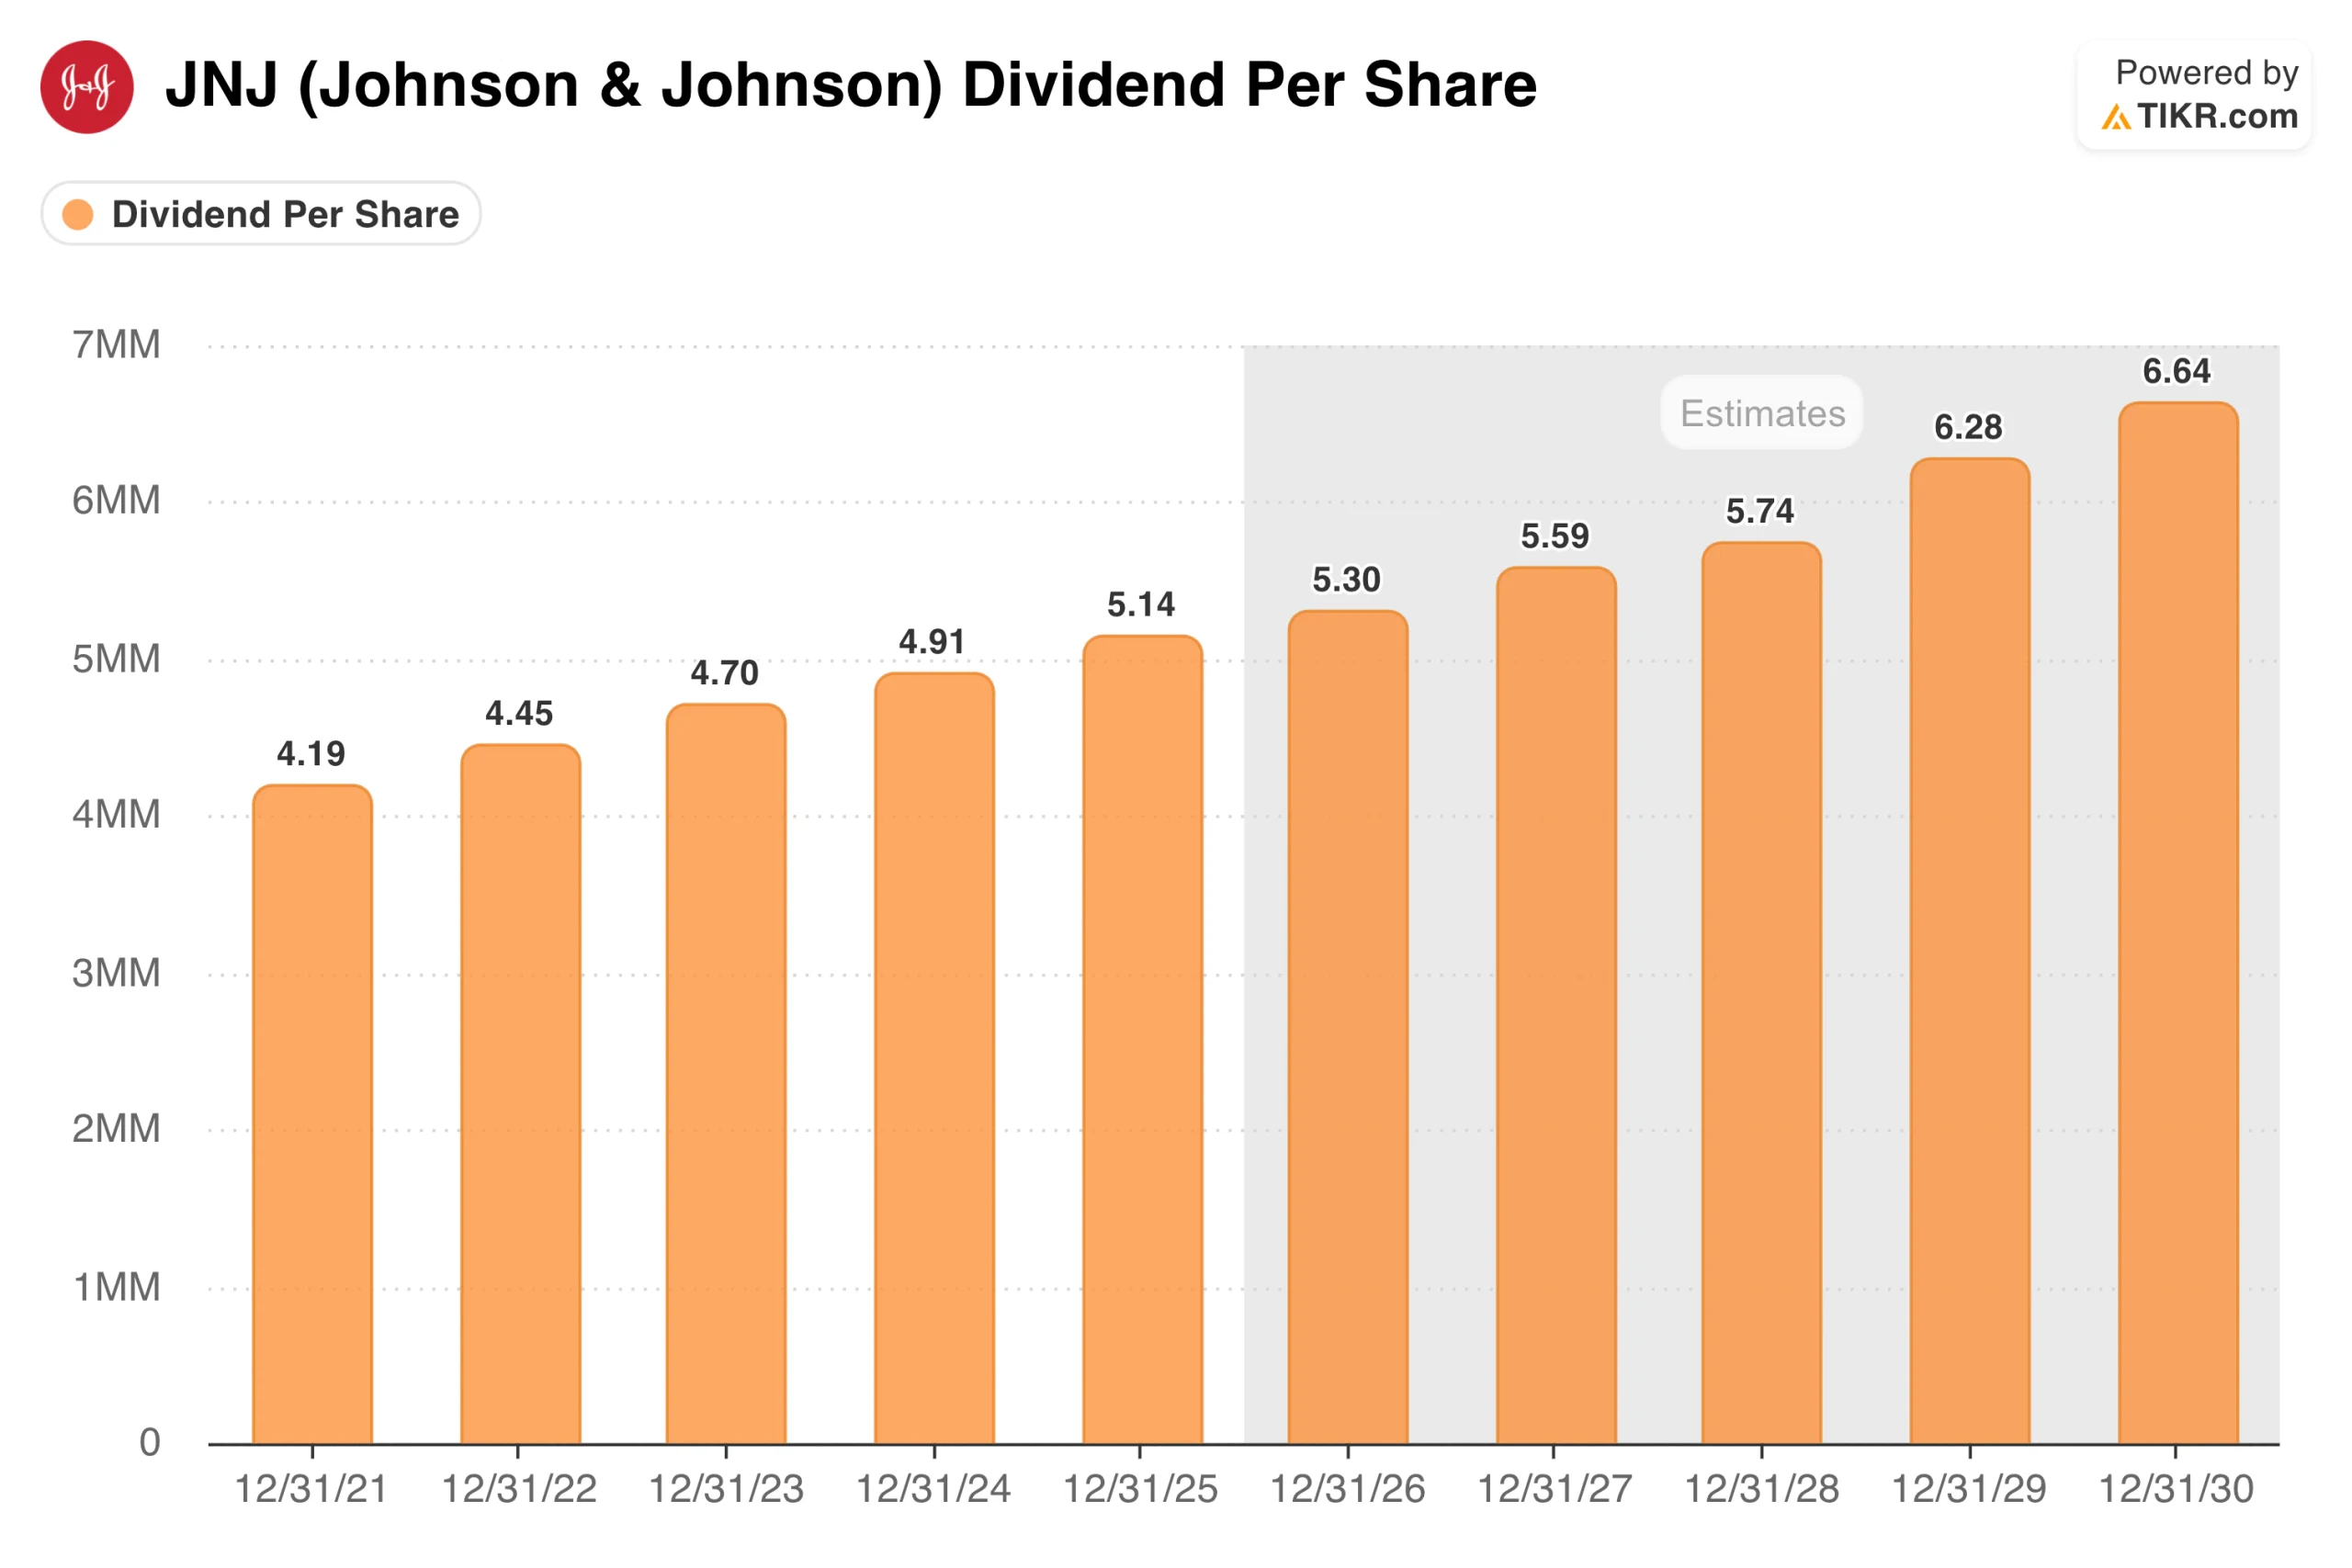
The platform includes automated multi-year models that help you project how future earnings growth might impact the potential for dividend increases. You can track specific metrics, such as the dividend payout ratio and shares outstanding, in a single view, ensuring that management is not funding dividends through debt or excessive share issuance.

Beyond historical trends, TIKR allows you to plot Dividends per Share against Earnings Per Share (EPS) to visually verify dividend coverage and payout safety. You can also track the Annual Dividend Growth Rate to see if the company is compounding payouts faster than its underlying earnings growth. Furthermore, the platform provides access to forward-looking analyst estimates for future dividends, allowing you to gauge Wall Street’s expectations for payout sustainability before they are officially declared.
For those who follow companies outside the US, TIKR’s global coverage ensures you have access to the same high-quality dividend data for international markets that is often restricted to premium users elsewhere.
2. Dividend.com

Dividend.com is a specialized resource that focuses entirely on income investing. Its main strengths are a dividend assistant tool and a proprietary ranking system that scores stocks based on dividend reliability and growth potential. It provides a clear view of how many consecutive years a company has increased its payout, which is a key metric for those seeking “Dividend Aristocrats” or “Kings.”
The free version of the site offers a solid overview of upcoming ex-dividend dates and historical growth rates. While it lacks the deep, fundamental financial statements found on more comprehensive platforms, it is an excellent quick reference for investors who want to double-check a company’s track record of payout consistency.
3. Seeking Alpha

Seeking Alpha provides a dedicated “Dividends” tab for almost every U.S.-listed stock, offering a clean visualization of payout history. You can quickly see a company’s dividend yield, its future growth rate, and its payout ratio. The platform also includes a “Dividend Grade” feature that summarizes safety and growth prospects based on historical data.
Beyond the raw numbers, the platform is valuable because it hosts community-driven analysis where other investors debate the sustainability of specific payouts. This qualitative layer helps you understand if a recent dividend hike was a one-time event or part of a broader, sustainable trend.
4. DripInvesting.org
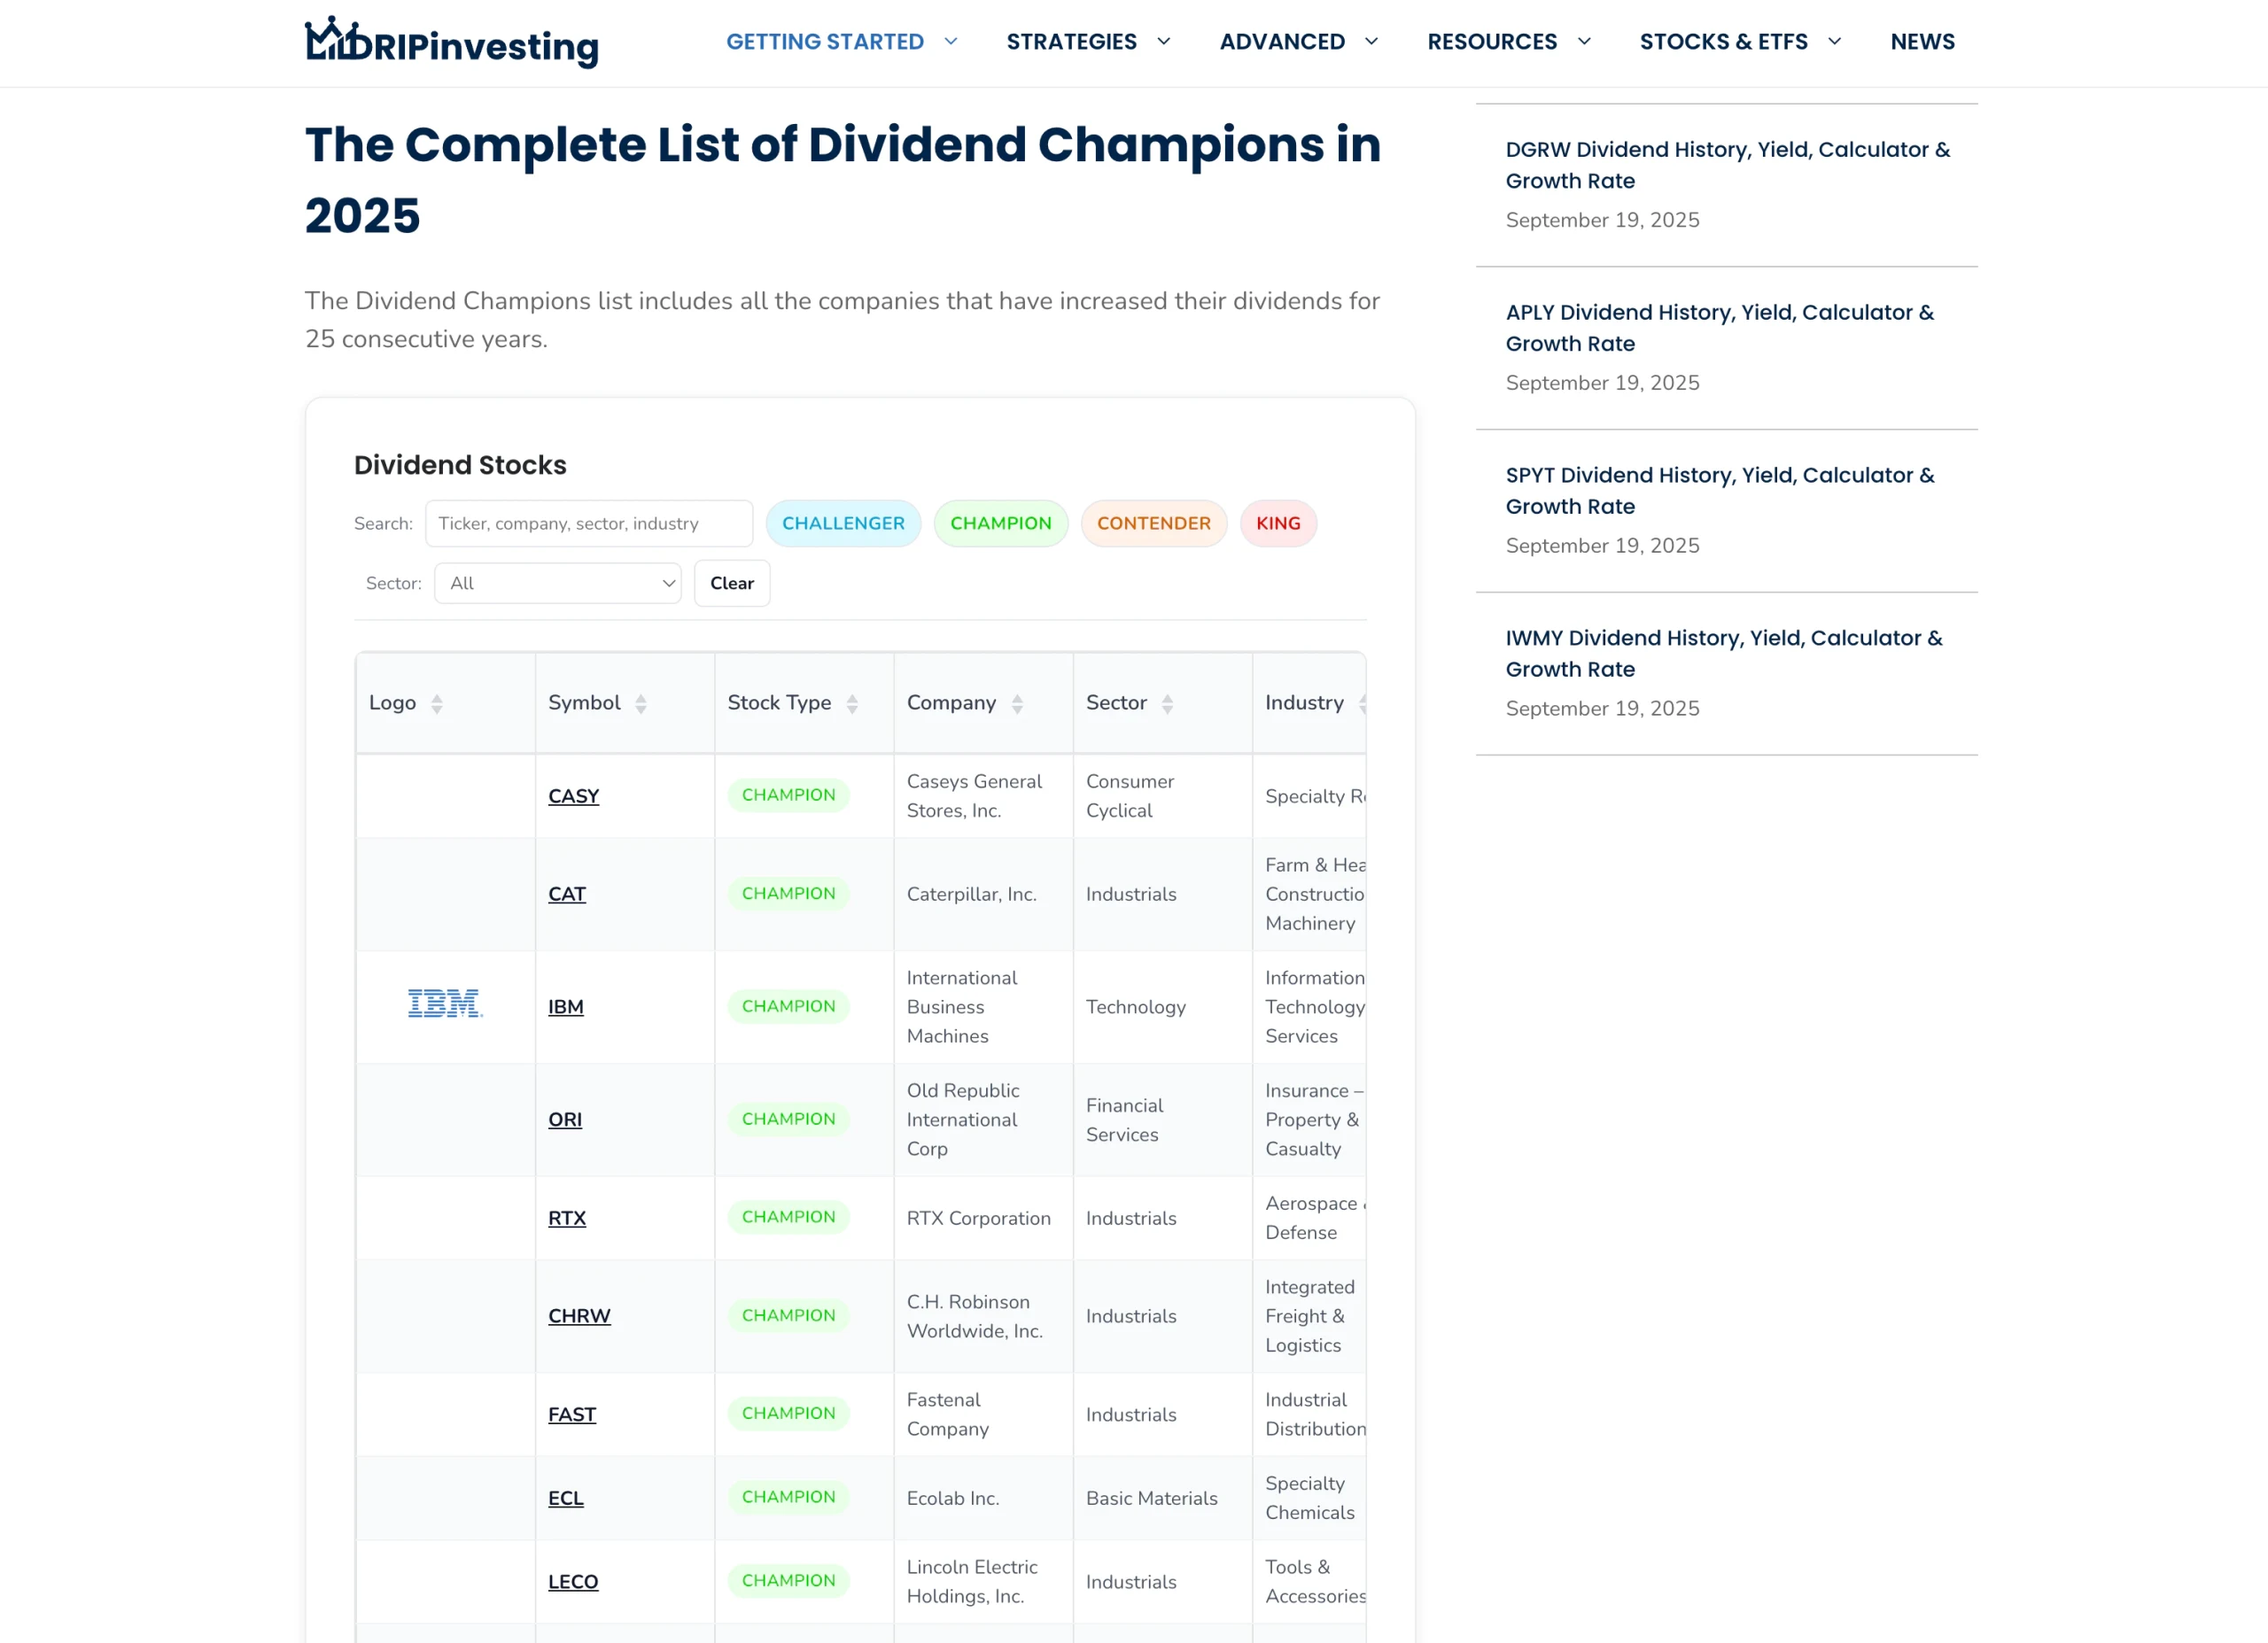
For the traditionalist, DripInvesting.org is home to the “U.S. Dividend Champions” spreadsheet, a legendary community-maintained resource. This downloadable Excel file contains every US stock with a multi-year streak of dividend increases. It is an incredible raw data set for those who prefer to sort and filter offline.
The spreadsheet includes detailed metrics such as the multiple-year dividend growth rates. And, because it is a community project, it is completely free, though it lacks the interactive charts and real-time updates found on modern web platforms. It remains a foundational tool for serious income researchers who value historical accuracy.
5. TrackYourDividends

TrackYourDividends is a specialized portfolio tracker designed specifically for income-focused investors. You can link your brokerage account or manually enter your holdings to see a dashboard of your total annual income, monthly payout schedule, and projected future growth. It provides a “Dividend Safety Score” for each position to help you identify potential cuts before they happen.
The free tier lets you monitor a basic portfolio and see how your income is diversified across sectors. It is particularly helpful for visualizing the “snowball effect” of reinvested dividends, making it a great motivational tool for those in the accumulation phase of their journey.
Review dividend data for thousands of stocks in less than 60 seconds with TIKR (It’s free) >>>
TIKR Takeaway
Tracking a dividend’s history is only half the battle; the other half is understanding the business’s ability to keep paying it.
TIKR bridges this gap by providing 15 plus years of global financial data alongside every transcript and analyst estimate. By housing global dividend data and professional-grade valuation tools in one place, TIKR removes the need for multiple subscriptions and fragmented research.
You can monitor dividend payout ratios, track management’s commentary on capital allocation, and model future scenarios to ensure your income stream is durable. For the investor who prioritizes quality and discipline, TIKR is the most effective platform for building a resilient dividend growth portfolio.
Value Any Stock in Under 60 Seconds with TIKR
With TIKR’s new Valuation Model tool, you can estimate a stock’s potential share price in under a minute.
All it takes is three simple inputs:
- Revenue Growth
- Operating Margins
- Exit P/E Multiple
If you’re not sure what to enter, TIKR automatically fills in each input using analysts’ consensus estimates, giving you a quick, reliable starting point.
From there, TIKR calculates the potential share price and total returns under Bull, Base, and Bear scenarios so you can quickly see whether a stock looks undervalued or overvalued.
See a stock’s true value in under 60 seconds (Free with TIKR) >>>
Looking for New Opportunities?
- Discover which stocks billionaire investors are purchasing, so you can follow the smart money.
- Analyze stocks in as little as 5 minutes with TIKR’s all-in-one, easy-to-use platform.
- The more rocks you overturn… the more opportunities you’ll uncover. Search 100K+ global stocks, global top investor holdings, and more with TIKR.
Disclaimer:
Please note that the articles on TIKR are not intended to serve as investment or financial advice from TIKR or our content team, nor are they recommendations to buy or sell any stocks. We create our content based on TIKR Terminal’s investment data and analysts’ estimates. Our analysis might not include recent company news or important updates. TIKR has no position in any stocks mentioned. Thank you for reading, and happy investing!