Key Stats for Union Pacific Stock
- 52-Week Range: $210.84 – $315.99
- Current Price: $293.13
- Street Mean Target: $328.75
- TIKR Model Target (Mid): ~$390
- Q2 2026 Adjusted EPS: $3.41 (beat by ~7%)
- LTM EBIT Margin: 40.8%
- LTM Net Debt/EBITDA: 2.20x
- Dividend Yield: 2.0%
Now Live: Discover how much upside your favorite stocks could have using TIKR’s new Valuation Model (It’s free)>>>
A Railroad That Just Keeps Delivering
There is a version of the Union Pacific (UNP) story that sounds almost boring: a 160-year-old freight railroad, moving grain and chemicals and intermodal containers across 32,000 miles of track through the American West. Not exactly the kind of business that generates headlines.
And yet the stock is up 26% year to date, the company just posted record quarterly revenue, raised its full-year earnings outlook, and paid down $1.5 billion in long-term debt in the first half of the year alone. Sometimes boring is exactly what you want.
The spring gave investors a brief moment of doubt. Tariff fears in March and April rattled railroad stocks broadly, with concerns that a slowdown in trade volumes would hit freight demand hard. Union Pacific sold off with the rest of the sector before Q2 results made the picture clear.
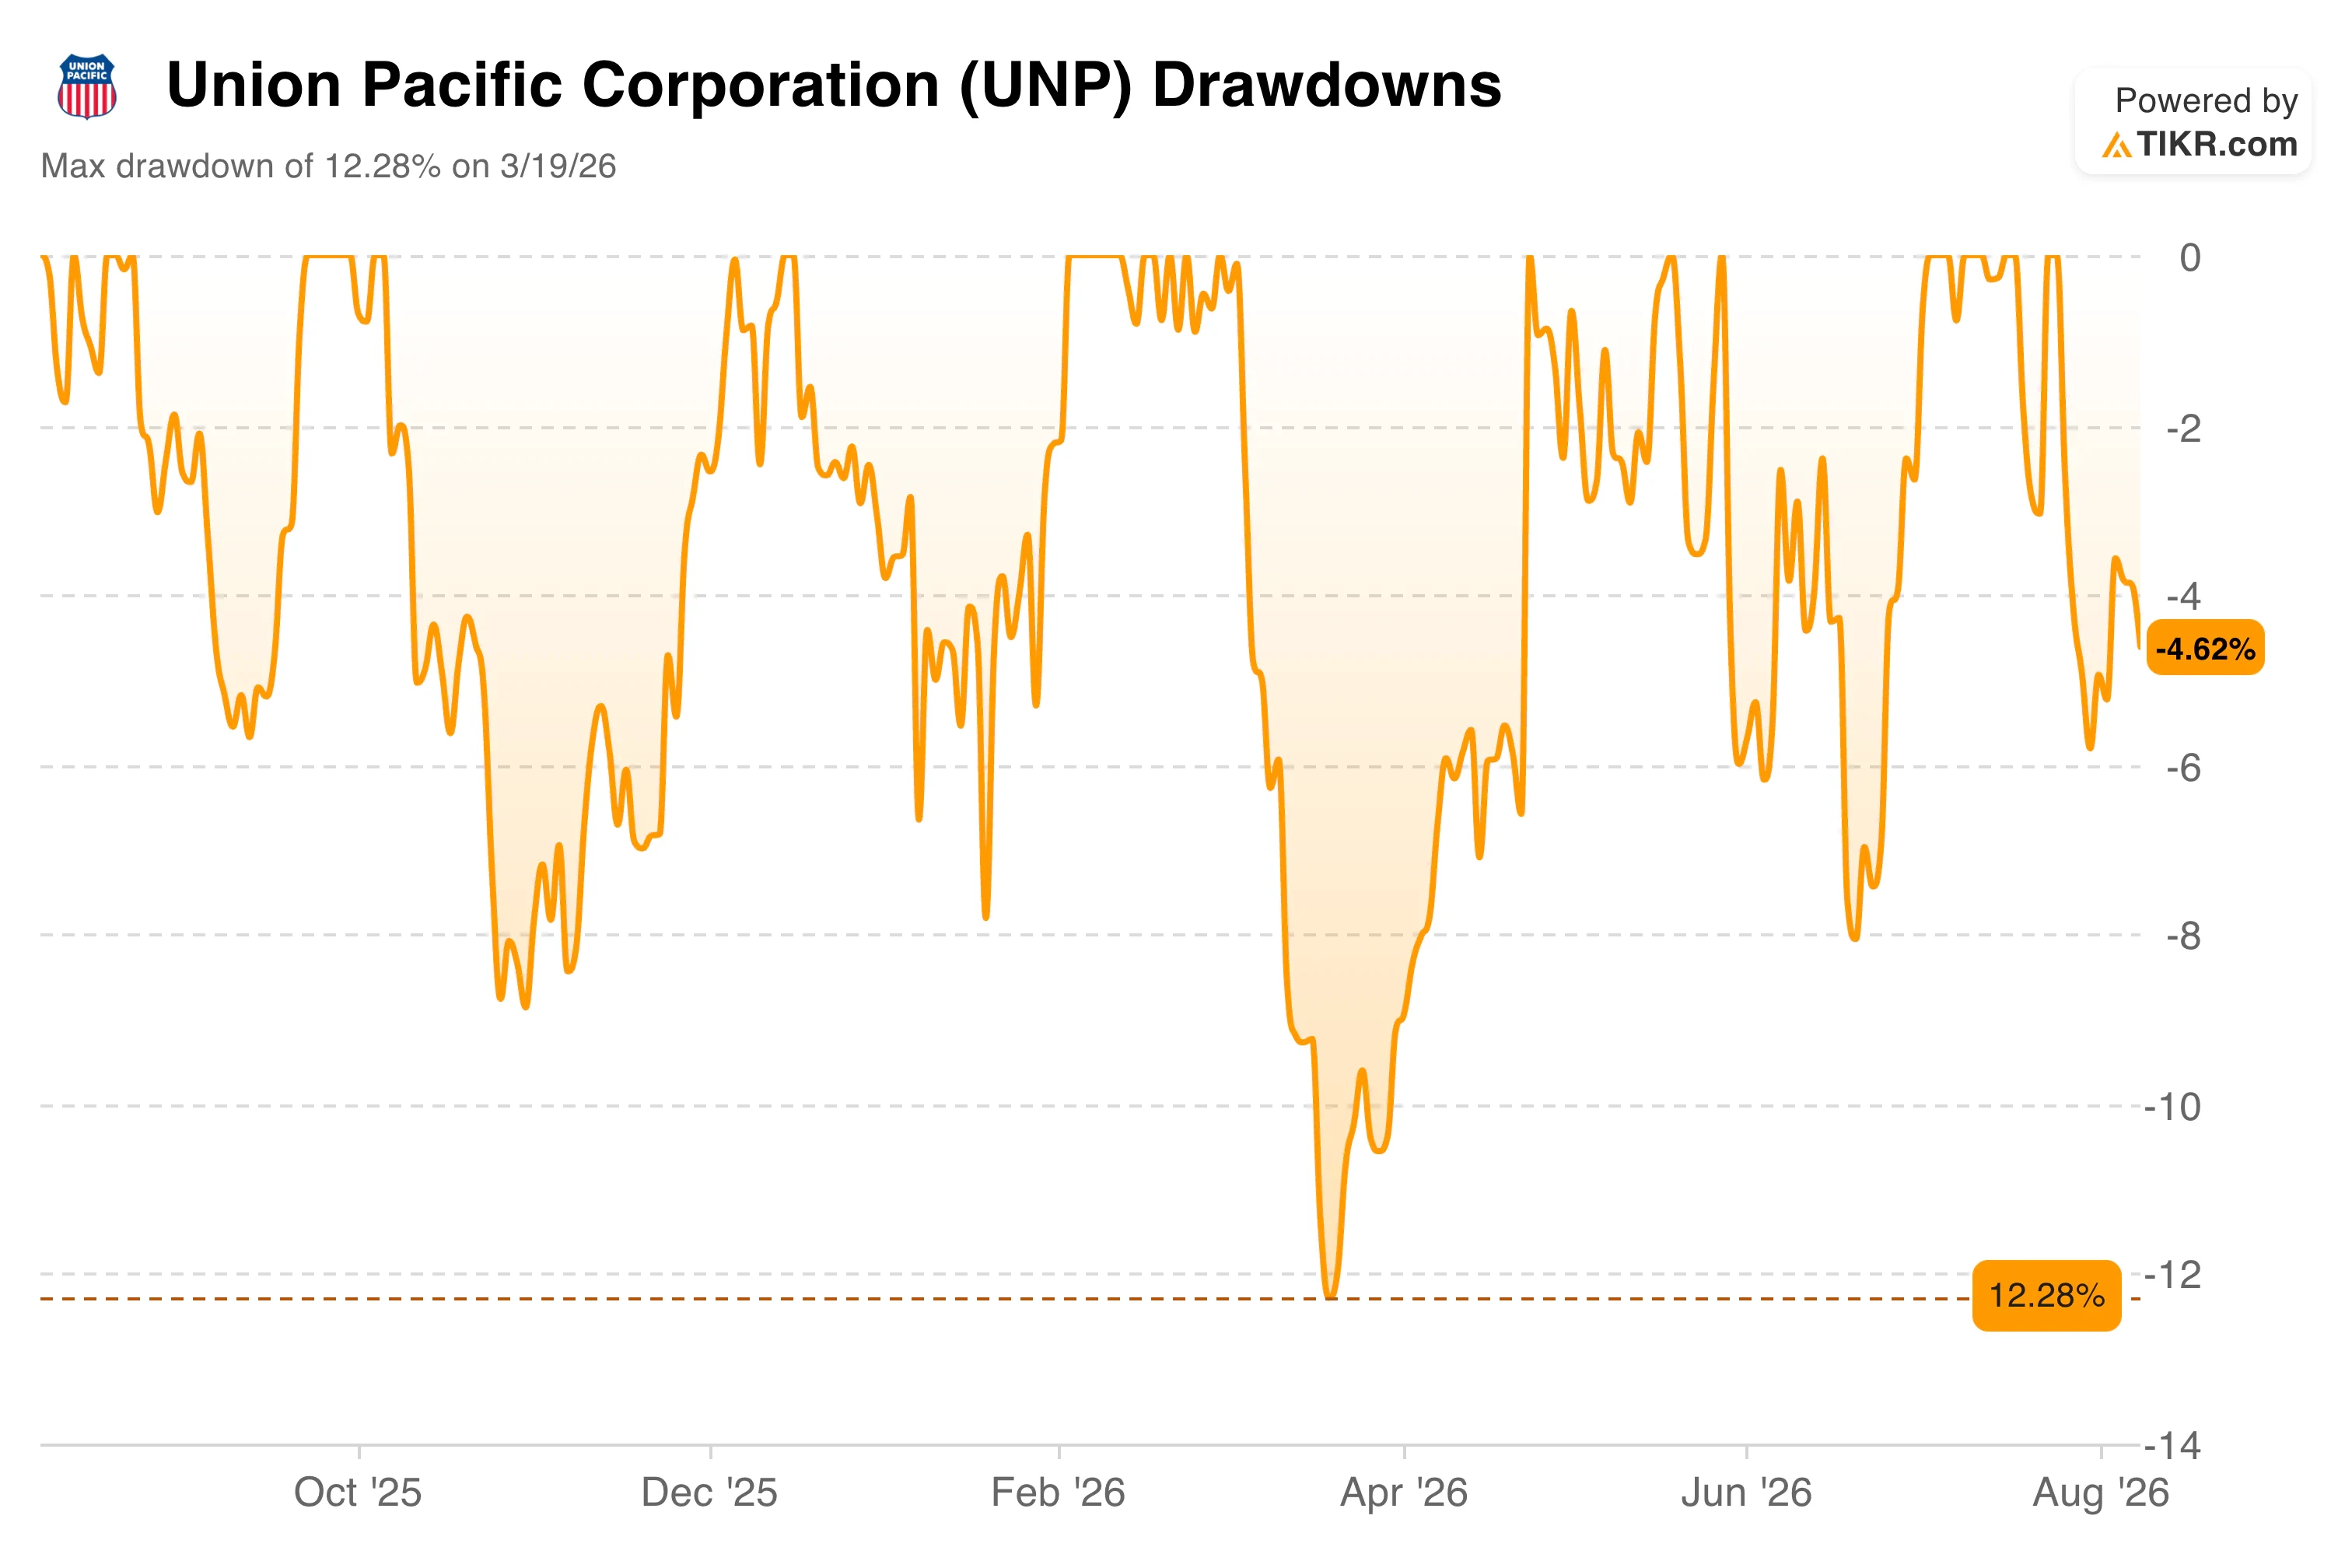
The drawdowns chart captures how contained that fear turned out to be. The max drawdown over the past year was just 12.28%, hitting on March 19 as tariff anxiety peaked. From there, the stock recovered steadily, and the Q2 results in late July confirmed what the underlying business had been signaling all along.
Revenue grew 12% to $6.86 billion, adjusted EPS came in at $3.41, beating consensus by roughly 7%, and domestic intermodal posted its fourth consecutive record quarter. The business barely flinched.
See historical and forward estimates for Union Pacific stock (It’s free!) >>>
The Cash Machine Behind the Railroad
Part of what makes Union Pacific genuinely interesting as a long-term holding is how consistently it generates cash, and what management does with it. CEO Jim Vena, who took over in 2023 and has driven meaningful improvements in operating efficiency, has made capital discipline a defining feature of his tenure.
The operating ratio came in at 59.2% in Q2, adjusted for fuel, meaning Union Pacific spent about 59 cents to generate every dollar of freight revenue. An operating ratio below 60% is considered elite in the railroad industry.

The free cash flow chart reflects that discipline. Annual FCF has stayed in a range of roughly $4.8 billion to $6.1 billion for five years, a level of consistency that most industrial companies would envy.
The 2023 dip to $4.8 billion came as capital expenditures increased, and the subsequent recovery reflects a business that generates substantial cash almost regardless of the economic environment.
In the first half of 2026 alone, cash from operations came in at $5.5 billion, up 21% year over year, and the company used a portion of that to retire $1.5 billion in long-term debt. Net debt to EBITDA now stands at 2.2 times, continuing a multi-year deleveraging trend.
Value your favorite stocks like UNP with 5 years of analysts’ forecasts using TIKR’s new Valuation Model (It’s free) >>>
What the Valuation Model Says About UNP
Union Pacific is not a growth stock in the traditional sense. Forward revenue growth is projected at around 7% annually, and EPS growth in the high single digits for 2026.
What the business offers instead is something rarer: durable, high-margin earnings power, consistent free cash flow, a 2% dividend, and a management team that has demonstrated it can improve operations in an industry with enormous structural advantages.
Railroads move freight at roughly four times the fuel efficiency of trucks, and Union Pacific holds an irreplaceable network position across the western United States.

The TIKR valuation model targets around $390 per share under mid-case assumptions, implying roughly 33% total return from current levels over the next four-plus years, or about 7% annualized.
The low case reaches around $409 by 2034 at roughly 4% per year, while the high case approaches $609 at roughly 9% annually. The range is relatively tight compared to most stocks at this size, which itself reflects the predictability of the underlying business.
Should You Buy Union Pacific Stock?
Union Pacific is the kind of stock that rewards patience more than excitement.
The business is operationally excellent, structurally advantaged, and run by a management team that has shown it can extract more efficiency from an already-efficient railroad. The Q2 results removed any doubt that the spring tariff scare was a fundamental problem rather than a sentiment-driven overreaction.
At around 22 times forward earnings with a street target of $329 and a model mid-case suggesting around 7% annualized, this is not a screaming bargain, but for investors who want durable compounding with meaningful downside protection, Union Pacific continues to make a compelling case.
See the exact moment Wall Street upgrades a stock before the rest of the market piles in — track analyst rating changes in real time with TIKR for free →
Looking for New Opportunities?
- See which stocks billionaire investors are buying to follow the smart money.
- Analyze stocks in as little as 5 minutes with TIKR’s all-in-one, easy-to-use platform.
- The more rocks you overturn… the more opportunities you’ll uncover. Search 100K+ global stocks, global top investor holdings, and more with TIKR.
Disclaimer:
Please note that the articles on TIKR are not intended to serve as investment or financial advice from TIKR or our content team, nor are they recommendations to buy or sell any stocks. We create our content based on TIKR Terminal’s investment data and analysts’ estimates. Our analysis might not include recent company news or important updates. TIKR has no position in any of the stocks mentioned. Thank you for reading, and happy investing!