Key Takeaways
- Berkshire Hathaway’s latest 13F shows that, among its positions of 2% or more, analysts see the most upside in Alphabet, Bank of America, Occidental Petroleum and American Express.
- Analysts’ average targets sit 43% to 44% above Alphabet’s two share classes, 26% above Bank of America and Occidental, and 16% above American Express.
- Berkshire held all of them steady in the third quarter except Bank of America, where it cut its stake 6%.
- If I could only buy one right now, it’d be Alphabet. It trades below its long-run forward multiple, and its Cloud backlog is above $500 billion.
Berkshire Hathaway (BRK.B) filed its 13F for the quarter ended Sept. 30 on Nov. 16. It’s the closest thing investors get to a look over Greg Abel’s shoulder in his first year as CEO. At quarter-end, Berkshire held $304.2 billion of US stocks in 30 positions.
So where does Wall Street see the most upside? Among the positions worth 2% or more of the portfolio, these five have the highest average analyst targets compared with their last close. Berkshire held four of the five steady in the quarter.
1 and 2. Alphabet is cheaper than when Berkshire bought
Berkshire owns Alphabet (GOOGL) in both share classes, and the 13F lists them as two positions. At Sept. 30, it held 78.79 million Class A shares worth $27.11 billion, 8.9% of the portfolio. It also held 27.19 million Class C shares (GOOG) worth $9.26 billion, another 3.0%. The $400.37 average target sits 43% above the Class A’s last close and 44% above the Class C’s.
The average target has slipped from its July peak, but it’s still well above where it stood a year ago:
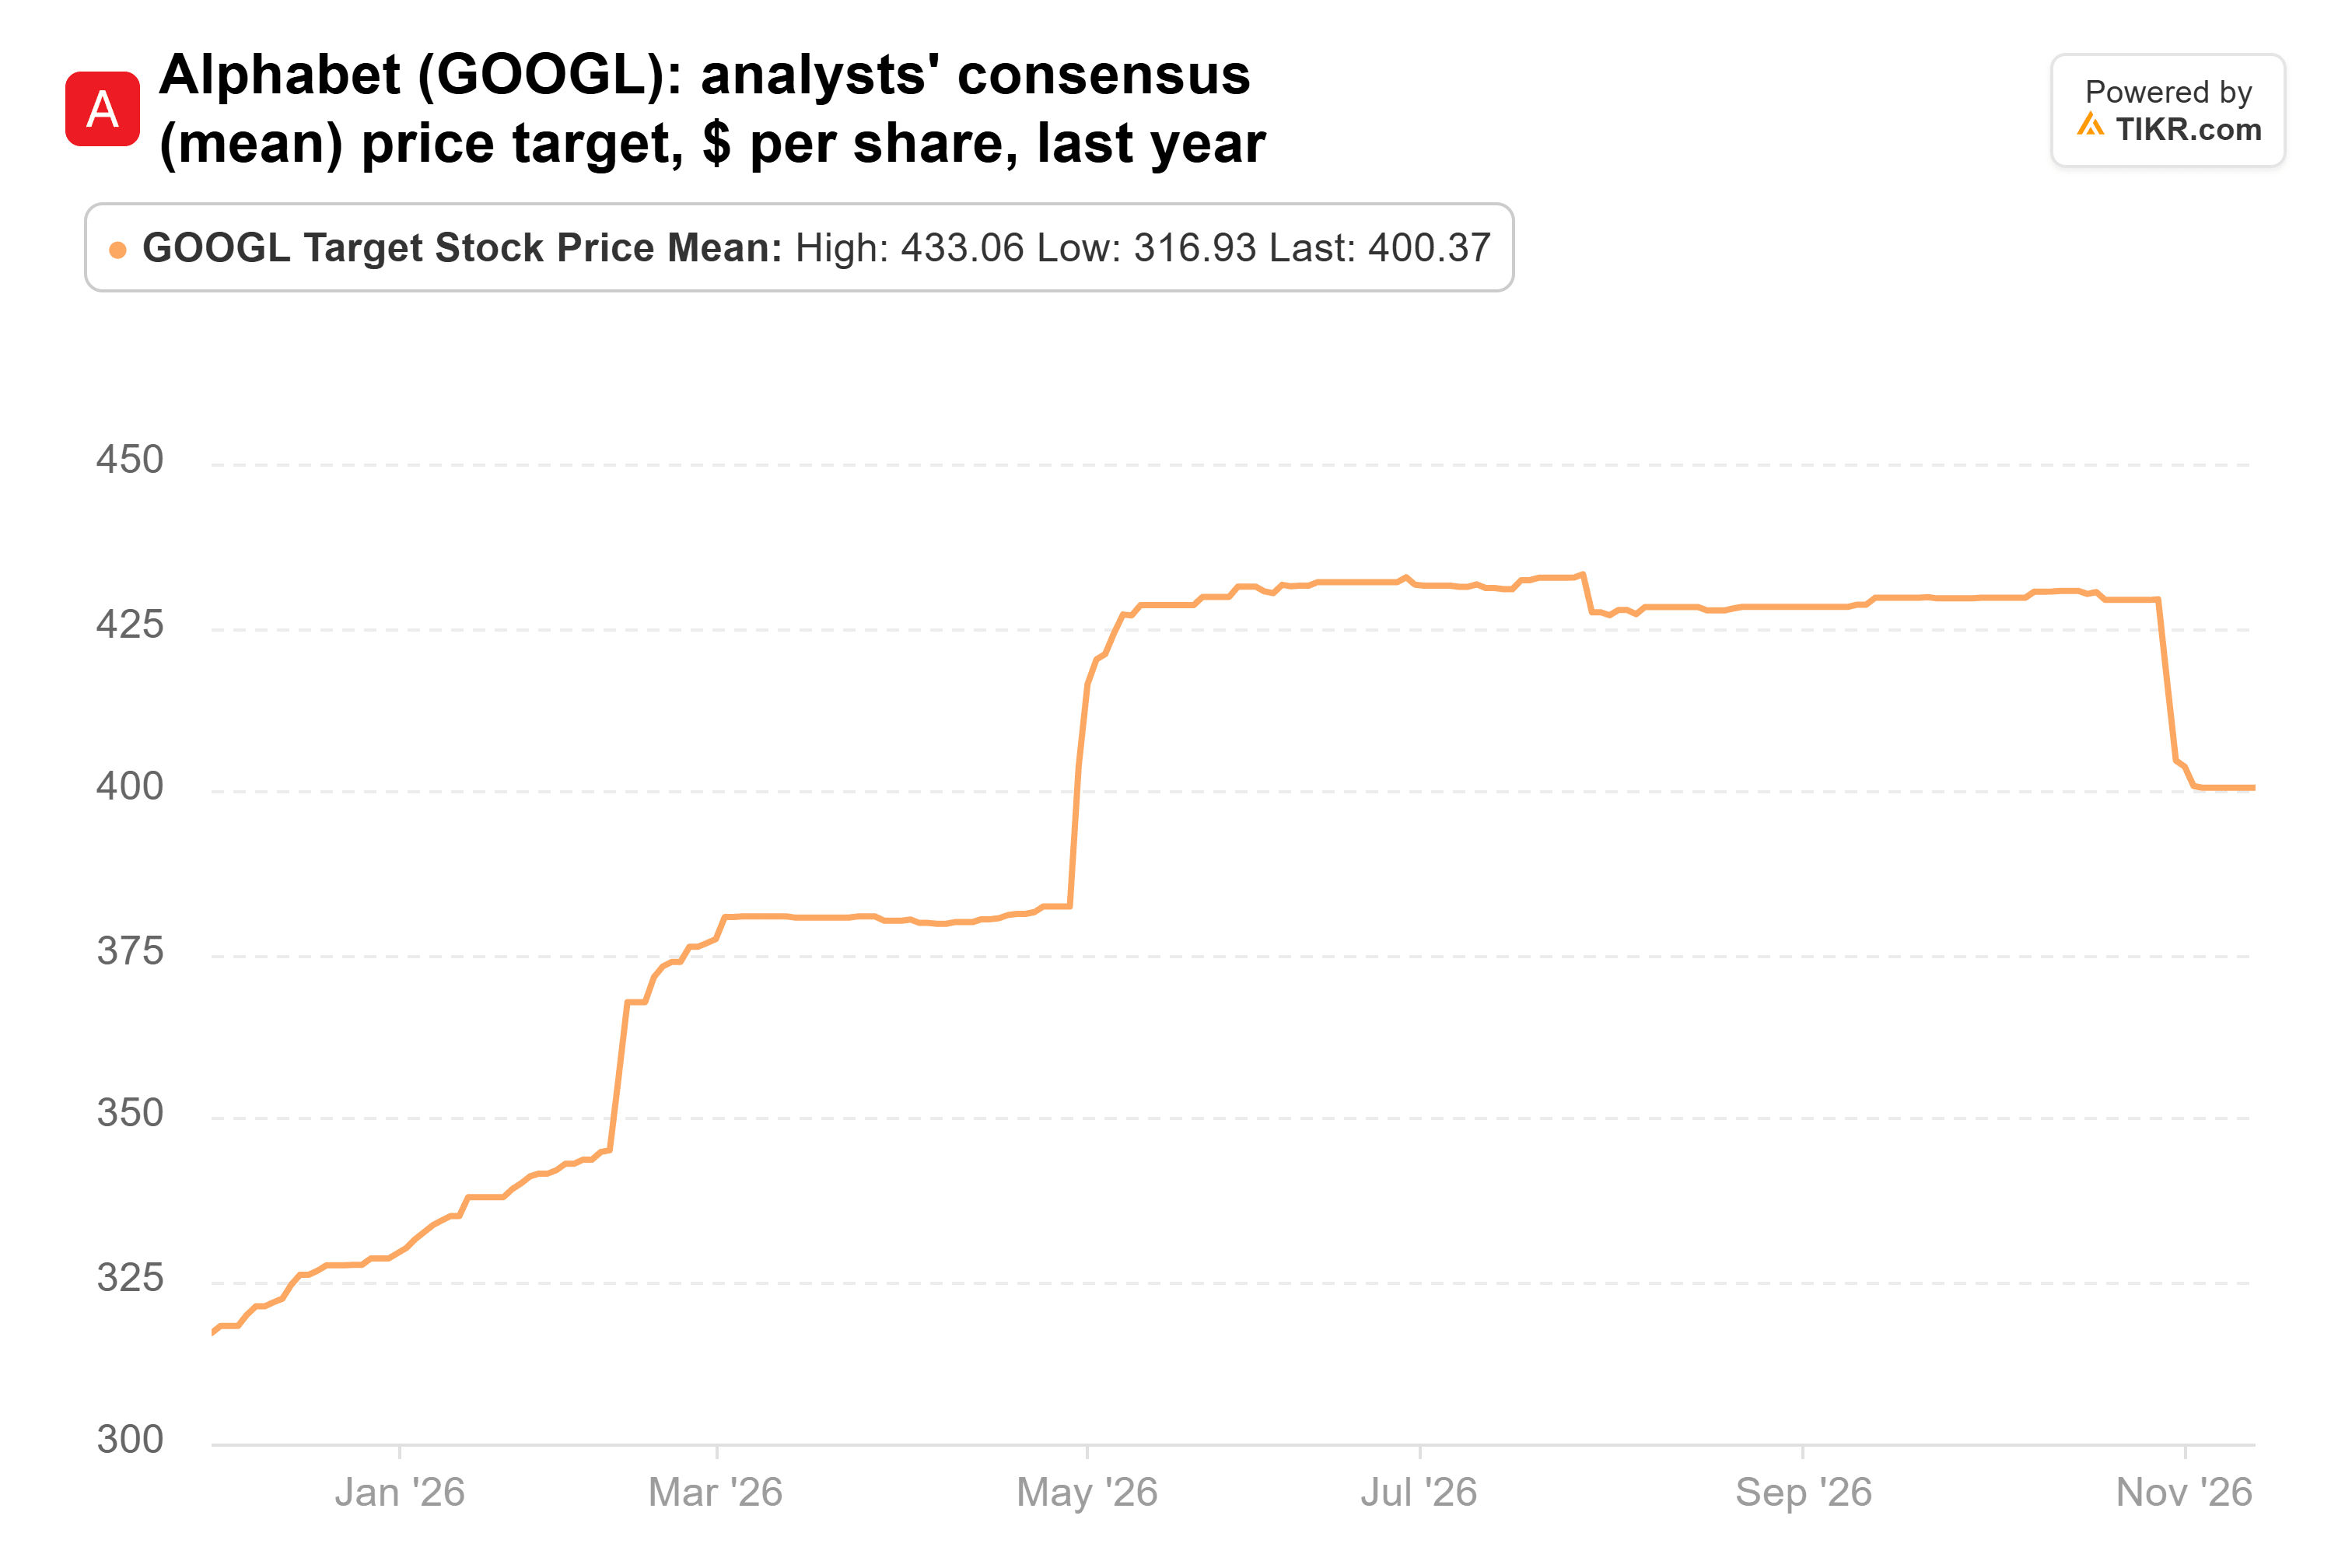
The price has gone the other way. Alphabet is 31% below its 52-week high and down 19% since the quarter ended, which leaves it cheaper than what Berkshire paid. At about 20x forward earnings, it trades below its 23x average since 2014. The catch is the AI bill: analysts have cut their free cash flow estimates for every year through 2028.
TIKR tracks 4 analysts on Berkshire Hathaway. How many say “Buy”?
See the full breakdown of Buy, Hold, and Sell ratings on Berkshire Hathaway, along with Wall Street’s revenue and earnings estimates, all in one place. More than 500,000 investors use TIKR to research stocks like this one. See Berkshire Hathaway’s Analyst Ratings
3. Bank of America has a capital question to answer
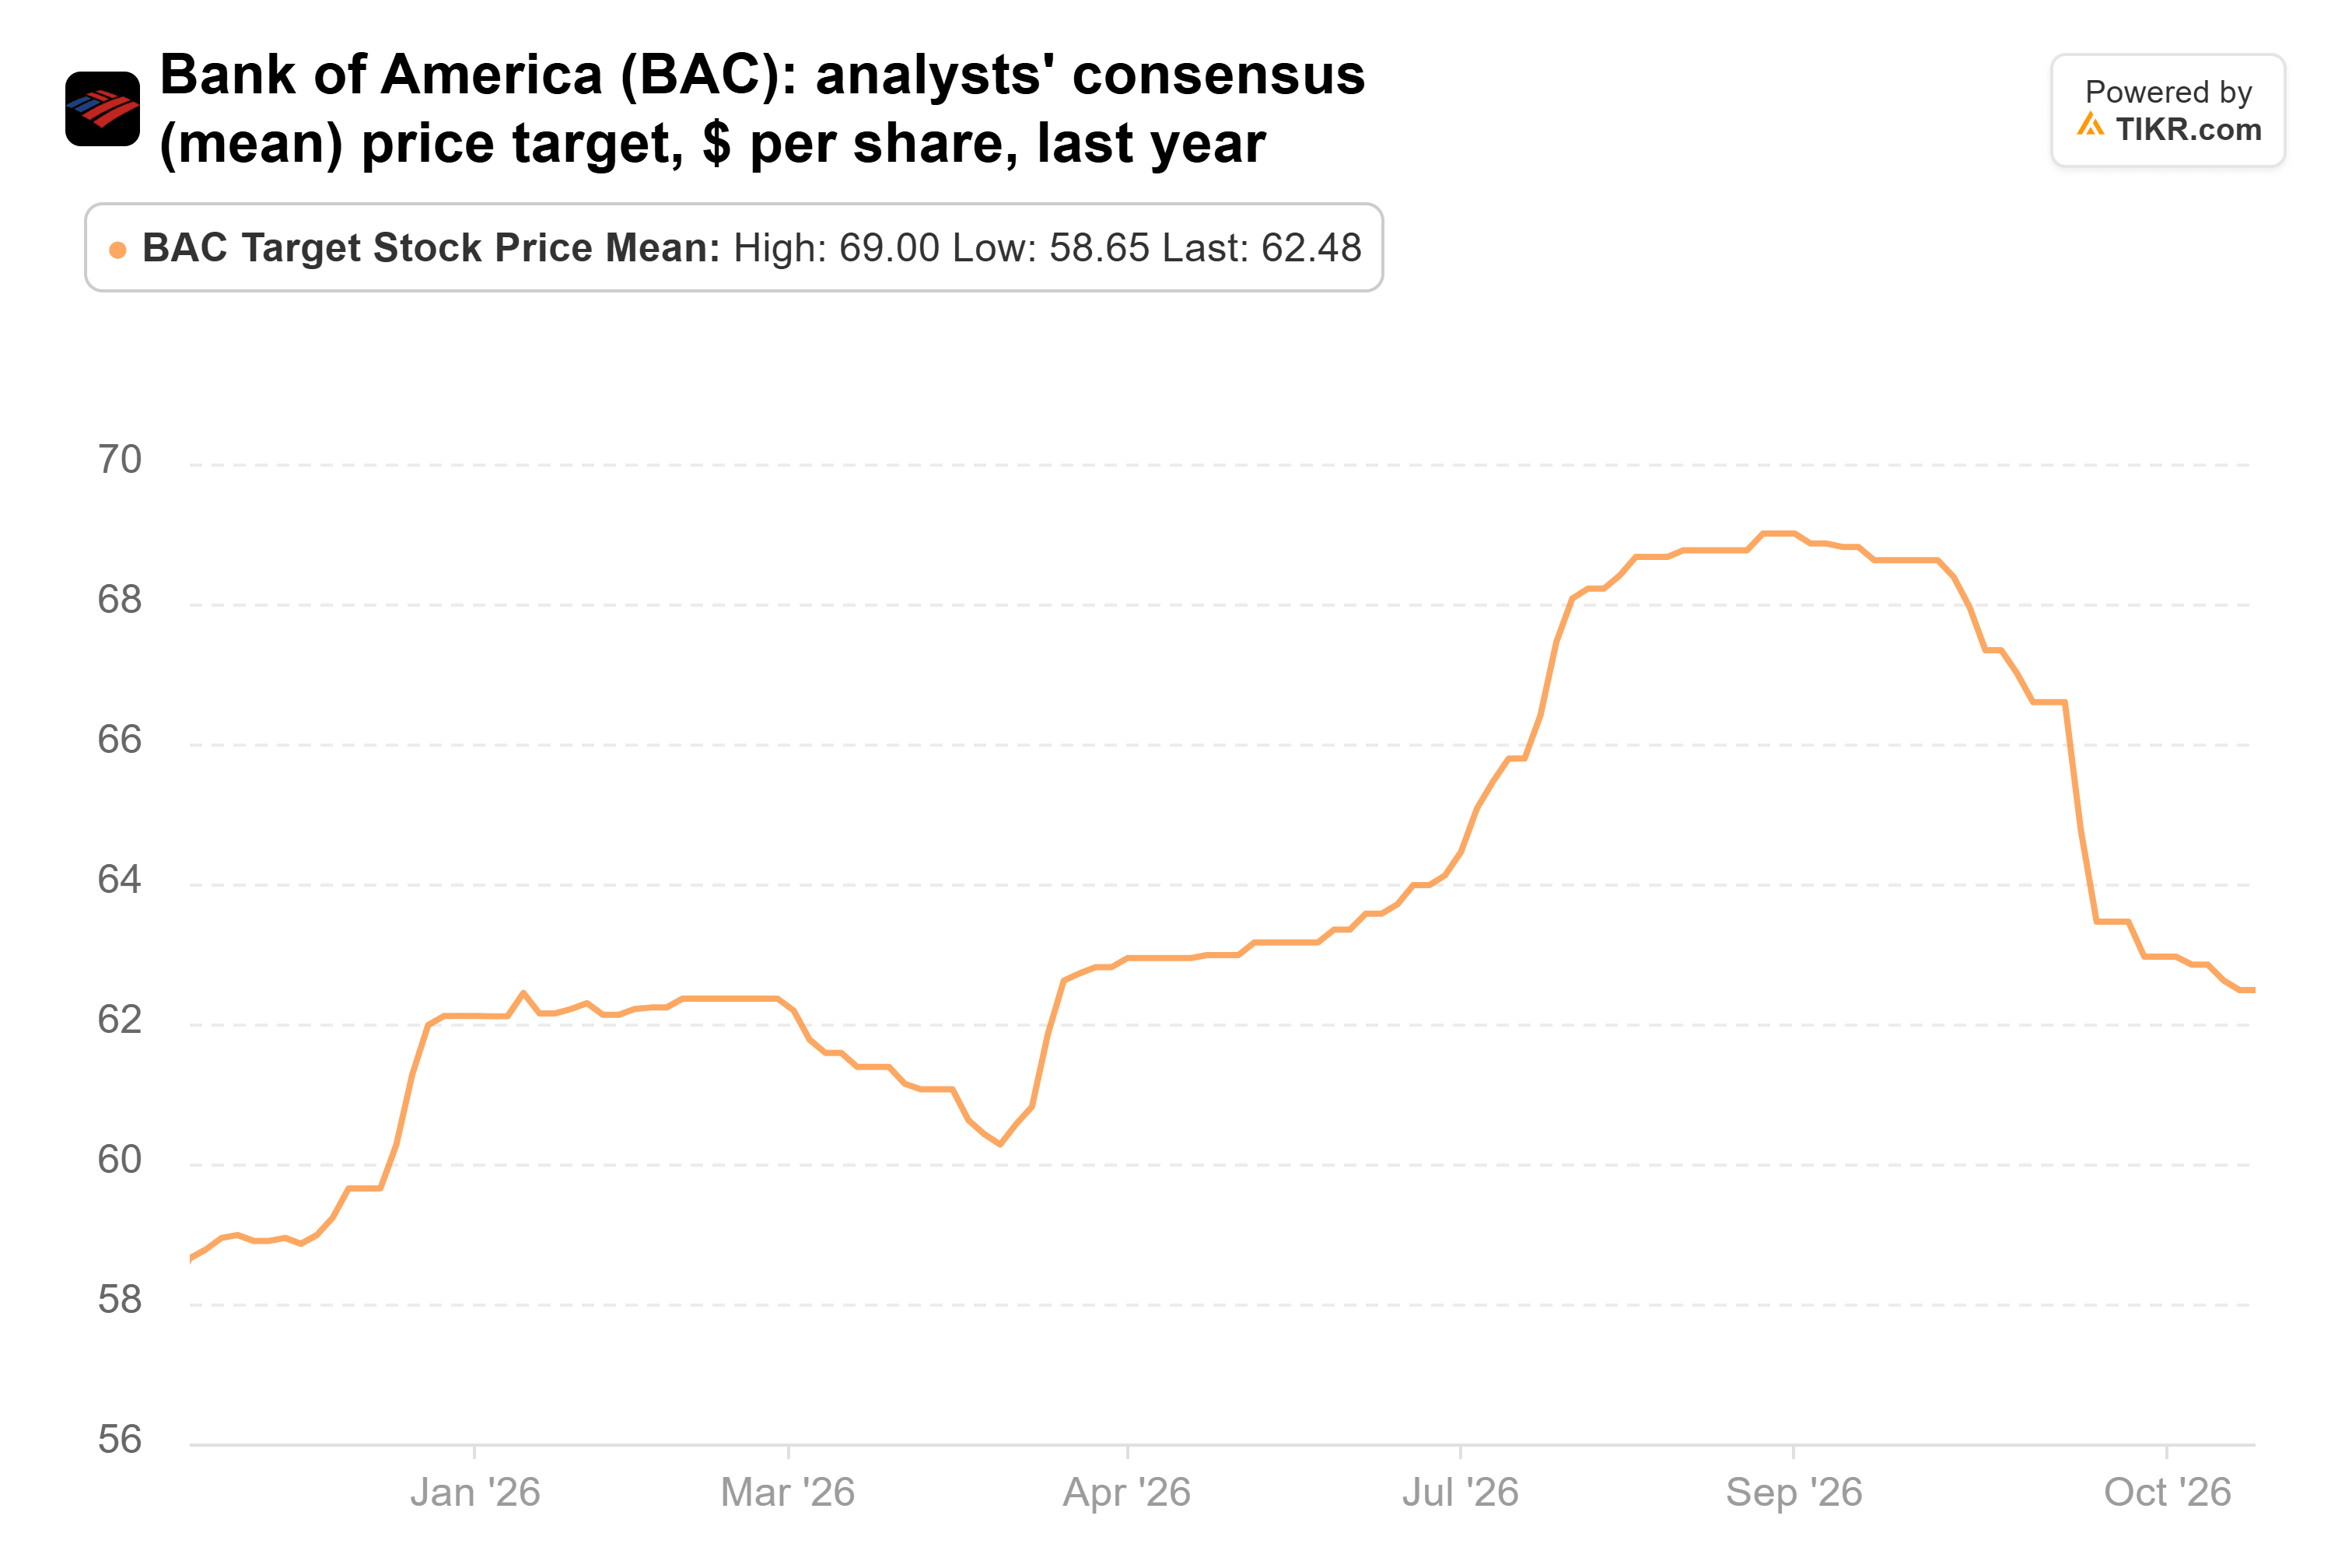
Bank of America (BAC) is the one position of the five that Berkshire trimmed in the third quarter. It cut its stake 6%, to 455.86 million shares worth $24.81 billion, still 8.2% of the portfolio. The stock is down 9% since quarter-end, and the $62.48 average target sits 26% above its last close.
The deposits are doing their job. Net interest income rose 8% to $16.4 billion in the third quarter. Management guides about 8% growth for 2026 and 8% or more for 2027. But return on tangible common equity fell to 12.6% in the quarter. Without a $1.2 billion penalty over its anti-money-laundering controls it was 14.9%, still short of management’s 16%-18% target.
Analysts noticed. The average target peaked at $69 in September and has come down since, though it’s still above where it was a year ago:
Capital is the other thing to watch. Bank of America’s CET1 ratio was 10.9% at Sept. 30, and under current rules its minimum rises to 10.5% on Jan. 1. Add management’s own 50-basis-point cushion, and that’s 11.0%. That puts its pace of about $6 billion a quarter in buybacks at risk, unless the final capital rules expected by year-end ease the requirement. At the end of September, the stock traded at 1.84x tangible book, above its 10-year average of 1.59x, and the drop since has closed some of that gap.
4. Occidental just hit its debt goal
Bank of America has to watch its capital, and Occidental Petroleum (OXY) just finished shoring up its own balance sheet. Berkshire’s 264.94 million shares were worth $14.66 billion at Sept. 30, 4.8% of the portfolio and unchanged on the quarter. The $71.15 average target sits 26% above the last close.
On Nov. 9, Occidental said it had cut its principal debt to $10.0 billion, after paying off $10.4 billion since the start of the year. It produced $2.8 billion of free cash flow before working capital in the third quarter, on $1.3 billion of capital spending. Adjusted EPS from continuing operations was $1.91, against $1.61 on a GAAP basis, with the gap mostly derivatives losses.
Analysts have chased the stock higher, lifting the average target from about $50 a year ago to just under its high:

The stock trades at about 9x forward earnings. The risk is the oil price: pre-tax oil and gas earnings slipped to $2.6 billion in the third quarter from $2.8 billion in the second, which the company put down to lower realized crude prices.
5. American Express is Berkshire’s biggest bet of the five
Occidental’s case leans on oil, and American Express (AXP) leans on how much its card members spend. Berkshire’s 151.61 million shares were worth $46.10 billion at Sept. 30. That’s 15.2% of the portfolio and its second-largest position, unchanged on the quarter. The $364.79 average target sits 16% above the last close.
The business is holding up its end:
- Third-quarter revenue rose 9% to a record $20.1 billion.
- Billed business rose 8% to $454.0 billion.
- Adjusted EPS rose 13% to $4.68. GAAP EPS of $5.42 included a one-time gain on an asset sale.
- Management raised its full-year GAAP EPS guidance to $18.30-$18.60, though expenses also rose 9%, to $14.5 billion.
The stock has lagged those results this year and sits 19% below its 52-week high, while the average target has barely moved over the past year:
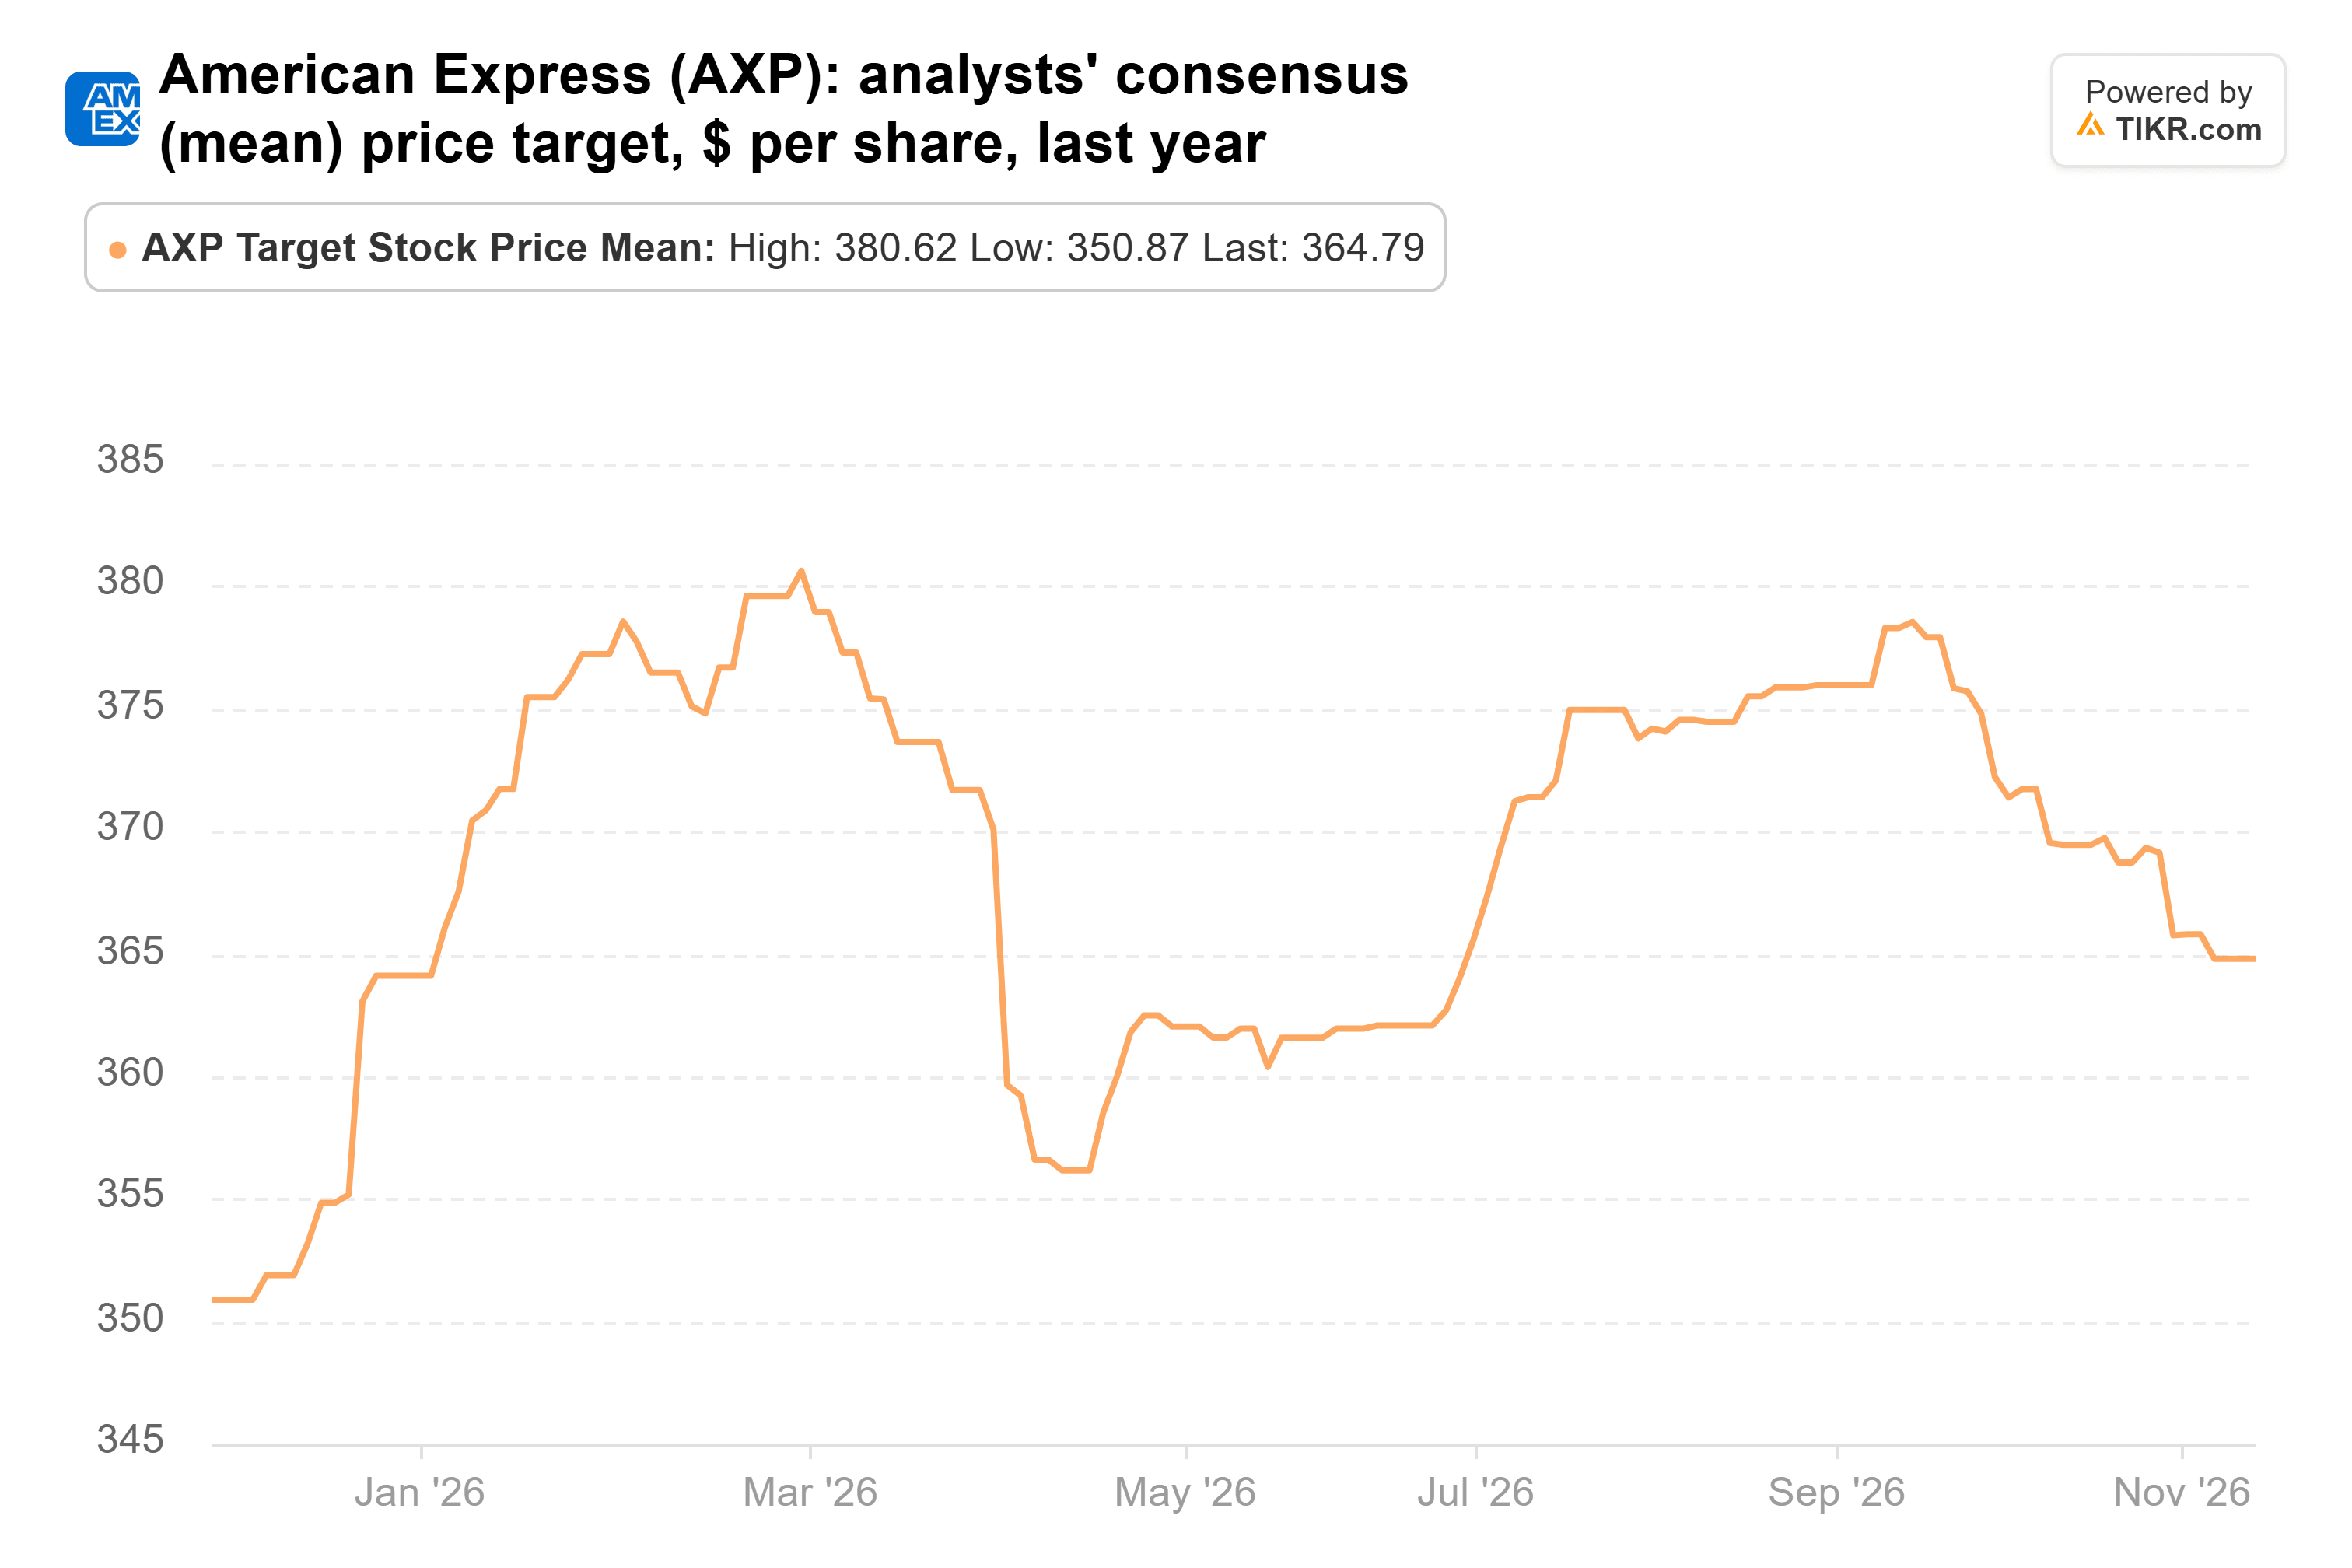
At about 16x forward earnings, the upside here rests on American Express keeping up that pace.
Alphabet gets my vote
If I could only buy one right now, it’d be Alphabet. Google Cloud’s backlog of signed contracts reached $513.9 billion at June 30, up from $155 billion at the end of September 2025. So much of the AI spending follows customers it already has. And at about 20x forward earnings, I’m not paying up for it.
Occidental makes a strong case too. It’s cheap, its debt goal is behind it, and it’s the pick for anyone who wants less riding on AI. But its earnings rise and fall with the oil price, which no management team controls.
The risk for Alphabet is the bill. Management guides 2026 capital spending to $195 billion-$205 billion, up from $91.4 billion in 2025, and expects 2027 to be significantly higher. Alphabet’s fourth-quarter report in early February is the next test: a backlog still growing faster than capex would back the case. Its reported earnings will also start swinging with Anthropic’s share price once Anthropic begins trading on Nov. 19. Berkshire’s next 13F is due by mid-February and will show whether Berkshire added to it.
So what is Alphabet stock actually worth?
TIKR lets you forecast the future price of any stock in less than a minute. Just enter a few assumptions into TIKR’s valuation model and see what Alphabet could be worth. Start from Wall Street consensus estimates, or adjust the inputs to reflect your own view of the business. It’s free to use.
Disclaimer:
Please note that the articles on TIKR are not intended to serve as investment or financial advice from TIKR or our content team, nor are they recommendations to buy or sell any stocks. We create our content based on TIKR Terminal’s investment data and analysts’ estimates. Our analysis might not include recent company news or important updates. TIKR has no position in any of the stocks mentioned. Thank you for reading, and happy investing!