Key Stats for NKE Stock
- Past week’s performance: -5.7%
- 52-week range: $40 to $80
- Valuation model target price: $60
- Implied upside: 47.9% over the next 1.9 years
Value your favorite stocks like NKE with 5 years of analysts’ forecasts using TIKR (It’s free) >>>
Layoffs, a New CFO, and a Brand Still Looking for Its Footing
Nike, Inc. (NKE) closed the week around $41, touching a multi-year low. The stock sits nearly 50% below its 2021 peak. Investors have repriced the brand sharply as revenue stagnated and margins compressed under tariff pressure and a softer consumer environment for full-price athletic footwear.
The week’s defining headline was the CFO appointment. Nike named David Denton as CFO, effective August 17, replacing Matthew Friend. Denton spent two decades at CVS Health as its CFO before moving to Pfizer, where he served from 2018 to 2022, overseeing finance, strategy, and transformation. That background is rooted in cost structure discipline and capital allocation, which is exactly the skill set Nike needs while pushing through two rounds of layoffs and rebuilding its margin base.
“Nike is one of the world’s great brands, with extraordinary strengths in sport, innovation, and global scale,” Denton said in the company announcement. CEO Elliott Hill demonstrated his own conviction earlier this year by purchasing nearly $1 million in Nike shares on the open market.
The layoffs are the other defining chapter of the restructuring. Nike announced it would cut around 1,400 roles in global operations in April, the second wave of reductions after an earlier cut of 775 distribution center employees in January. Both rounds target structure rather than brand or product investment. Management described the actions as part of the “Win Now” plan designed to flatten the operating model and reduce costs. The combined reductions signal that Nike is treating efficiency as a prerequisite for any earnings recovery.

Nike’s Q3 FY26 results, reported April 1, showed revenue flat year over year at $11.3 billion, beating the consensus estimate of $11.2 billion. EPS came in at $0.35, beating the $0.29 estimate but still 35% below the year-ago level. Gross margin declined 130 basis points to 40.2%, pressured by inventory de-risking and tariff costs. Going forward, NKE stock will likely remain range-bound until the Q4 report on June 30 shows whether revenue stabilization is holding and gross margin has begun to recover.
See analysts’ growth forecasts and price targets for NKE (It’s free) >>>
Is NKE Stock Cheap Enough to Be Interesting?
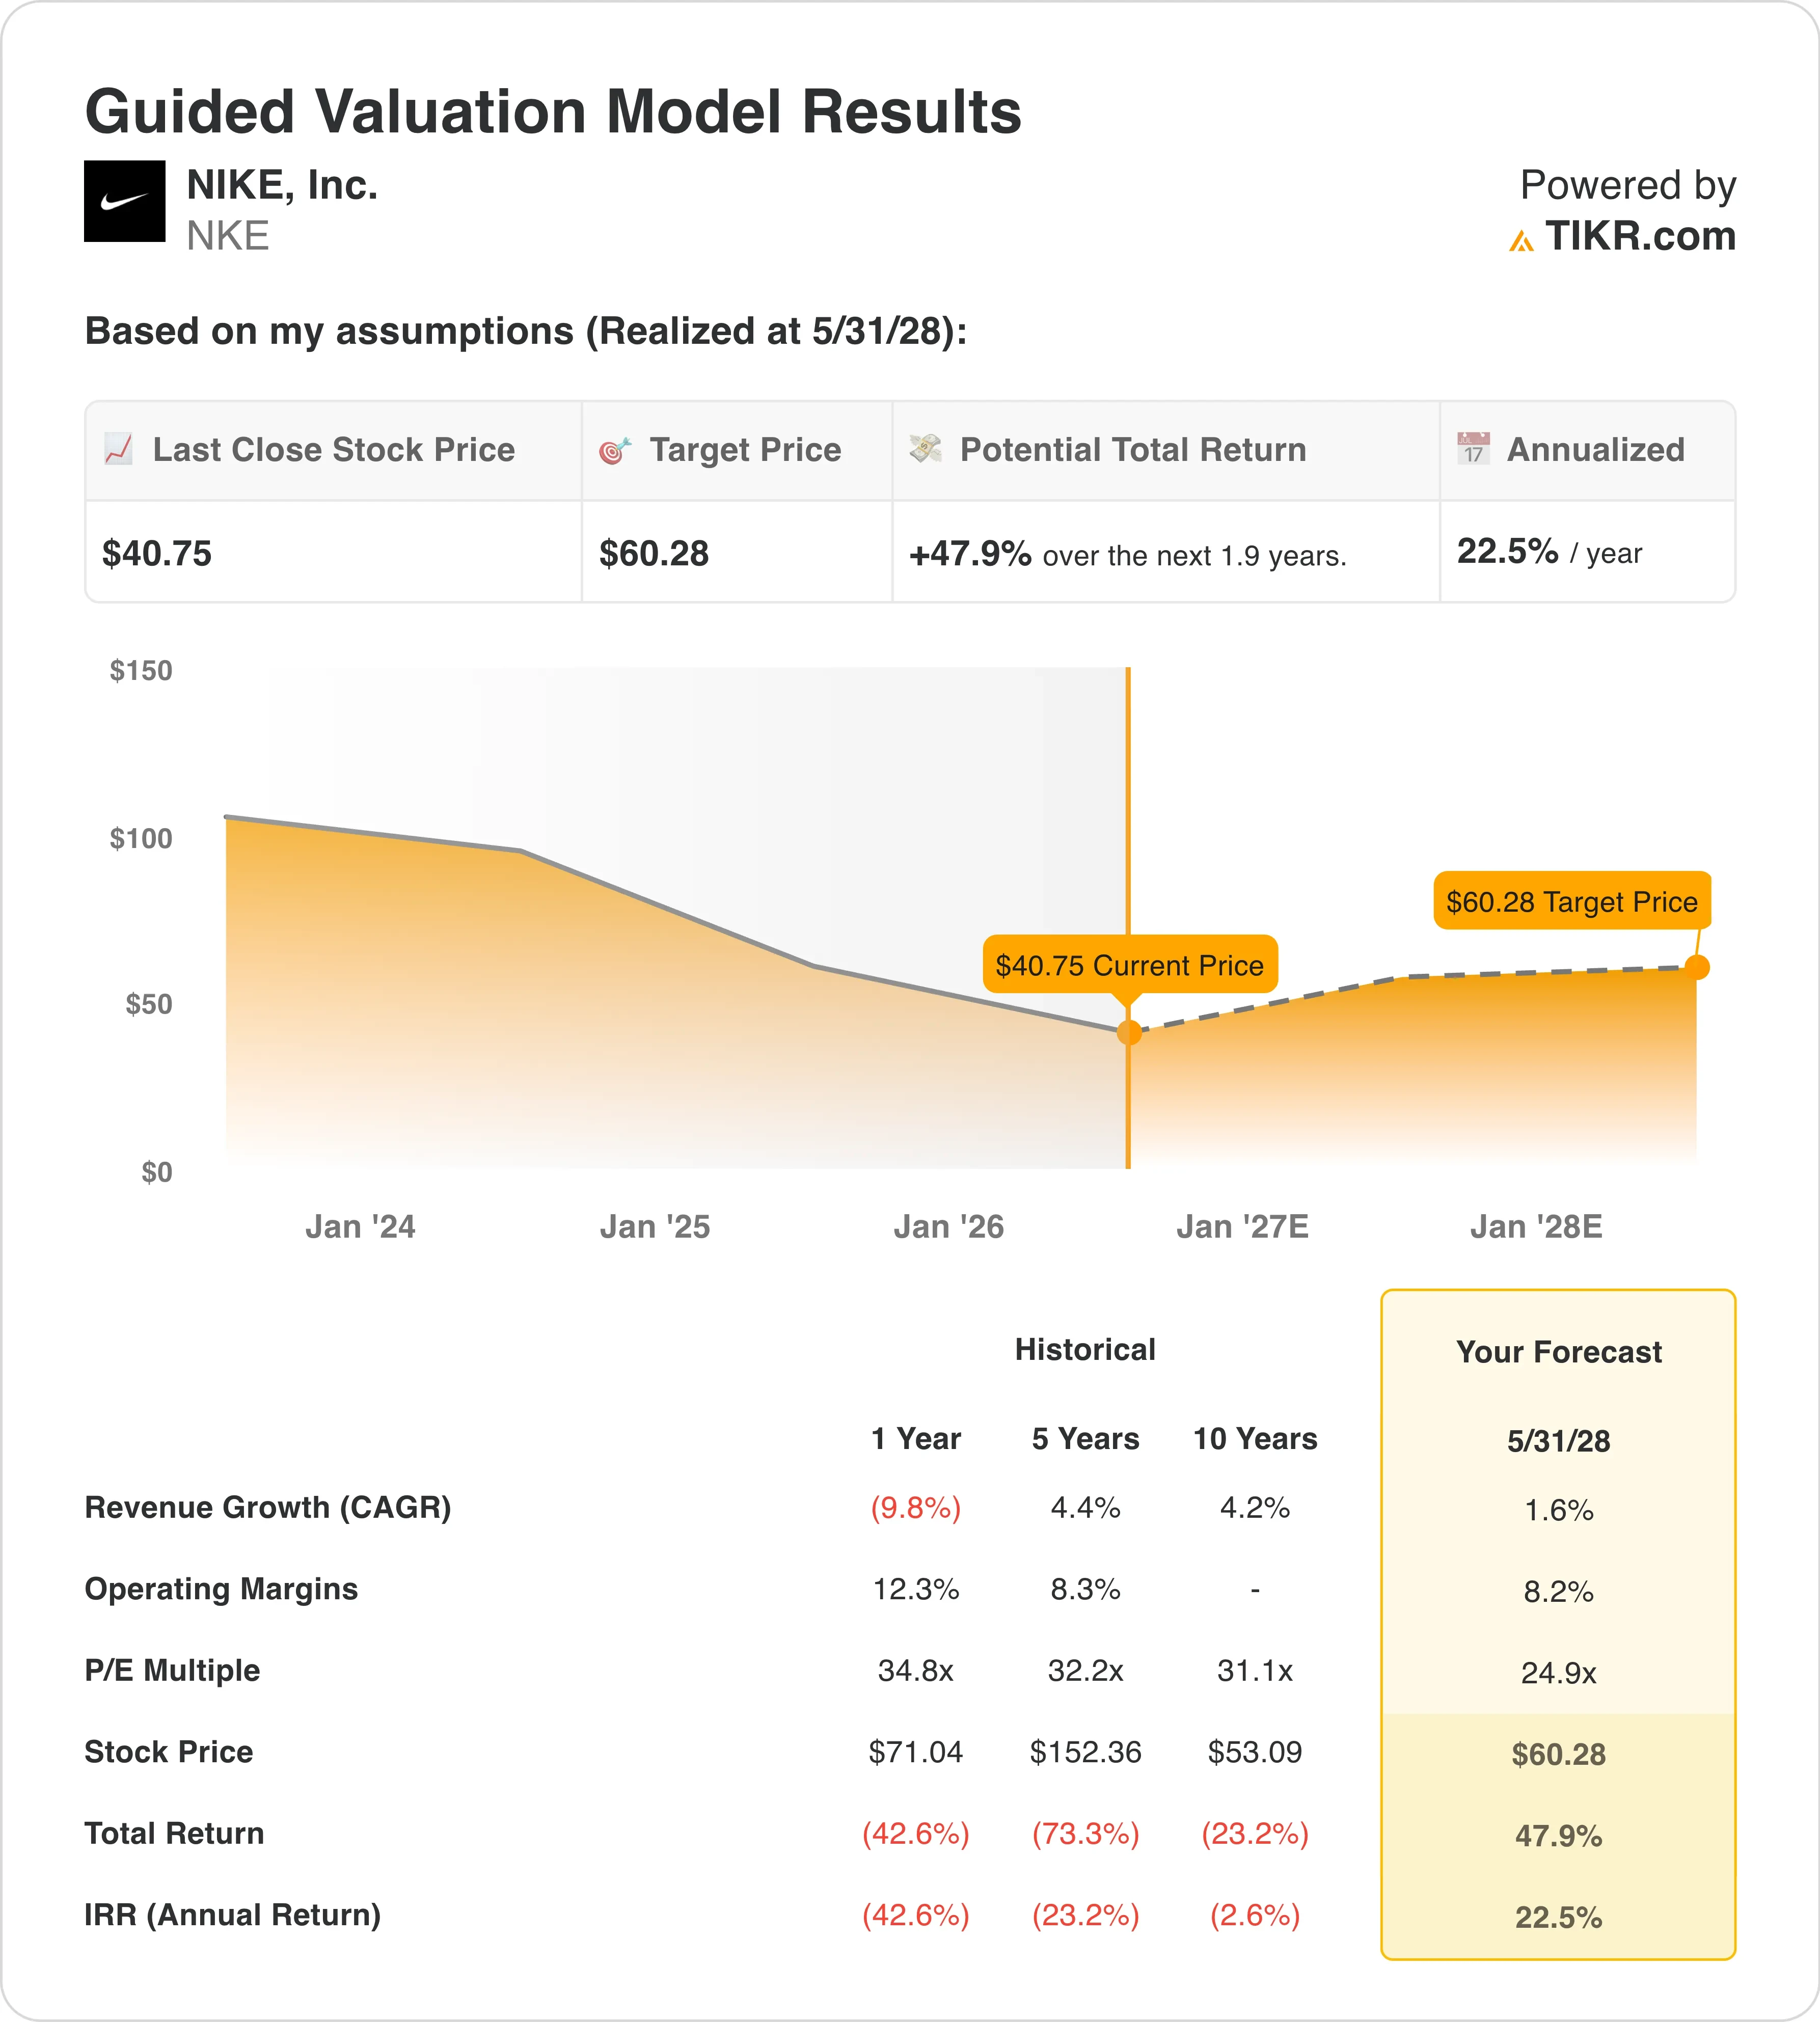
Under valuation model assumptions realized through 5/31/28, the stock is modeled using:
- Revenue Growth (CAGR): 1.6%
- Operating Margins: 8.2%
- Exit P/E Multiple: 24.9x
Based on these inputs, the model estimates a target price of $60, implying 47.9% total upside from the current share price of $41 and an annualized return of 22.5% over the next 1.9 years.
A 22.5% annualized return from a 1.6% revenue CAGR may seem contradictory, but the math works because the starting valuation is compressed enough that even modest earnings recovery produces significant price appreciation. Nike’s LTM EBIT margin is 6.7% today. The model’s 8.2% target implies recovery of roughly 150 basis points, which is conservative relative to the company’s historical 12% to 14% range. So the base case does not require Nike to return to peak efficiency. It only requires partial normalization.

The current NTM P/E sits at about 25x, while the forward 2-year revenue CAGR is near zero. That setup prices for continued deterioration rather than a recovery. The NTM EV/EBITDA of 17.25x reflects a market that demands proof before rewarding the narrative. The 24.9x exit P/E in the model assumes a slight discount to Nike’s 5-year historical average P/E of around 32x. That is appropriate given the structural reset underway, yet it still produces a compelling total return if cost discipline holds.
The 22.5% annualized signal is genuinely interesting. It puts Nike in the category of potentially undervalued, but only if revenue stops declining and margins begin recovering. The street target of $58 is closely aligned with the model’s $60, which adds credibility to the base case.
See where analysts are setting Nike revenue and margin forecasts on TIKR >>>
Nike Against Adidas and On Running in the Athletic Market
Nike’s most visible competitor is Adidas (ADS), and the comparison right now is uncomfortable for NKE bulls. Adidas is edging Nike in early World Cup sales data, a meaningful reversal given Nike’s historical dominance in major soccer tournament merchandise. Adidas reported first-quarter operating profit above expectations in April.
It also received a brand boost from a “supershoe” marathon win that strengthened its running-category positioning against Nike’s core franchise. Adidas’s gross margin recovery is running ahead of Nike’s, and both companies trade at similar NTM EV/Revenue multiples around 1.4x, but Adidas carries better near-term momentum.

On Running (ONON) is a sharper competitive threat for Nike’s long-term future. The company has been attracting younger and female customers at a rate that has drawn management commentary across the athletic sector. On raised its 2026 profit margin goal after strong customer acquisition momentum, a direct contrast to Nike’s cost-cutting posture. On is growing revenue at double-digit rates while Nike’s forward 2-year revenue CAGR is essentially flat.
Both companies trade at premium valuations relative to earnings, but On is earning its premium through growth, while Nike needs to prove its premium on recovery. Nike’s moat remains its brand depth, its DTC infrastructure, and its long-term footwear technology portfolio. However, the window in which competitors are gaining share is real, and the turnaround must work faster to arrest it.
Find out why investors are still watching Nike despite the selloff >>>
What’s Driving NKE Stock Going Forward?
The most immediate catalyst is the Q4 FY26 earnings report on June 30. Nike guided Q4 revenues to be down 2% to 4% on a reported basis, with modest growth in North America offset by declines in Greater China and Converse. Investors need to see whether gross margin inflected positively and whether management’s tone on the tariff impact becomes more constructive. Q4 will determine whether the cost-cutting effort is creating operating leverage or simply shrinking the business.
The World Cup is a meaningful brand catalyst this summer. Nike sponsors more national teams than any other brand, and the tournament is one of the largest cultural exposure events in sports. Real-time data showed Nike leading Adidas in World Cup merchandise sales as of mid-June, a positive signal that contrasts with earlier tournament data pointing the other way. A strong Nike showing in kit sales would be a brand signal without being an immediate revenue event. International merchandise cycles flow through over multiple quarters.

David Denton’s arrival in August sets the stage for a potential capital allocation update in the fall. Nike’s balance sheet remains manageable, with a dividend yield of 4.4% and a quarterly payment of $0.41 per share. Whether Denton signals a buyback acceleration or a more disciplined SG&A structure will shape how investors price the FY27 setup. His background in managing complex cost bases at scale gives some confidence that the right signals are coming.
Finally, tariff exposure remains an overhang. Nike manufactures heavily in Vietnam and other Asian markets. Any escalation on those supply chains would compress gross margins further. Management noted in the Q3 call that actions to mitigate tariff costs should begin supporting gross margin expansion in the second quarter of fiscal 2027. If trade tensions ease before then, Nike’s cost structure improves ahead of any internal actions, creating a potential upside scenario the base-case model does not fully credit.
Track Nike’s margin recovery and analyst estimate revisions in real time on TIKR >>>
Should You Invest in NIKE?
The only way to really know is to look at the numbers yourself. TIKR gives you free access to the same institutional-quality financial data that professional analysts use to answer exactly that question.
Pull up NKE, and you’ll see years of historical financials, what Wall Street analysts expect for revenue and earnings in the quarters ahead, how valuation multiples have moved over time, and whether price targets are trending up or down.
You can build a free watchlist to track NKE alongside every other stock on your radar. No credit card required. Just the data you need to decide for yourself.
Analyze NKE stock on TIKR Free→
Looking for New Opportunities?
- See what stocks billionaire investors are buying so you can follow the smart money.
- Analyze stocks in as little as 5 minutes with TIKR’s all-in-one, easy-to-use platform.
- The more rocks you overturn… the more opportunities you’ll uncover. Search 100K+ global stocks, global top investor holdings, and more with TIKR.
Disclaimer:
Please note that the articles on TIKR are not intended to serve as investment or financial advice from TIKR or our content team, nor are they recommendations to buy or sell any stocks. We create our content based on TIKR Terminal’s investment data and analysts’ estimates. Our analysis might not include recent company news or important updates. TIKR has no position in any stocks mentioned. Thank you for reading, and happy investing!