Key Stats for Microsoft Stock
- Current Price: $386.74
- Target Price (Mid): ~$780
- Street Target: ~$560
- Potential Total Return: ~100%
- Annualized IRR: ~19% / year
- Earnings Reaction: -3.93% (April 29, 2026)
- Max Drawdown: 34.91% (June 25, 2026)
Now Live: Discover how much upside your favorite stocks could have using TIKR’s new Valuation Model (It’s free) >>>
What Happened?
Microsoft (MSFT) has spent 2026 being punished for the wrong reasons. The stock closed at $386.74 on July 6, roughly 30% below its 52-week high of $555.45, and printed a max drawdown of 34.91% on June 25, its worst of the year. For a company that just grew revenue 18% and watched its AI business cross a $37 billion run rate, that is a strange place to trade. The market is not arguing about whether Microsoft is winning. It is arguing about when the winning shows up in cash flow, and that gap between a strong business and a weak share price is the whole question heading into the back half of the year.
The fear is concrete. CFO Amy Hood guided for roughly $190 billion in calendar 2026 capital expenditures, a number so large it held free cash flow to $15.8 billion last quarter against $46.7 billion in operating cash flow. When a company spends $31.9 billion in a single quarter on data centers and chips, it lands on the income statement as cost long before it lands as profit. Bears see a company spending itself into a hole. The question the market cannot yet answer is whether that spending is buying real, contracted demand, or just optionality on a boom that may cool.
The evidence just shifted, and the market barely noticed
Two data points in late June and early July cut against the bear case. On June 29, Haleon, the consumer-health company behind Sensodyne and Advil, signed a five-year agreement to deploy Microsoft 365 Copilot, Azure and agentic AI across its operations in 170 countries. This matters because the knock on Microsoft all year has been that no one buys Copilot at scale. A five-year commitment across a regulated global enterprise, covering supply chain forecasting and clinical content, is not a pilot. Shares rose about 4% on July 1 as the news landed alongside a rotation out of chip stocks into software.
A second signal came from Jefferies. In a CIO survey led by analyst Brent Thill, Azure, Microsoft’s cloud platform, is now the primary cloud provider for 55% of surveyed U.S. chief information officers, versus 28% for Amazon Web Services. That gap widened from just 7 points in the December 2025 survey. On spending, Azure now commands 46% of expected cloud budgets against 29% for AWS. One contract is a headline, and one survey is a snapshot, but together they point the same way: Microsoft’s infrastructure bill appears to be landing with the customers who write the biggest checks.

See historical and forward estimates for Microsoft stock (It’s free!) >>>
What management actually said
The reason this spending is defensible traces back to the April 29 earnings call, where the tone was less about growth and more about how Microsoft gets paid. CEO Satya Nadella framed the AI shift in structural terms: “We are at the beginning of one of the most consequential platform shifts that will change the entire tech stack as agents proliferate and become the dominant workload.” That reframes the capex debate. If agents become the default enterprise workload, the infrastructure is an entry ticket, not an overreach.
The deeper insight was the business model change underneath the numbers. Microsoft is converting its commercial model from per-seat licenses to seats plus consumption. Nadella described it directly, saying any per-user business of Microsoft’s, “whether it’s productivity, coding, security, will become a per-user and usage business.” That already shows up in the data. Nearly 60% of Dynamics 365 service customers now buy usage-based credits on top of their seats, and GitHub Copilot moved to consumption pricing on June 1. A pure seat model caps revenue at price times headcount. A consumption layer lifts revenue per customer as usage grows, with no new sales required. That is how a mature software franchise re-accelerates, and it is the part of the story the drawdown ignores.
The backlog gives the argument a hard number. Hood confirmed that remaining performance obligations, the company’s contracted order book, topped $627 billion, up 99% year-over-year, with roughly 25% converting to revenue over the next 12 months. That is demand already signed, waiting on capacity to be recognized.
Is the discount justified?
Here is where the valuation gets hard to argue with. Microsoft’s NTM (next twelve months) EV/EBITDA sits at 12.71x, near a multi-year low and well beneath the roughly 17x to 22x range it held across 2025. Its NTM P/E of 20.89x is compressed against a 10-year average closer to 30x, per external market data. The market is applying a capital-intensive-hardware multiple to a business still earning software-grade margins, with a 68% gross margin and a 46.8% EBIT margin.
Against peers, the picture is nuanced rather than a screaming bargain. Microsoft’s 12.71x forward EV/EBITDA sits above Oracle at 10.98x but far below the growth-software cohort: Palo Alto Networks at 58.40x, CrowdStrike at 105.35x, and Palantir at 60.01x. Microsoft is the rare name combining hyperscale AI exposure with mega-cap profitability, yet it trades near the low end of that peer group on cash-flow multiples. The premium to Oracle is justified by Azure’s share gains and Copilot’s monetization runway. The discount to the high-growth security names reflects Microsoft’s size, not weaker economics.
The counterweight is real. If component costs stay elevated and AI spending outruns returns, the free cash flow trough deepens and the multiple stays compressed regardless of how strong the top line looks. Hood was direct that supply stays constrained at least through calendar 2026, so the cash-flow pain comes before the recovery. The bull case needs the capex cycle to peak on schedule. The bear case only needs it to slip.

See how Microsoft performs against its peers in TIKR (It’s free!) >>>
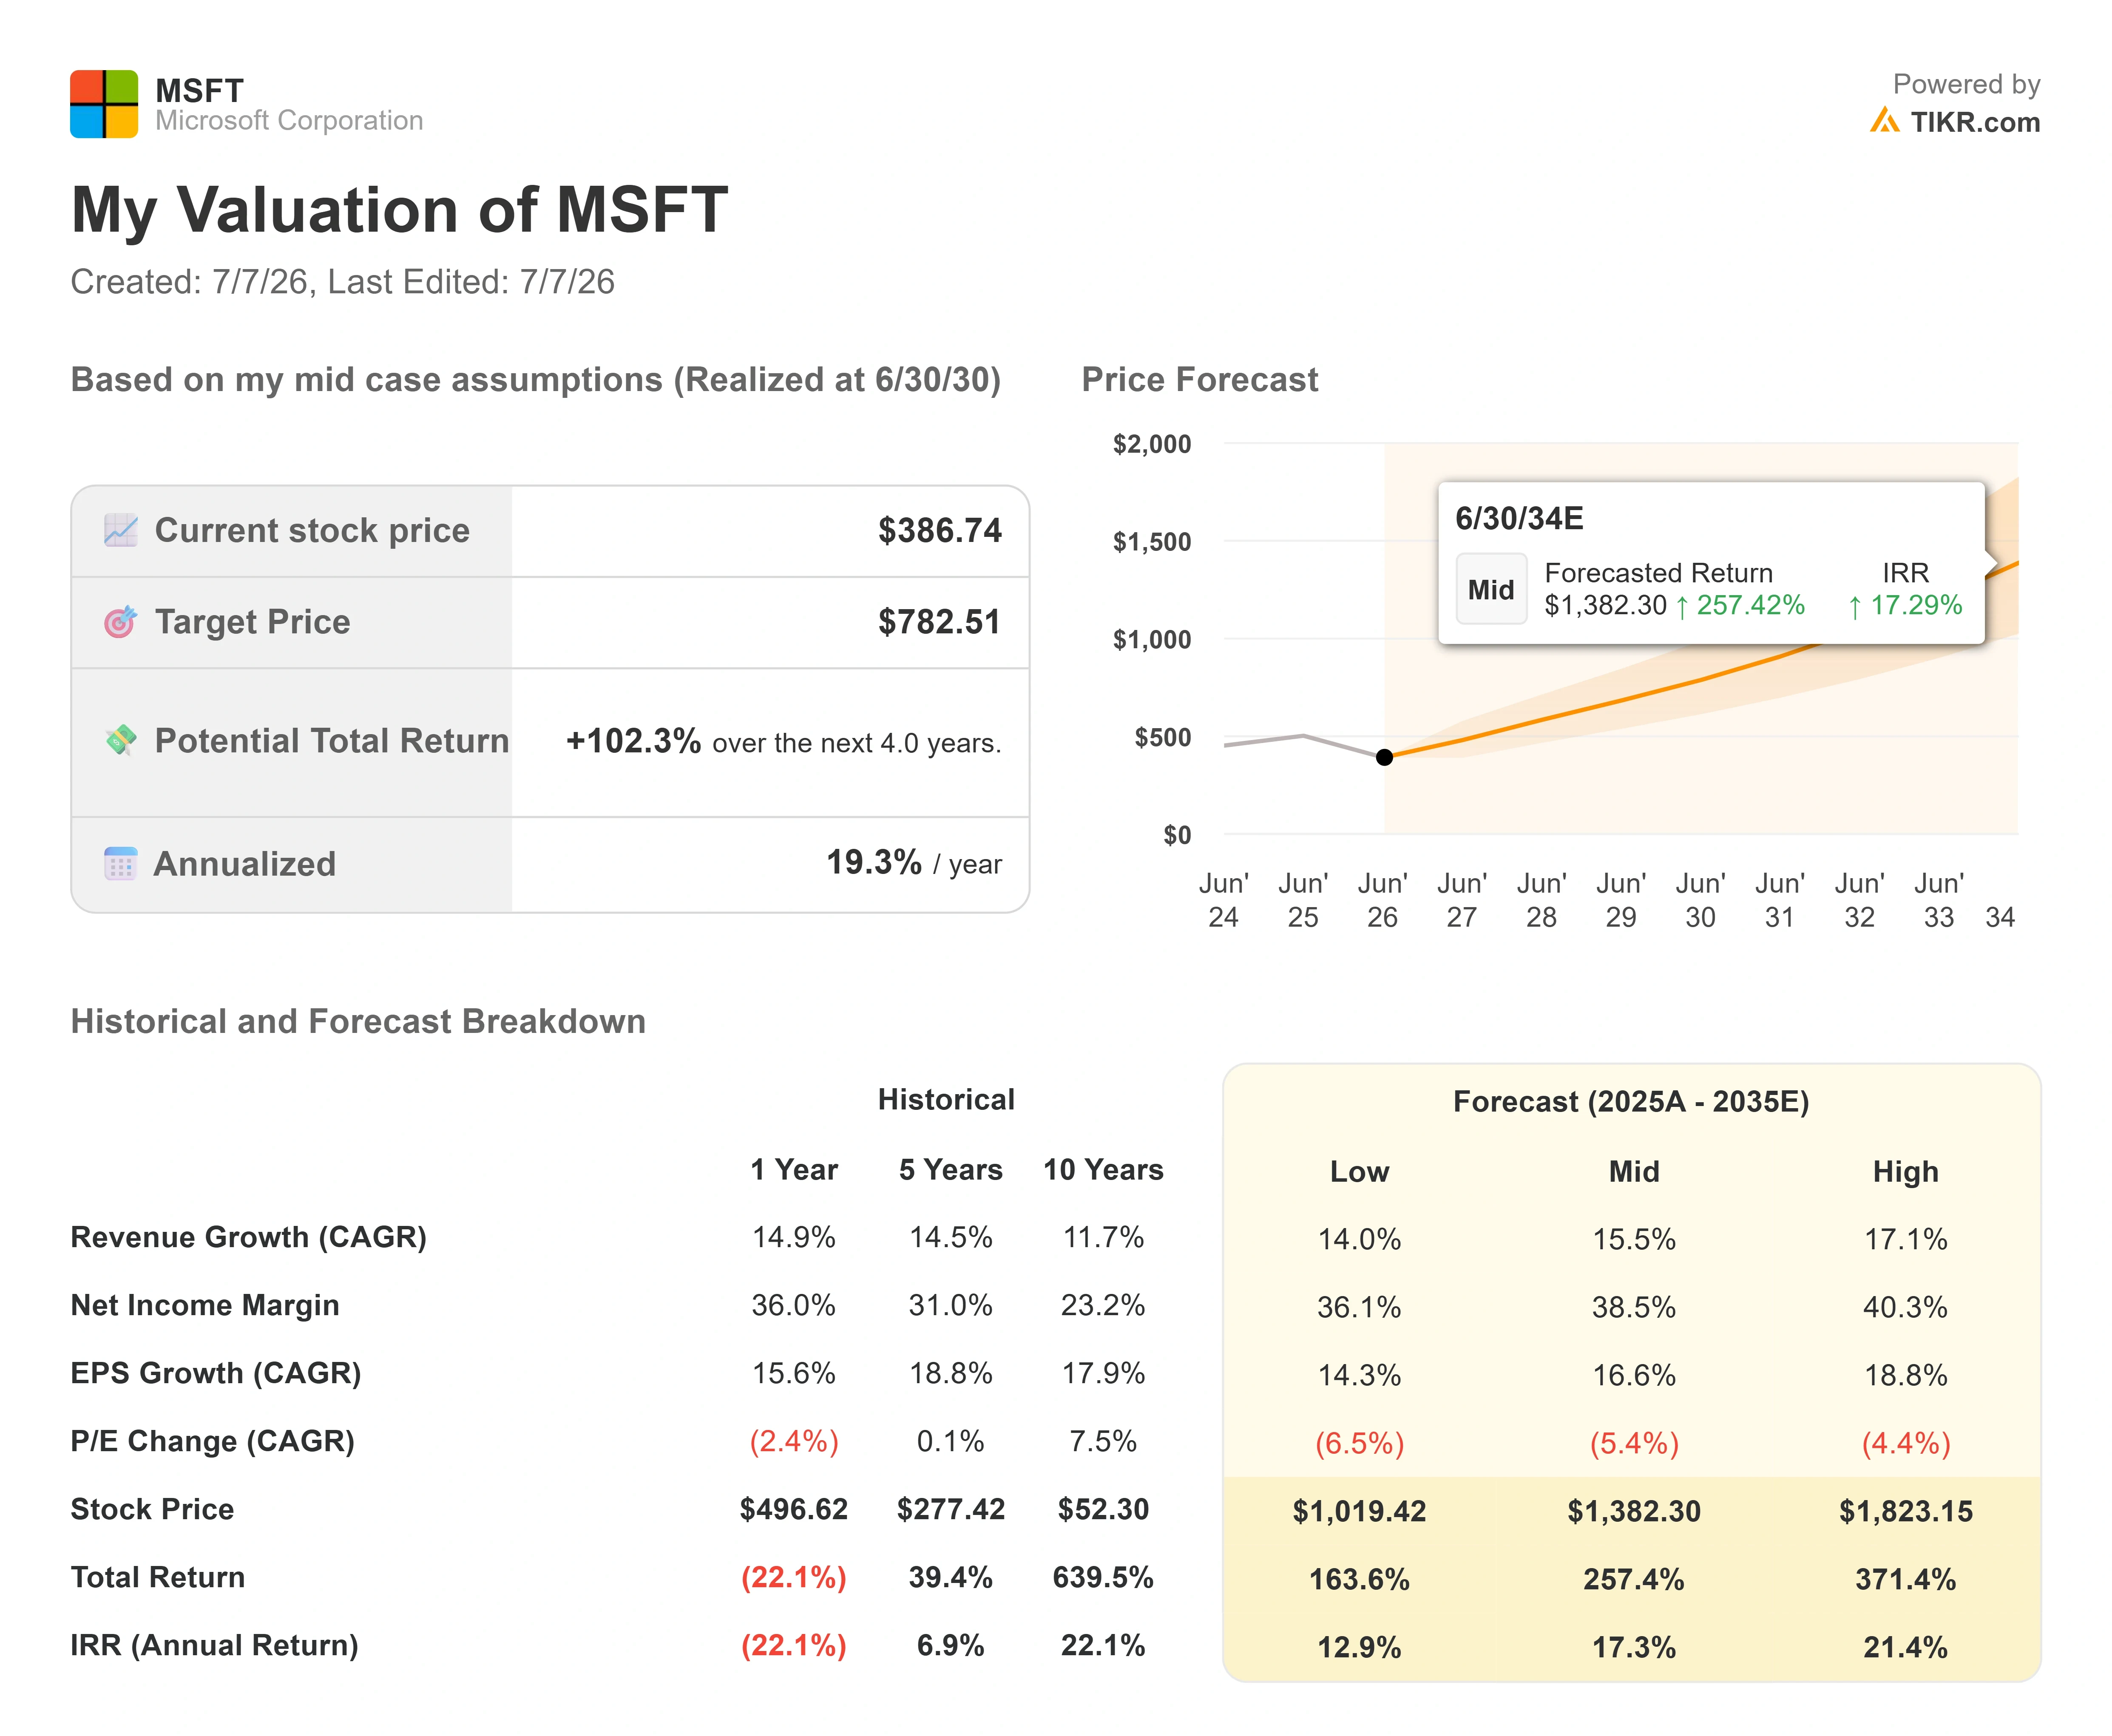
TIKR Advanced Model Analysis
- Current Price: $386.74
- Target Price (Mid): ~$780
- Potential Total Return: ~100% (over about 4 years)
- Annualized IRR: ~19% / year
See analysts’ growth forecasts and price targets for Microsoft stock (It’s free!) >>>
This mid-case is used because it maps to consensus estimates rather than a stretch scenario, and the Street’s own average target of around $560 already implies roughly 45% upside, so even the conservative read points higher.
- Revenue driver 1: Azure taking enterprise cloud share as AI workloads scale against the $627 billion backlog, a shift the Jefferies survey helps quantify.
- Revenue driver 2: Microsoft 365 Copilot deepening monetization as the seat-plus-consumption model matures across 20 million-plus paid seats. The mid-case assumes revenue CAGR of around 16%.
- Margin driver: Operating leverage as the build cycle peaks, lifting net income margin to around 39% from 36% today.
- Primary risk: Timing. If the capex cycle does not peak in calendar 2026, the free cash flow recovery slips, and the multiple stays low.
Upside: if usage-based pricing layers a consumption engine on top of an already massive installed base, earnings compound faster than the Street models.
Downside: if AI spending outpaces returns and memory costs stay elevated, margins compress, and the discount persists.
Conclusion
The single number to watch is Azure constant-currency growth at fiscal Q4 earnings, expected around July 28. Hood guided to 39% to 40%. A print inside or above that range, paired with the first sequential improvement in free cash flow margin, is the concrete signal that the infrastructure cycle has peaked and the market has been discounting a recovery it can now see. A miss, or another leg up in capex guidance without matching revenue, keeps the bear case alive and the discount intact. Everything else, the backlog, the CIO survey, the Haleon deal, points in one direction. July 28 is when the receipts arrive.
See what stocks billionaire investors are buying so you can follow the smart money with TIKR.
Should You Invest in Microsoft?
The only way to really know is to look at the numbers yourself. TIKR gives you free access to the same institutional-quality financial data that professional analysts use to answer exactly that question.
Pull up Microsoft, and you’ll see years of historical financials, what Wall Street analysts expect for revenue and earnings in the quarters ahead, how valuation multiples have moved over time, and whether price targets are trending up or down.
You can build a free watchlist to track Microsoft alongside every other stock on your radar. No credit card required. Just the data you need to decide for yourself.
Analyze Microsoft on TIKR Free →
Looking for New Opportunities?
- See what stocks billionaire investors are buying so you can follow the smart money.
- Analyze stocks in as little as 5 minutes with TIKR’s all-in-one, easy-to-use platform.
- The more rocks you overturn… the more opportunities you’ll uncover. Search 100K+ global stocks, global top investor holdings, and more with TIKR.
Disclaimer:
Please note that the articles on TIKR are not intended to serve as investment or financial advice from TIKR or our content team, nor are they recommendations to buy or sell any stocks. We create our content based on TIKR Terminal’s investment data and analysts’ estimates. Our analysis might not include recent company news or important updates. TIKR has no position in any stocks mentioned. Thank you for reading, and happy investing!