


Key Takeaways
- TotalEnergies yields 4.7% against ExxonMobil’s 2.6%, and its dividend grew 4.9% a year from fiscal 2020 to fiscal 2025, against 2.8% for Exxon.
- Over 10 years, the income comes down to the starting yield and whether each company can keep raising at its 5-year pace.
- Both dividends are well-covered today, at 56% of free cash flow for Exxon and 51% for TotalEnergies over the twelve months to June 30, 2026.
- Both took 73% of free cash flow in fiscal 2025, so free cash flow in each company’s next results is the number to watch.
Oil majors have spent 2026 producing through a closed Strait of Hormuz, and both ExxonMobil (XOM) and TotalEnergies (TTE) have had Middle East output knocked offline.
Their dividends have held up anyway. TotalEnergies raised its interim dividend 5.9% on April 29, from €0.85 to €0.90 a share, and Exxon declared another $1.03-a-share quarterly dividend with its second-quarter results on July 31.
So if you put $10,000 into one of them today, which pays you more over the next 10 years?
| Metric | ExxonMobil (XOM) | TotalEnergies (TTE) |
|---|---|---|
| Dividend yield | 2.6% | 4.7% |
| Current dividend | $4.12 a year | $3.98 a year (set in euros, at today’s exchange rate) |
| Dividend growth, fiscal 2020–2025 | 2.8% a year | 4.9% a year |
| Cash dividend payout ratio, TTM to June 30, 2026 | 56% | 51% |
| Net debt/EBITDA, LTM | 0.44x | 0.79x |
| Interest coverage, LTM | 52x | 10.2x |
| Forward P/E, NTM | 12.7x | 7.9x |
Exxon’s oilfields are growing faster than its dividend
Exxon’s growth is coming from two places. In the Permian, production hit a record of more than 1.8 million oil-equivalent barrels a day in the second quarter of 2026, and management plans 9% annual growth there through 2030. In Guyana, a fifth production vessel is on plan to start up in the fourth quarter, adding 250,000 barrels a day of capacity.
The dividend has grown more slowly: 2.8% a year from fiscal 2020 to fiscal 2025, from $3.48 to $4.00 a share. Meanwhile, free cash flow fell from $58.4 billion in fiscal 2022 to $23.6 billion in fiscal 2025, while dividends paid rose from $14.9 billion to $17.2 billion.

…which took the cash dividend payout ratio to a stretched 73% in fiscal 2025. A strong second quarter of 2026, with $17.2 billion of free cash flow against $4.3 billion of dividends, helped bring the ratio back to a comfortable 56% over the twelve months to June 30.
The main risk is the Middle East. On its May call, management laid out a three-to-five-year repair timeline for a damaged Qatar LNG train.
TotalEnergies pays more, and has raised it faster
TotalEnergies took a bigger hit from the same conflict. On its April call, management said shut-in production in Qatar, Iraq and offshore UAE made up approximately 15% of its oil and gas output. By July, it put the impact closer to 8% to 9%.
Its growth is in LNG and power, with Mozambique LNG back under construction, plus Namibia, which CEO Patrick Pouyanné called “a very important hub for future growth.”
Management called the payout “the sacrosanct dividend” in April. In its own currency, it grew 4.9% a year from fiscal 2020 to fiscal 2025. The cash behind it followed the same path as Exxon’s: free cash flow fell from $33.7 billion in fiscal 2022 to $11.6 billion in fiscal 2025, while dividends paid rose from $7.60 billion to $8.42 billion…
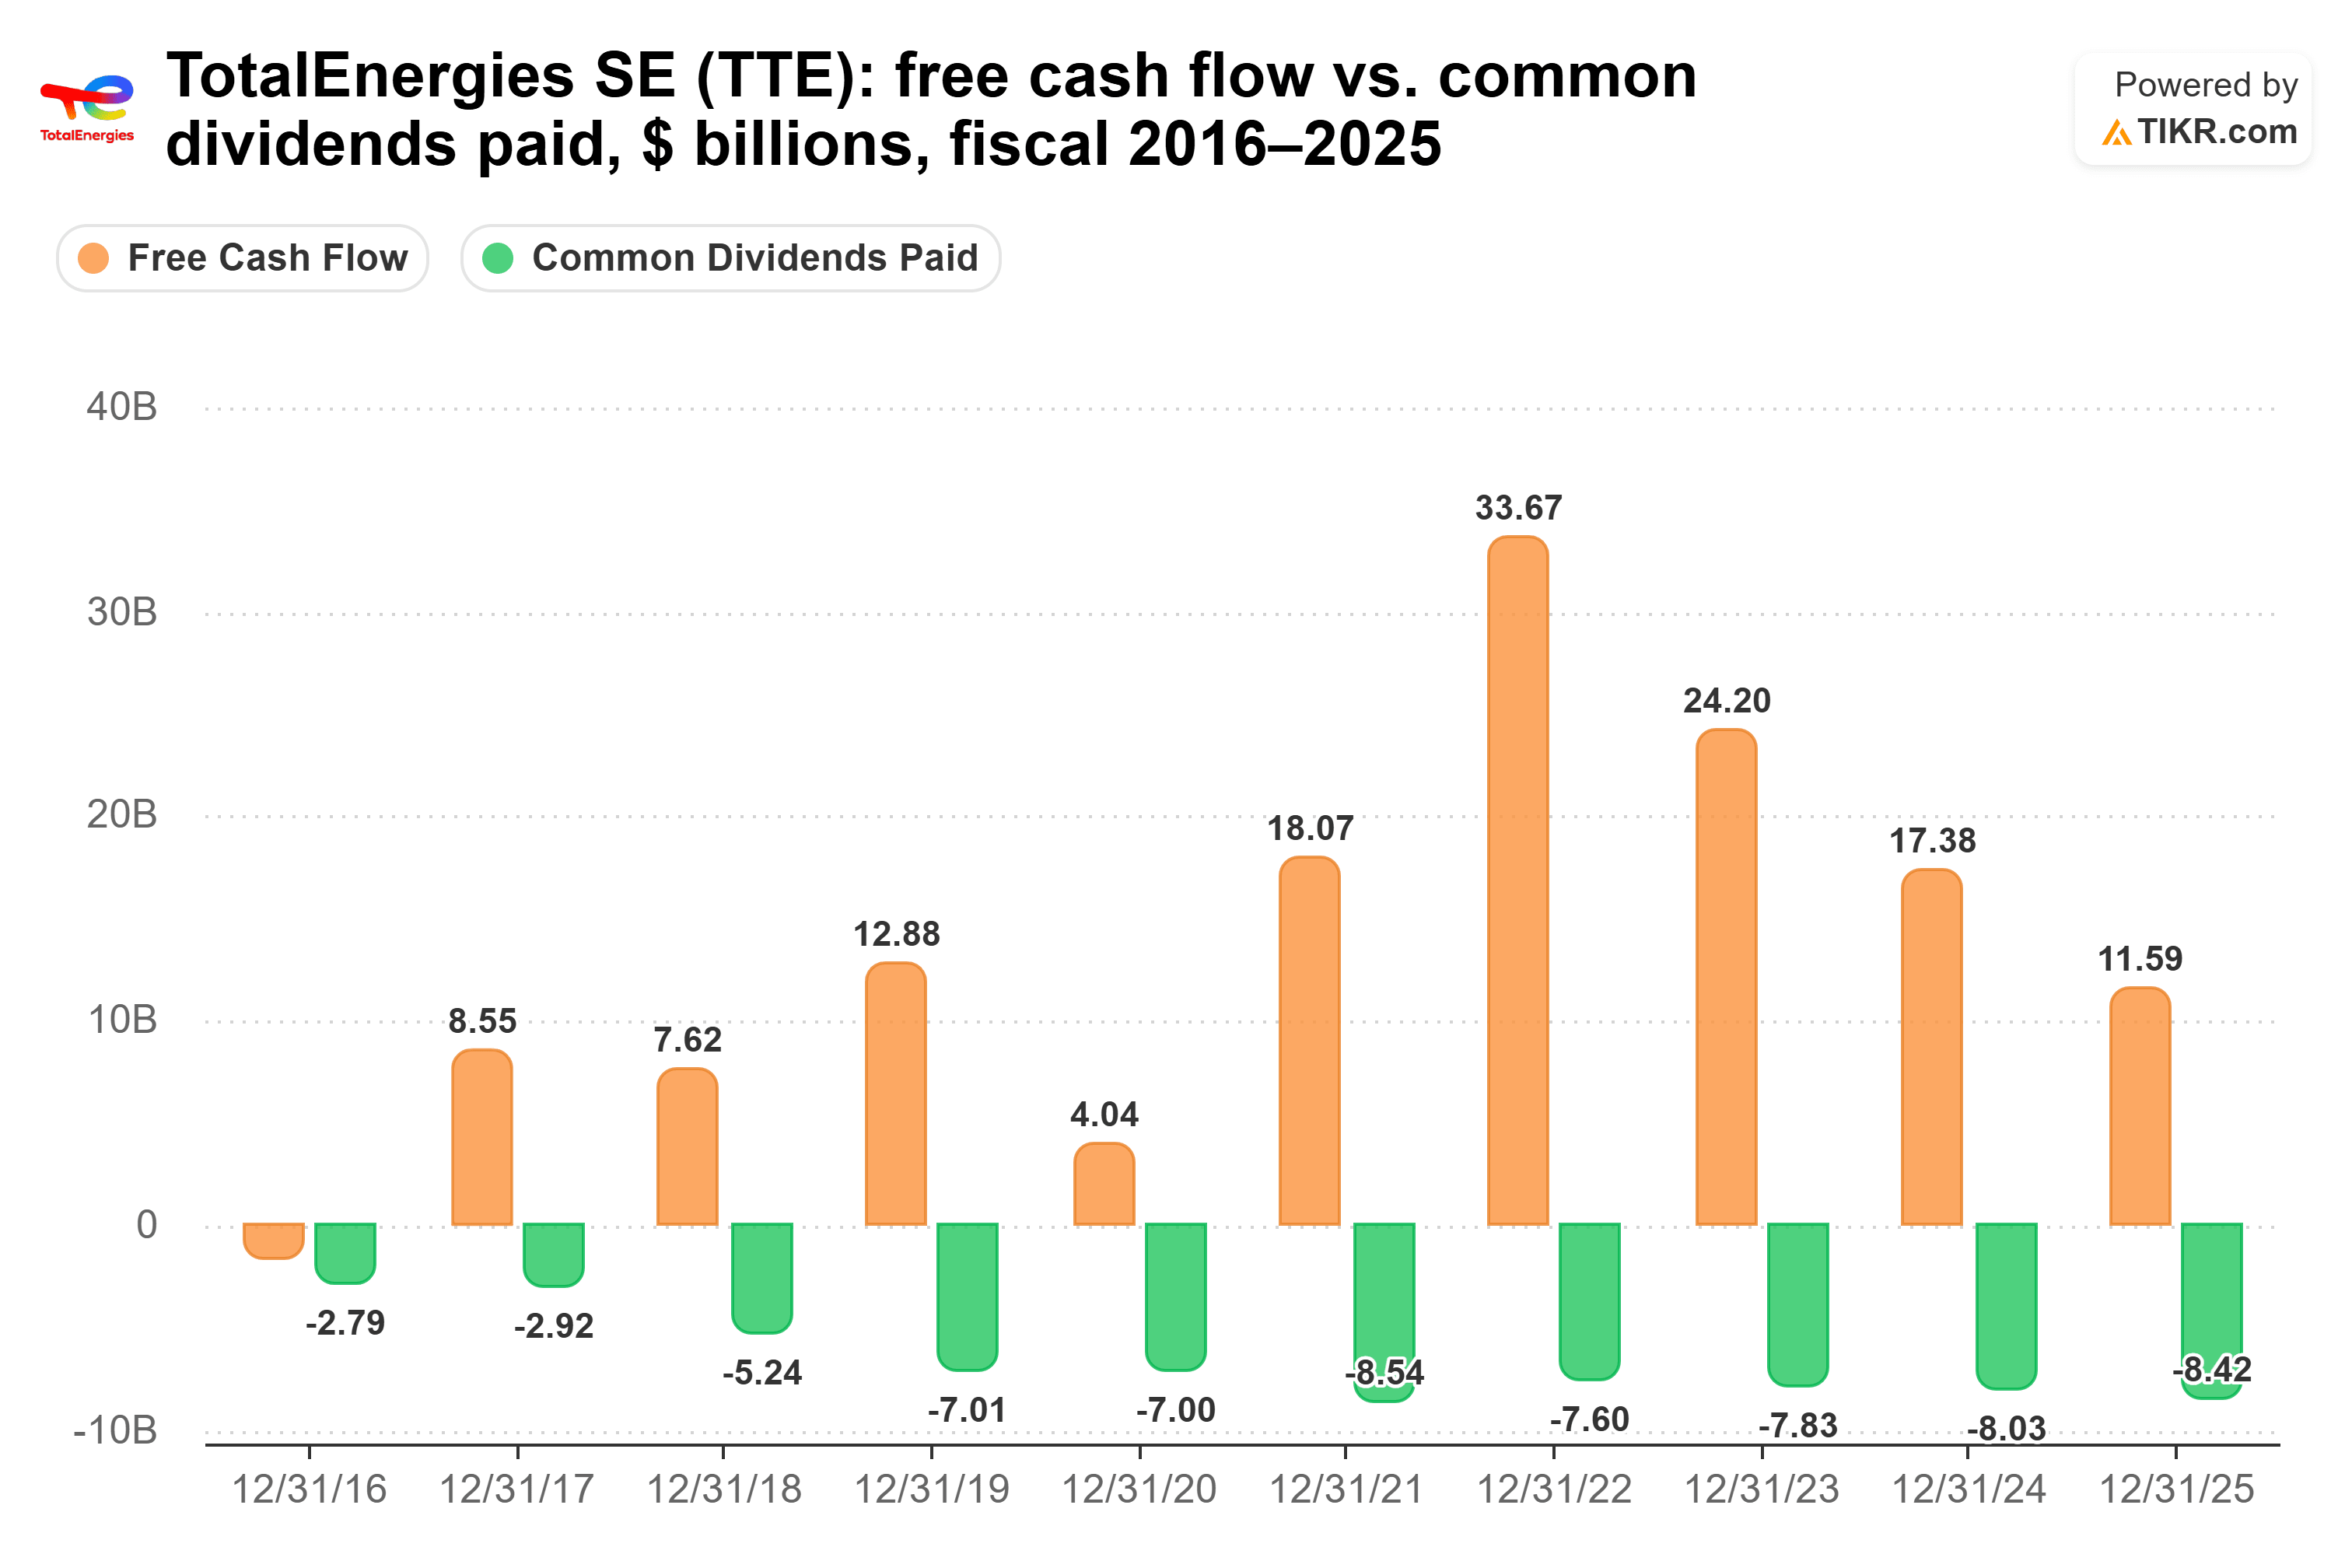
…a stretched 73% payout in fiscal 2025. Over the twelve months to June 30, 2026, the ratio was back to a comfortable 51%.
The risk is the balance sheet. TotalEnergies’ net debt is 0.79x EBITDA, with interest coverage of 10.2x. Both are healthy, but both are weaker than Exxon’s, and because the dividend is set in euros, what a US holder receives in dollars moves with the exchange rate.
So which dividend wins?
TotalEnergies pays you more over the next 10 years, by a wide margin. At each company’s 5-year growth rate, $10,000 in TotalEnergies today pays about $5,871 over the decade, against about $2,957 for Exxon. That’s about $2,914 more, and at those rates Exxon’s income never catches up. (TotalEnergies’ figure is worked out in its own currency.)
At each dividend’s latest pace, the gap widens to about $12,604 against $3,146. I wouldn’t count on that, though. TotalEnergies’ dividend per share rose 20.7% in fiscal 2025, but its latest raise was 5.9%.
The 5-year rate looks sustainable. It’s below that latest raise, and a 51% payout leaves room to keep raising.
Exxon’s case is strong. Its balance sheet is sturdier, with net debt at 0.44x EBITDA and 52x interest coverage. TIKR’s figures show 26 fiscal years in a row of higher dividends per share through fiscal 2025, and the Permian and Guyana give it growth to fund future raises. But when the question is income, a yield nearly twice as high that also grows faster is more than Exxon can make up in a decade.
Of course, both dividends took 73% of free cash flow as recently as fiscal 2025. If free cash flow slips back to those levels, TotalEnergies’ raises get harder to keep up.
So what is TotalEnergies stock actually worth?
TIKR lets you forecast the future price of any stock in less than a minute. Just enter a few assumptions into TIKR’s valuation model and see what TotalEnergies could be worth. Start from Wall Street consensus estimates, or adjust the inputs to reflect your own view of the business. It’s free to use.
Disclaimer:
Please note that the articles on TIKR are not intended to serve as investment or financial advice from TIKR or our content team, nor are they recommendations to buy or sell any stocks. We create our content based on TIKR Terminal’s investment data and analysts’ estimates. Our analysis might not include recent company news or important updates. TIKR has no position in any of the stocks mentioned. Thank you for reading, and happy investing!


