


Key Takeaways
- Chevron generated $18.1 billion of free cash flow in the second quarter of 2026, and TotalEnergies raised its interim dividend 5.9% to €0.90 a share in April.
- Both companies paid out 51% of their free cash flow as dividends over the twelve months to June 30, 2026.
- TotalEnergies yields 4.7% against Chevron’s 3.5%, while Chevron grew its dividend faster, at 5.8% a year from fiscal 2020 to fiscal 2025 against 4.9%.
- Both dividends were tighter in fiscal 2025, taking 77% of Chevron’s free cash flow and 73% of TotalEnergies’.
Chevron (CVX) just showed what a strong quarter does for an oil major’s dividend math: $18.1 billion of free cash flow in the second quarter of 2026, up from $4.9 billion a year before.
Its European rival TotalEnergies (TTE) has been just as loud about its payout. In April, it raised its interim dividend 5.9% to €0.90 a share, putting priority on what Chairman and CEO Patrick Pouyanné calls “the sacrosanct dividend.”
So if you’re buying one oil major for income, which is the better dividend stock?
| Metric | Chevron (CVX) | TotalEnergies (TTE) |
|---|---|---|
| Dividend yield | 3.5% | 4.7% |
| Dividend growth, fiscal 2020–2025 | 5.8% a year | 4.9% a year |
| Cash dividend payout ratio (TTM to June 30, 2026) | 51% | 51% |
| Net debt / EBITDA (LTM) | 0.56x | 0.79x |
| Interest coverage (LTM) | 18.9x | 10.2x |
| Forward P/E (NTM) | 12.5x | 7.9x |
Chevron: Hess is paying its way
Net production rose 20% in the second quarter of 2026, to 4.07 million barrels of oil equivalent a day from 3.40 million a year before. Hess and the Permian drove the increase. Chairman and CEO Michael Wirth says the Hess assets’ free cash flow “has been roughly double the incremental dividends and accretive to shareholders on a per share basis.”
Over the twelve months to June 30, 2026, Chevron’s $13.86 billion of dividends took a well-covered 51% of its $27.01 billion of free cash flow. It pays $1.78 a share each quarter and says it has “grown it for the 39th consecutive year.”
Fiscal 2025 was tighter, with dividends taking 77% of free cash flow. In fiscal 2016 and fiscal 2020, free cash flow fell short of the dividend.

…and Chevron kept raising it anyway.
Management hit its $3 billion run-rate cost savings target six months early. It also expects adjusted free cash flow to grow more than 10% a year on average through 2030, at flat commodity prices lower than today’s. The risk is the Middle East conflict, which has curtailed Chevron’s production in the Partitioned Zone between Saudi Arabia and Kuwait.
TotalEnergies: same coverage, bigger check
TotalEnergies matches Chevron’s coverage exactly. Over the twelve months to June 30, 2026, its $8.94 billion of dividends took 51% of $17.42 billion of free cash flow.
It’s growing in LNG, integrated power and Namibia, and the Middle East has cut the other way. On the first-quarter call, Pouyanné said production shut down in Qatar, Iraq and offshore UAE made up about 15% of the company’s oil and gas output. By the July call, he put the impact nearer 8% to 9%.
The cushion has thinned since fiscal 2022. Free cash flow fell from $33.7 billion that year to $11.6 billion in fiscal 2025, while dividends paid rose from $7.60 billion to $8.42 billion.

…though the record backs up the “sacrosanct” talk. In fiscal 2020, free cash flow of $4.04 billion fell short of $7.00 billion in dividends, and TotalEnergies paid them anyway.
TotalEnergies sets its dividend in euros, so the dollar amount US holders collect moves with the exchange rate. The main risk is the Strait of Hormuz blockade, which has disrupted its oil, LNG and product exports.
So which dividend wins?
TotalEnergies is the better dividend stock. With coverage identical at 51%, it simply pays more: $10,000 at its 4.7% yield brings in $470 a year, against $350 from Chevron.
Chevron’s faster raises won’t close that gap anytime soon. At their 5-year rates, the $10,000 would pay about $720 from TotalEnergies in year 10, a 7.2% yield on your original cash. Chevron would pay about $581, or 5.8%. At those rates, Chevron’s income wouldn’t pass TotalEnergies’ for more than 30 years.
You aren’t paying up for that income, either. TotalEnergies trades at 7.9x forward earnings.
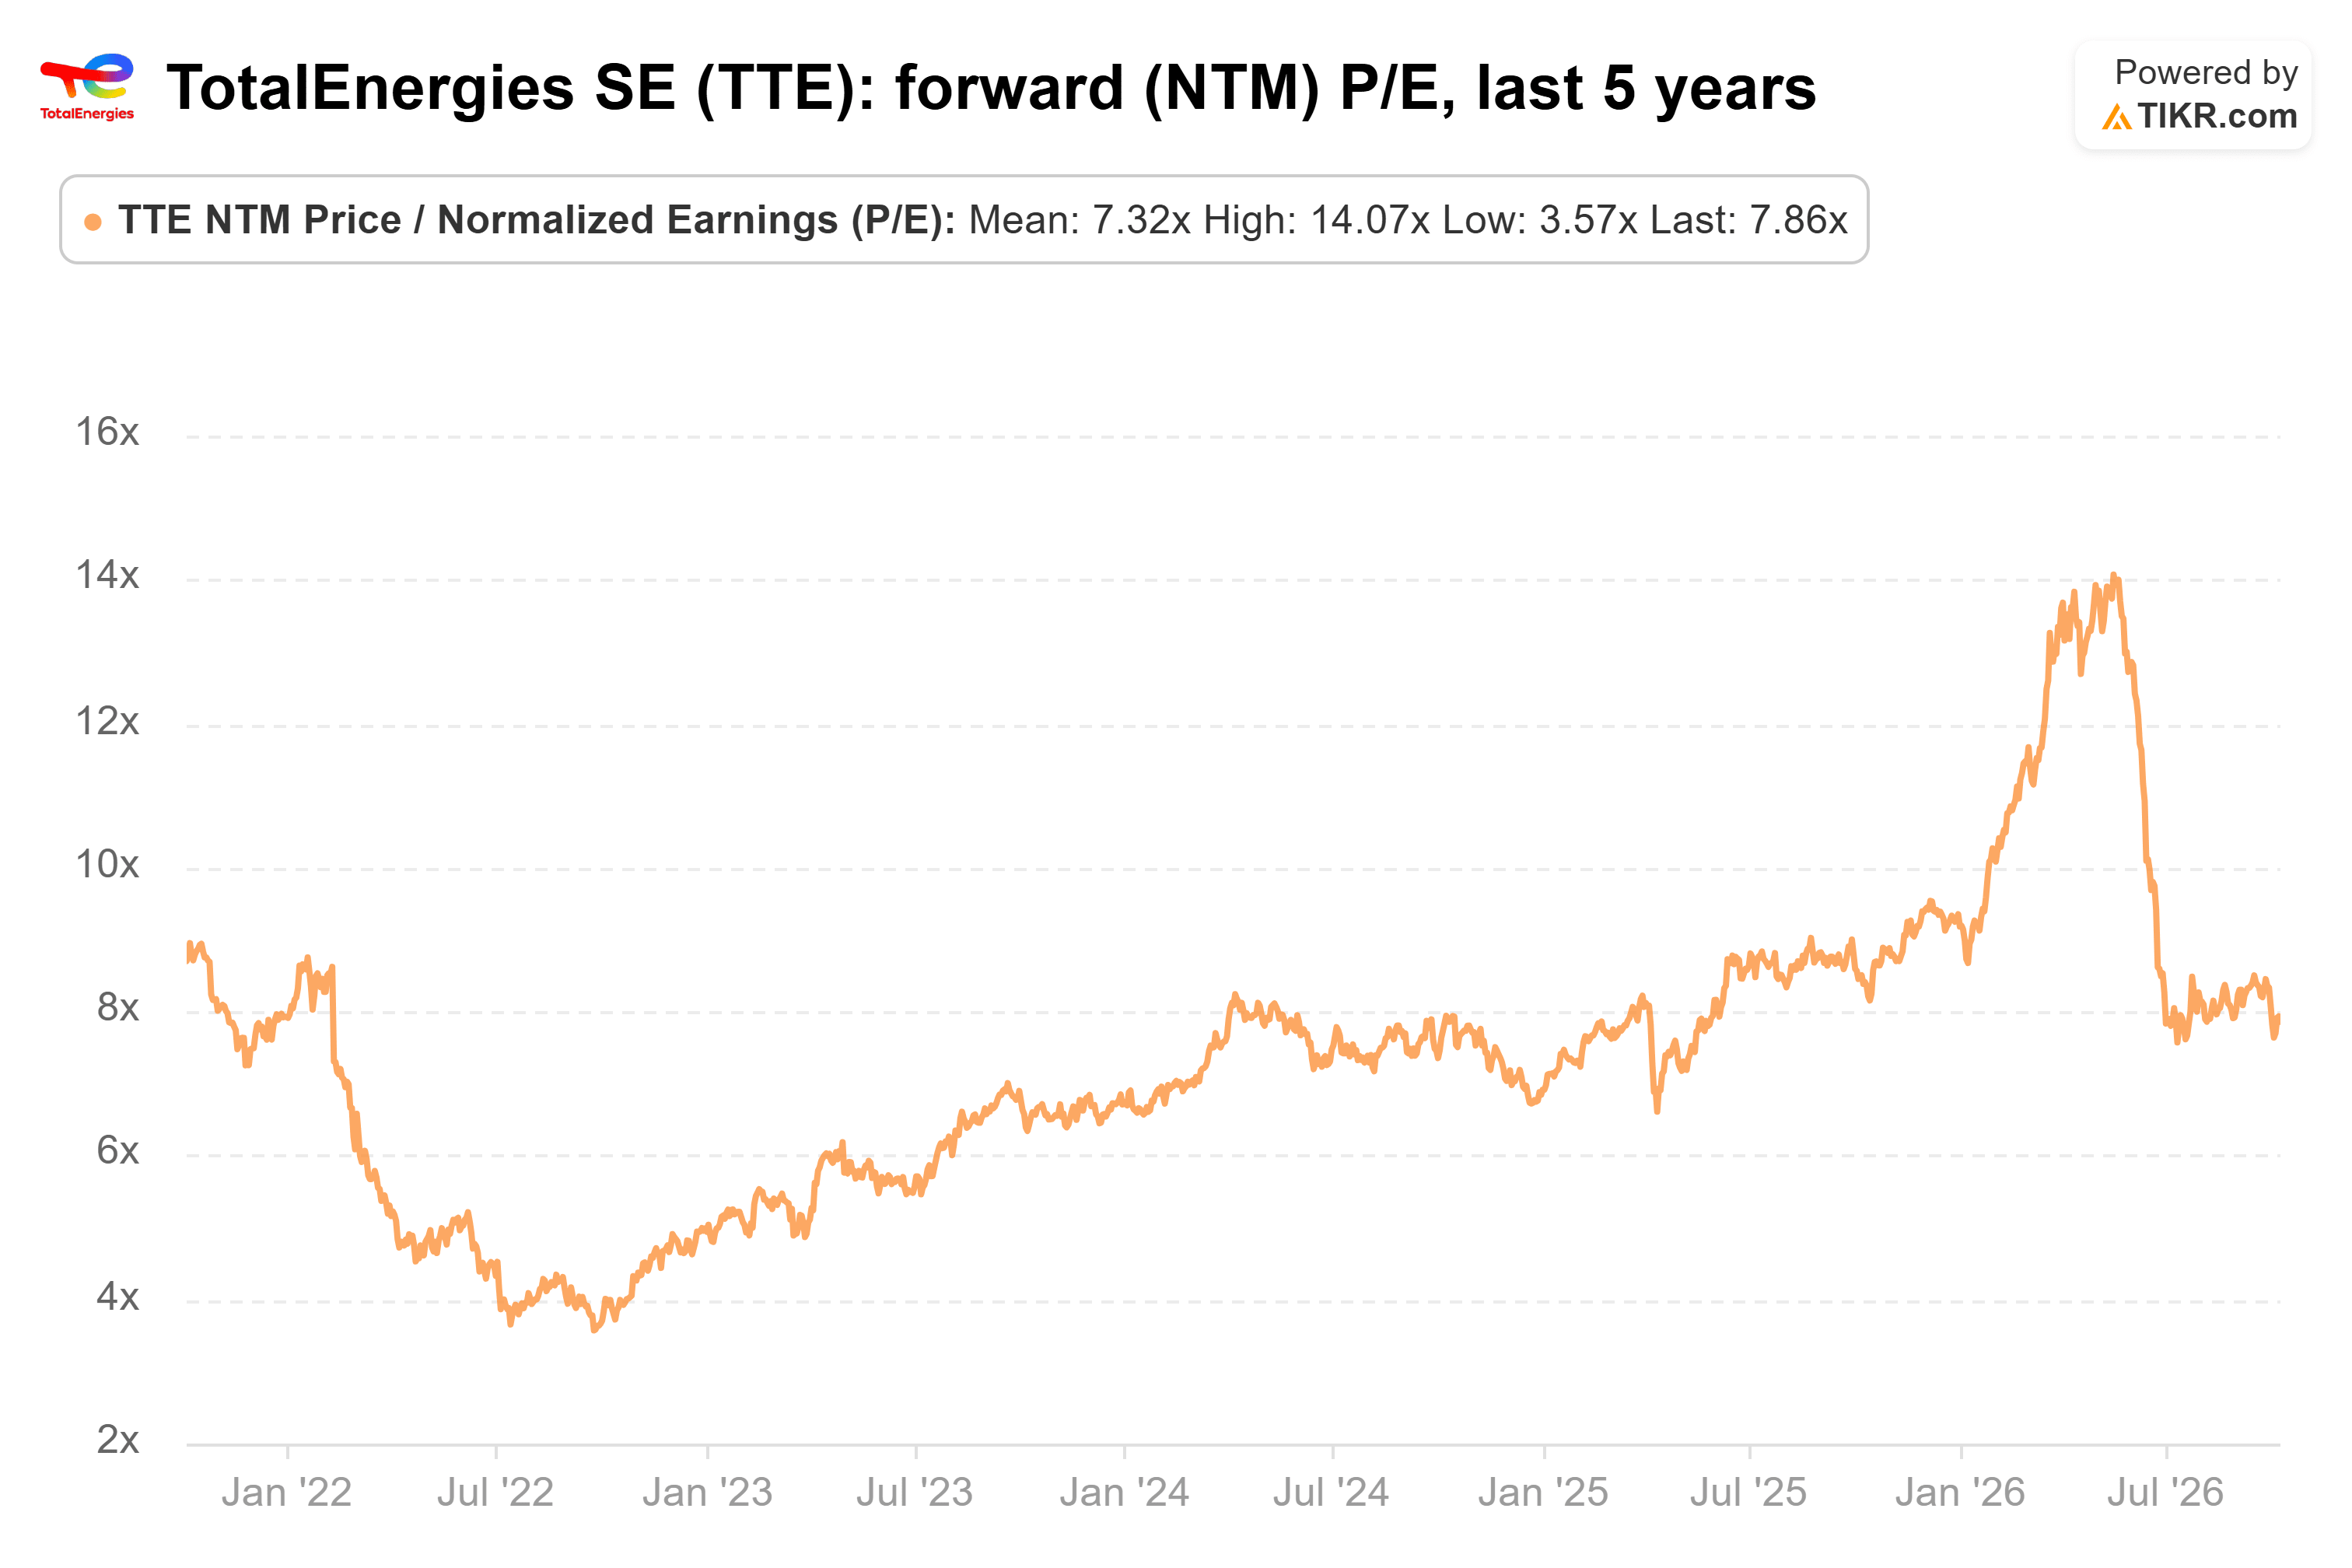
…a touch above its five-year average of 7.3x, and well below the 14.1x it hit in May.
Chevron’s case is a strong one. It has raised its dividend 39 years running, carries less debt, covers its interest 18.9x against 10.2x, and its production is growing fast. Still, when both dividends are equally well covered, I’d rather collect the bigger check.
Of course, both payouts took more than 70% of free cash flow in fiscal 2025. If cash flow slides back to those levels, Chevron’s stronger balance sheet would count for more.
So what is TotalEnergies stock actually worth?
TIKR lets you forecast the future price of any stock in less than a minute. Just enter a few assumptions into TIKR’s valuation model and see what TotalEnergies could be worth. Start from Wall Street consensus estimates, or adjust the inputs to reflect your own view of the business. It’s free to use.
Disclaimer:
Please note that the articles on TIKR are not intended to serve as investment or financial advice from TIKR or our content team, nor are they recommendations to buy or sell any stocks. We create our content based on TIKR Terminal’s investment data and analysts’ estimates. Our analysis might not include recent company news or important updates. TIKR has no position in any of the stocks mentioned. Thank you for reading, and happy investing!


