

What is the EV/Revenue Ratio?
The EV/Revenue ratio, or the Enterprise Value-to-Revenue ratio, is a particularly useful valuation multiple when analyzing companies that aren’t yet profitable, such as early-stage tech companies or businesses with inconsistent earnings.
By focusing on revenue, the EV/Revenue ratio offers a snapshot of how much investors will pay for each dollar of the company’s sales, regardless of the business’s current profitability.
The EV/Revenue ratio considers the company’s debt, which can give a more holistic view of a company’s valuation.
How Do You Calculate EV/Revenue?
The EV/Revenue ratio divides the business’s Enterprise Value (EV) by the company’s annual revenue:
EV / Revenue = Enterprise Value / Revenue
Where:
- Enterprise Value (EV) = Market Capitalization + Total Debt – Cash and Cash Equivalents + Preferred equity + Minority Interest
- Revenue = Total revenue reported over the past 12 months (for trailing LTM EV/Revenue) or projected revenue for the next 12 months (for forward NTM EV/Revenue).
Example Calculation:
As an example, if this was Google’s Enterprise Value and projected revenue for the next 12 months:
- Enterprise Value (EV) = $1,924 billion
- NTM Revenue = $367 billion
Then Google’s NTM EV/Revenue would be 5.2x
NTM EV/Revenue = $1,924 billion / $367 billion
NTM EV/Revenue = 5.2x
Value stocks quicker with TIKR >>>
Forward vs. Trailing EV/Revenue
The EV/Revenue ratio can be calculated on both a trailing (LTM) basis and a forward (NTM) basis. It’s important to understand the difference between these two measures:
- LTM (Last Twelve Months) EV/Revenue: This ratio uses the trailing revenue from the previous 12 months. This metric is helpful because it provides insights into how the business is valued based on actual, realized revenue.
- NTM (Next Twelve Months) EV/Revenue: This ratio uses the company’s projected or forward revenue for the next 12 months, offering a forward-looking perspective. This metric offers a glimpse into how investors are pricing in future growth expectations for a company. Generally, we prefer to use NTM figures.
Example: Google’s NTM vs. LTM EV/Revenue Ratios
Google’s LTM EV/Revenue ratio is 5.9x, based on its last twelve months of revenue totaling $328.3 billion. In contrast, Google’s NTM EV/Revenue ratio is 5.3x, based on Google’s projected revenue for the next 12 months of approximately $367.1 billion:
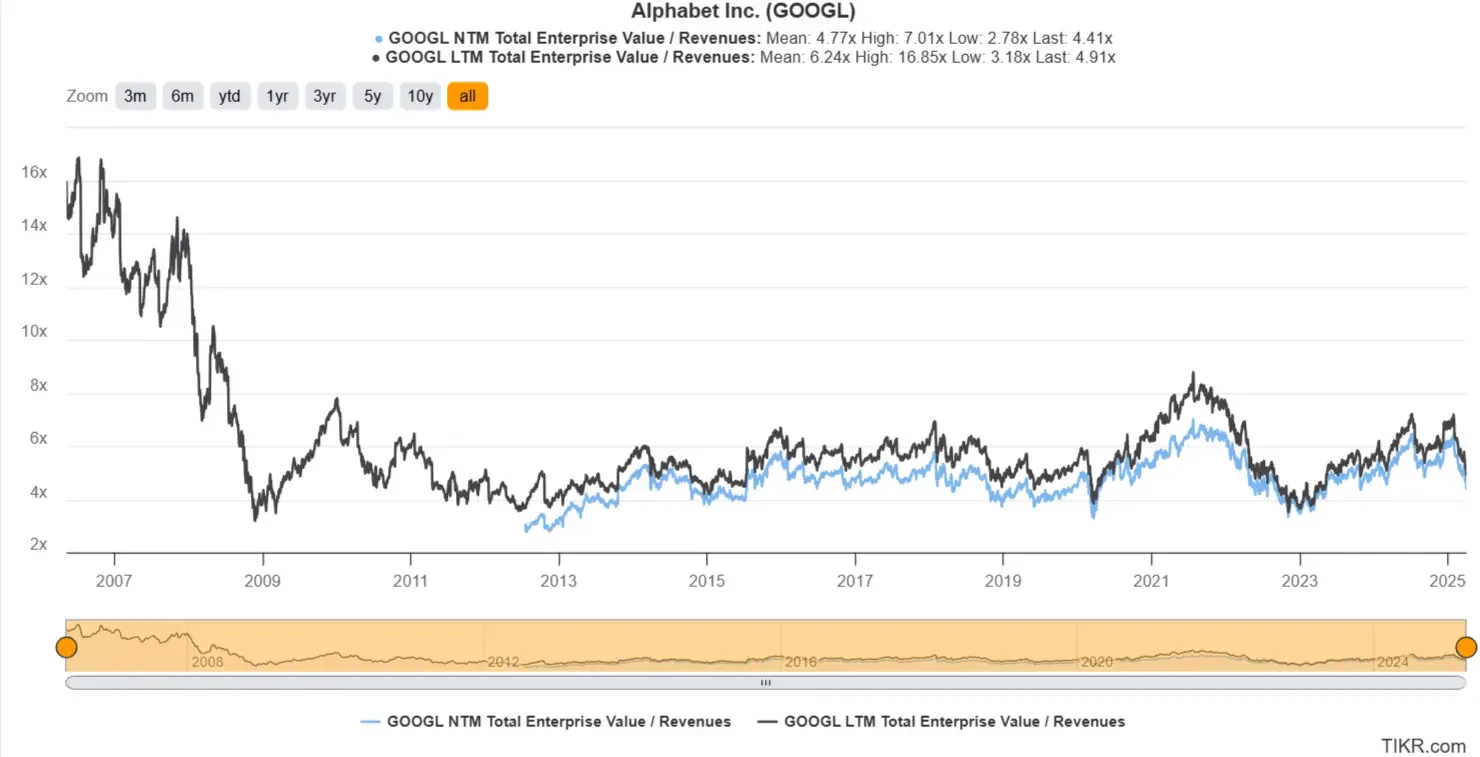
Since analysts expect that Google’s revenue will grow next year, Google has a lower NTM EV/Revenue ratio than its LTM ratio, making the company look relatively more affordable on a forward-looking basis.
We generally prefer to use NTM valuation multiples because examining a company’s next 12-month estimates helps investors to better evaluate a company’s valuation based on its future growth expectations.
What is a Good EV/Revenue?
Determining what constitutes a “good” EV/Revenue ratio depends on several factors, including the company’s profitability, industry, growth prospects, and current market conditions. Here are some factors that impact a company’s EV/Revenue ratio:
- Industry Comparison: In some sectors, such as technology or pharmaceuticals, companies might have high EV/Revenue ratios due to high growth expectations. For example, a tech company with an EV/Revenue ratio of 10 might be considered reasonably valued if it’s rapidly growing its revenue. On the other hand, in more stable, low-growth industries like utilities, an EV/Revenue ratio of 3 might be considered high.
- Growth Expectations: A higher EV/Revenue ratio often implies that the market expects significant revenue growth. A high ratio might be justified if the company is expected to dominate its market and grow its revenue significantly.
- Profitability: Companies with higher profitability often command higher EV/Revenue ratios because they generate more income from each dollar they make in revenue. When a company consistently delivers strong profit margins, investors are typically willing to pay a premium, leading to a higher EV/Revenue multiple. Conversely, companies with lower profitability might trade at lower EV/Revenue multiples.
- Economic Cycle: The EV/Revenue ratio changes with the market’s ups and downs. The ratio usually rises in bull markets because investors are generally willing to pay more for stocks. On the other hand, the ratio tends to drop during bear markets as investors lose confidence and approach stocks with more caution.
Analyze stocks quicker with TIKR >>>
How the EV/Revenue Ratio Shows Whether a Stock is Over/Undervalued
The EV/Revenue ratio can be a valuable tool for determining whether a stock is overvalued or undervalued:
Overvalued:
- If a stock has a significantly higher EV/Revenue ratio than its 5-year average or compared to its industry peers, it may be overvalued, especially if its revenue or margin growth doesn’t justify trading at a premium. This high ratio often assumes the company can sustain or accelerate its revenue growth, but if it fails to meet these expectations, the stock price could drop significantly.
Example: Suppose a company in the healthcare sector has an EV/Revenue ratio of 15x, while its peers average around 5x. If the company’s revenue growth rate is in line with or lower than its peers and has similar margins, this could indicate that the stock is overvalued, as the market may be pricing in unrealistic growth expectations.
Undervalued:
- If a stock has a lower EV/Revenue ratio than its 5-year average or its industry peers, it might be undervalued, especially if it has strong revenue growth prospects, margin growth prospects or operates in an industry with high barriers to entry. Additionally, companies in cyclical industries often have low trailing ratios during downturns, presenting attractive opportunities for investors anticipating a market rebound.
Example: Consider a software company with an EV/Revenue ratio of 4x, while its competitors have an average ratio of 10. If this company is expected to see decent revenue growth and profitability compared to its peers, the low ratio might indicate that the stock is undervalued.
What is a High EV/Revenue Ratio?
A “high” EV/Revenue ratio is relative, as it varies across industries and depends on a company’s growth expectations and profitability. However, a stock might be overvalued if it is trading well above its 5-year average EV/Revenue multiple or if its multiple has increased significantly in the past year without a corresponding increase in growth or profitability. If the company is priced significantly higher than its usual valuation levels without an increase in growth or profitability expectations, the stock may be overvalued.
What is a Low EV/Revenue Ratio?
Again, it’s difficult to pinpoint a “low” EV/Revenue ratio because different stocks naturally trade at different ratios depending on their expected growth, profitability, and more. However, it’s generally a sign that a company might be undervalued if a stock has strong profitability and growth forecasts, but the company is trading below its 5-year or 1-year average EV/Revenue multiple. This might indicate that the company is more undervalued than usual.
Find undervalued stocks with low EV/Revenue ratios with TIKR >>>
FAQ Section
What is the EV/Revenue multiple?
The EV/Revenue multiple compares a company’s enterprise value (EV) to its revenue. It is used to assess how much investors are willing to pay for each dollar of revenue generated by the company.
How is the EV/Revenue multiple calculated?
The EV/Revenue multiple is calculated by dividing enterprise value by total revenue. The formula is:
EV/Revenue = Enterprise Value / Revenue
When is the EV/Revenue multiple most useful?
The EV/Revenue multiple is most useful when evaluating early-stage or high-growth companies that may not yet be profitable. It helps investors compare valuations without relying on earnings, which may be negative or inconsistent.
How does the EV/Revenue multiple differ from the Price/Sales ratio?
The EV/Revenue multiple includes both debt and equity in the valuation, while the Price/Sales ratio considers only market capitalization. This makes EV/Revenue a more comprehensive metric when comparing companies with different capital structures.
What is considered a high or low EV/Revenue multiple?
A high EV/Revenue multiple may indicate strong growth expectations or market optimism, while a low multiple could suggest undervaluation or weaker growth prospects. Interpretation depends on industry norms and the company’s financial outlook.
TIKR Takeaway
The EV/Revenue ratio is a helpful valuation metric showing how much investors pay for each dollar of a company’s revenue.
This ratio is particularly useful for evaluating companies with varying profitability, such as early-stage tech stocks.
The TIKR Terminal offers industry-leading financial data on over 100,000 stocks, so if you’re looking to find the best stocks to buy for your portfolio, you’ll want to use TIKR!
Disclaimer:
Please note that the articles on TIKR are not intended to serve as investment or financial advice from TIKR or our content team, nor are they recommendations to buy or sell any stocks. We create our content based on TIKR Terminal’s investment data and analysts’ estimates. We aim to provide informative and engaging analysis to help empower individuals to make their own investment decisions. Neither TIKR nor our authors hold positions in any of the stocks mentioned in this article. Thank you for reading, and happy investing!