

Key Stats for Dollar General Stock
- Monday’s Performance: 4%
- 52-Week Range: $95 to $158
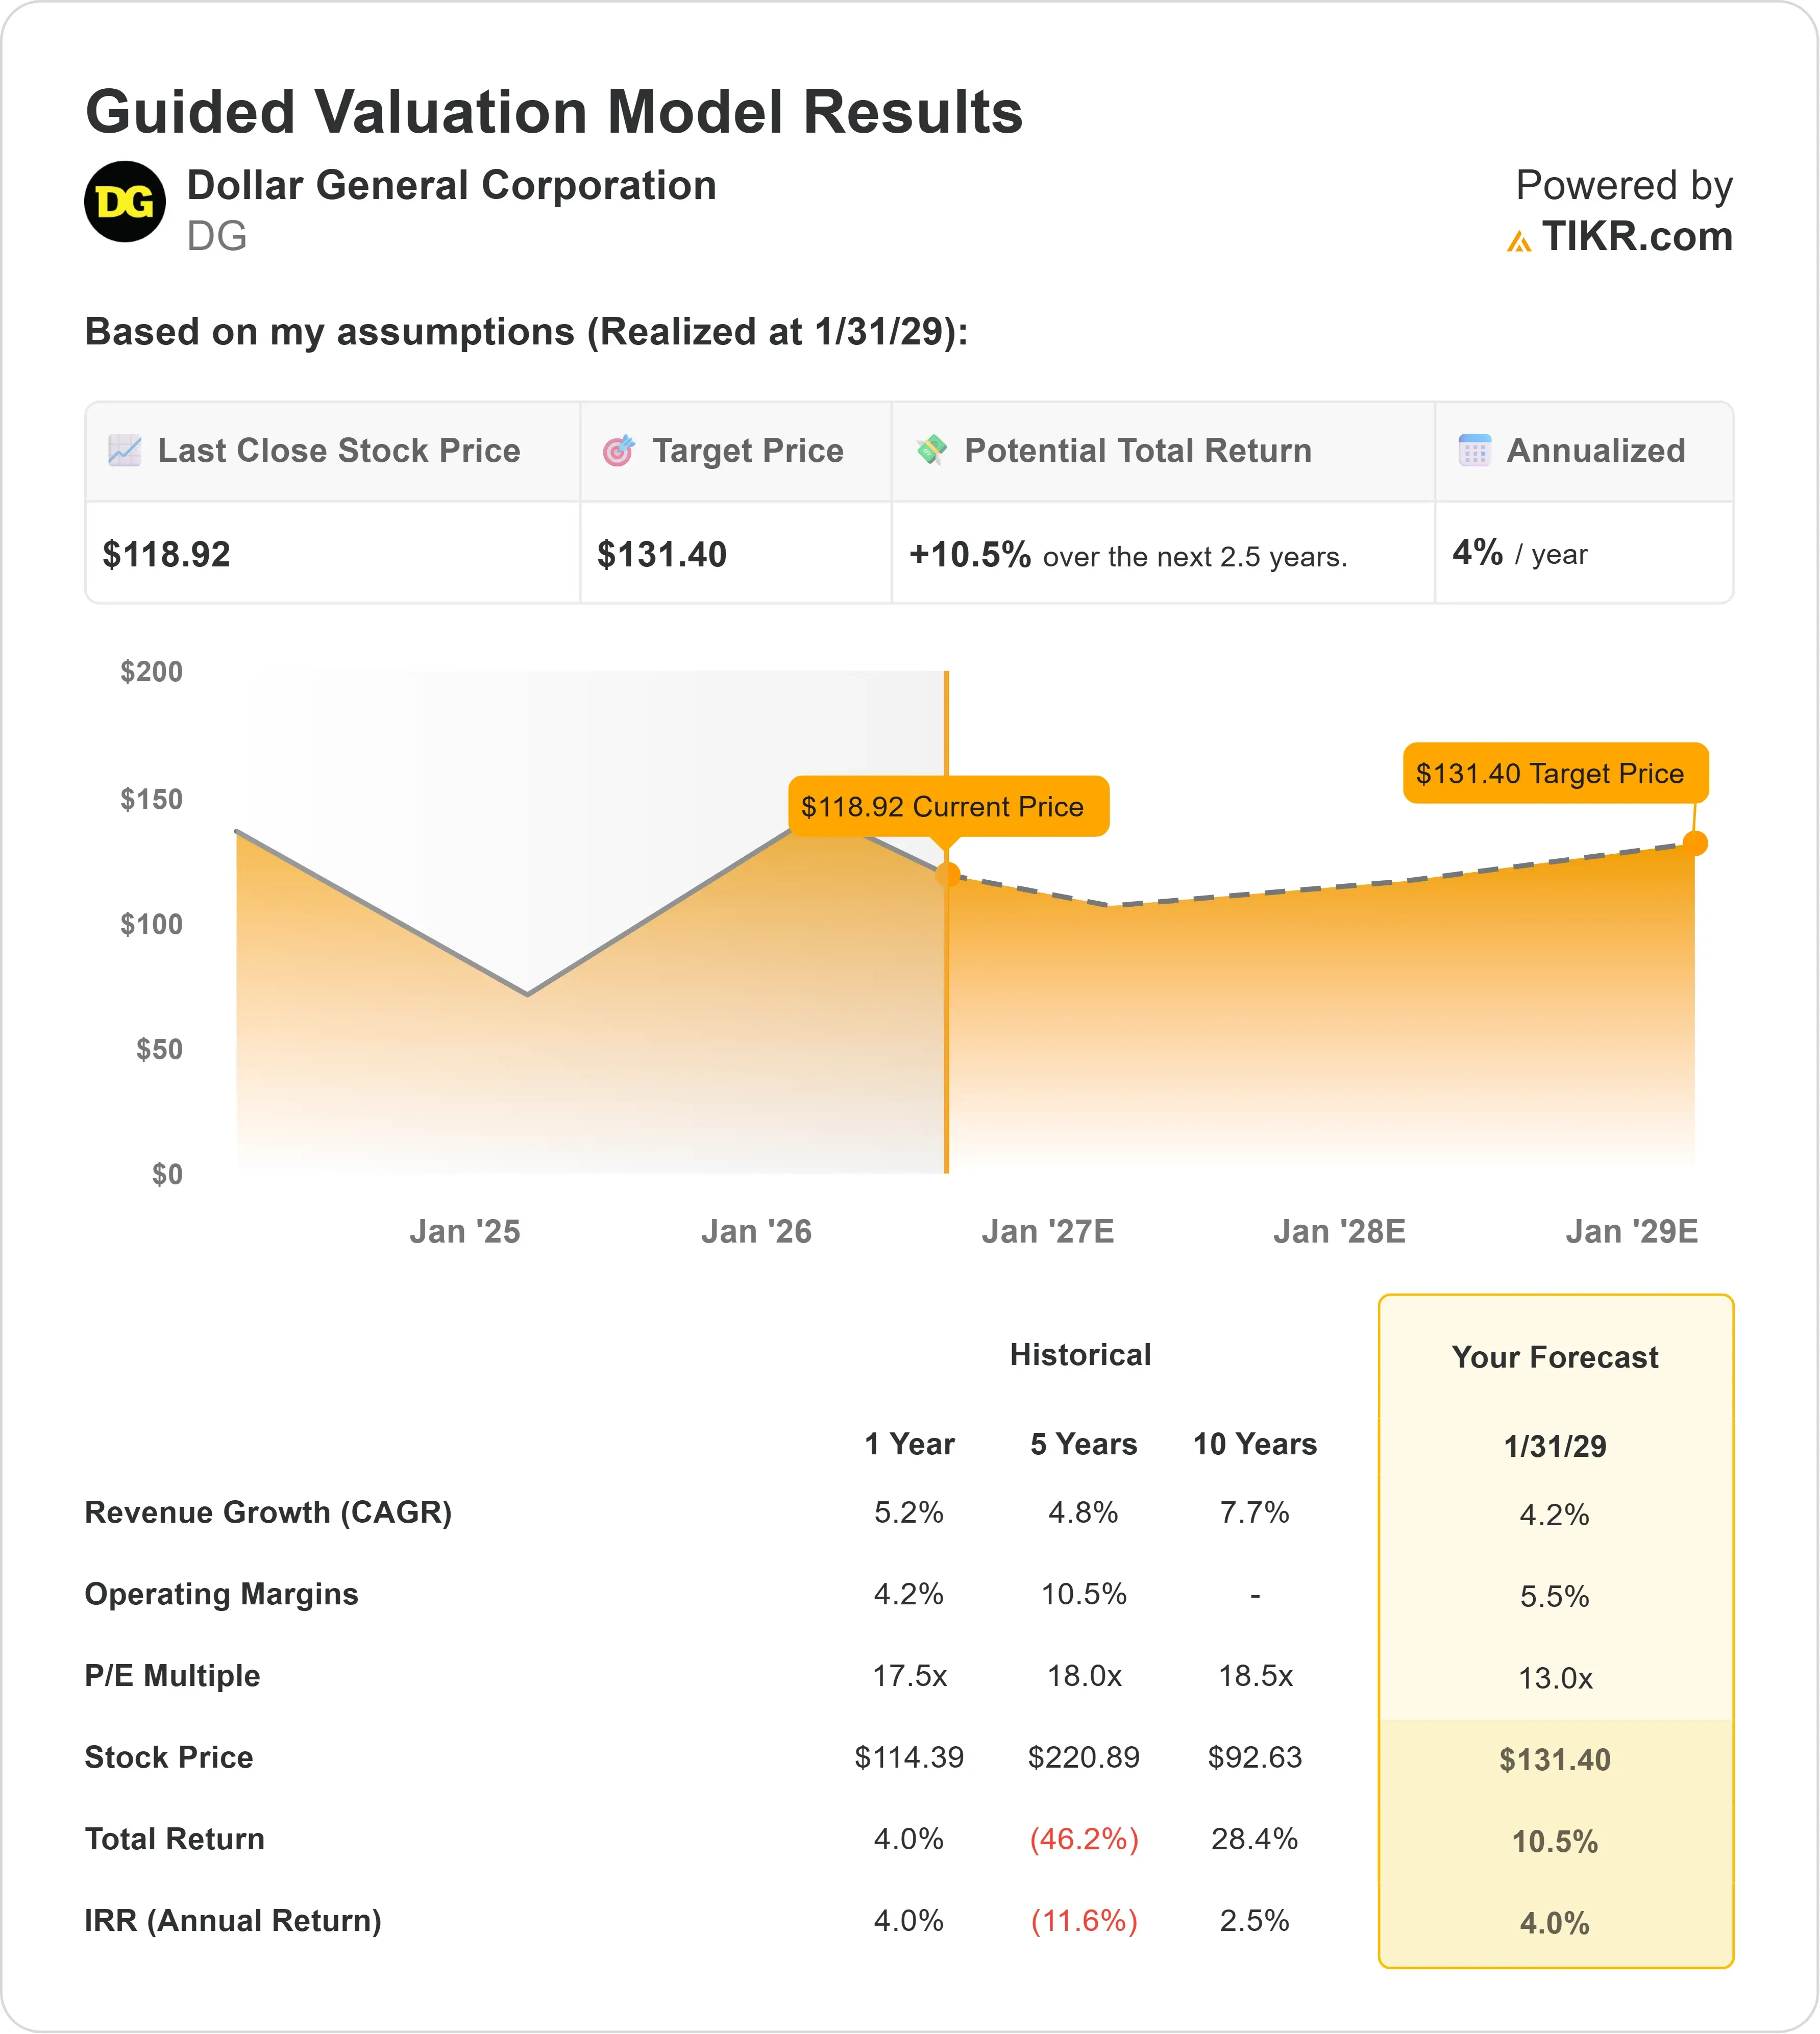
- Valuation Model Target Price: Around $131
- Implied Upside: Around 6%
Analyze your favorite stocks like Dollar General with TIKR (It’s free) >>>
What Happened?
Dollar General stock rose 3.8% Monday, rounded to 4%, closing near $123 per share and recording its third consecutive gain. Shares advanced while the S&P 500 declined 0.8%, showing renewed interest in Dollar General’s recovery as investors assessed whether stronger value-driven traffic can translate into lasting earnings growth.
The stock moved higher as investors returned to Dollar General’s raised earnings outlook, recovering margins, and ability to attract more shoppers across income levels. First-quarter net sales increased 3.4% to $10.8 billion, same-store sales rose 2.0%, operating profit climbed 10.8% to $638.5 million, and EPS increased 12.4% to $2.00. Lower inventory shrink, fewer damaged goods, and higher merchandise markups expanded gross margin by 65 basis points, showing that stronger inventory and store execution are allowing profit growth to outpace sales growth.
Dollar General raised its fiscal 2026 EPS outlook to $7.20 to $7.45 from $7.10 to $7.35 while maintaining projected net sales growth of 3.7% to 4.2%. CFO Donny Lau said that “price really wasn’t a meaningful driver in Q1,” meaning the margin improvement came primarily from stronger merchandise markups, lower shrink, and fewer inventory damages rather than broad price increases. Delivery also contributed about 70 basis points to comparable-sales growth, operates from approximately 18,000 stores, and generates larger baskets than the average in-store purchase.
Dollar Tree remains Dollar General’s closest listed competitor and provides a useful benchmark for the recovery. Dollar Tree’s latest-quarter net sales increased 7.2%, comparable sales rose 3.5%, and operating margin expanded by 120 basis points, while Dollar General reported 3.4% sales growth, 2.0% comparable-sales growth, and a 40-basis-point operating-margin increase. However, Dollar General generated positive traffic growth of 1.4%, while Dollar Tree’s traffic declined 1.0% as average spending per visit rose 4.5%, showing that DG’s recent progress has been supported by attracting more shoppers rather than relying mainly on larger purchases.
Value Dollar General instantly (Free with TIKR) >>>
Is Dollar General Fairly Valued?
Under valuation assumptions, the stock is modeled using:
- Revenue Growth (CAGR): Around 4%
- Operating Margins: Around 6%
- Exit P/E Multiple: 13x
The revenue assumption reflects low-single-digit same-store sales growth, 450 planned U.S. store openings, and continued delivery expansion rather than a sharp acceleration in consumer spending.
Margin improvement depends on further reductions in shrink and damaged merchandise, stronger product markups, supply-chain productivity, and growth in the DG Media Network, which generates advertising revenue by helping consumer brands reach Dollar General shoppers.

See analysts’ growth forecasts and price targets for Dollar General (It’s free) >>>
Dollar General’s 2,000 Project Renovate remodels and 2,250 Project Elevate upgrades could improve productivity across mature stores, with management targeting annualized comparable-sales lifts of around 6% and 3%, respectively.
The EBIT chart supports the recovery case, with operating profit expected to rise from about $2.2 billion in fiscal 2026 to around $3.1 billion by fiscal 2031 as margins recover from roughly 5% toward the model’s 6% assumption.
Based on a model target of around $131 versus Monday’s closing price near $123, Dollar General appears fairly valued with around 6% upside, leaving stronger returns dependent on sustained traffic, successful remodels, and continued margin recovery rather than multiple expansion.
How Much Upside Does DG Stock Have From Here?
Investors can estimate Dollar General’s potential share price, or what any stock could be worth, in under a minute using TIKR’s New Valuation Model tool.
All it takes is three simple inputs:
- Revenue Growth
- Operating Margins
- Exit P/E Multiple
From there, TIKR calculates the potential share price and total returns under Bull, Base, and Bear scenarios so you can quickly see whether a stock looks undervalued or overvalued.
If you’re not sure what to enter, TIKR automatically fills in each input using analysts’ consensus estimates, giving you a quick, reliable starting point.
Value Dollar General in under 60 seconds with TIKR (It’s free) >>>


