


Key Takeaways
- Chevron yields 3.5% and BP yields 4.7%, and over the twelve months to June 30, 2026, their dividends used 51% and 31% of free cash flow.
- Chevron says it has grown its dividend for 39 years in a row, while BP’s dividend per share fell from $2.40 in fiscal 2015 to $1.96 in fiscal 2025.
- Chevron carries less debt, at 0.56x net debt to EBITDA against 0.84x for BP, and BP’s management calls strengthening its balance sheet its first priority.
- BP trades at 7.3x forward earnings against 12.5x for Chevron, and plans to cut its hybrid stack by more than $4 billion by the end of 2027.
Chevron (CVX) turned out $18.1 billion of free cash flow in the second quarter of 2026, up from $4.9 billion in the same quarter a year earlier. It also cut its total debt by $8.4 billion in those three months.
Four days later, on Aug. 4, BP (BP) CEO Marguerite O’Neill told investors that strengthening the balance sheet is BP’s first priority, because too much of its cash goes to servicing liabilities.
That’s the split for anyone buying an oil major for income. BP’s 4.7% yield is the bigger check, and Chevron’s 3.5% has the stronger balance sheet behind it. So which is the better dividend stock?
| Metric | Chevron (CVX) | BP (BP) |
|---|---|---|
| Dividend yield | 3.5% | 4.7% |
| Dividend growth, 5 years | 5.8% a year, fiscal 2020–2025 | 0.7% a year, fiscal 2020–2025 |
| Dividend growth, 10 years | 4.8% a year, fiscal 2015–2025 | -2.0% a year, fiscal 2015–2025 |
| Cash dividend payout ratio (TTM to June 30, 2026) | 51% | 31% |
| Net debt / EBITDA (LTM) | 0.56x | 0.84x |
| Interest coverage (LTM) | 18.9x | 6.0x |
| Forward P/E (NTM) | 12.5x | 7.3x |
Chevron: 39 years and counting
Chevron’s growth is coming from the barrels. Its net oil-equivalent production in the second quarter of 2026 was up 20% from a year earlier, driven by the Hess acquisition and growth in the Permian Basin and Gulf of America. CEO Michael Wirth tied that straight to the dividend on the July 31 call: “The Hess assets are generating strong free cash flow, which has been roughly double the incremental dividends and accretive to shareholders on a per share basis.”
Chevron pays $1.78 a share each quarter. Over the twelve months to June 30, 2026, that dividend used a well-covered 51% of free cash flow, though fiscal 2025 ran a tighter 77%. The longer record shows the dividend kept growing even in years when free cash flow came up short.

Free cash flow fell short of the dividend in fiscal 2016, 2017 and 2020. The dividends Chevron paid still rose every year, from $8.03 billion in fiscal 2016 to $12.8 billion in fiscal 2025.
The main risk is price. Chevron’s 2030 targets assume flat commodity prices below today’s, so the 51% leans on a stronger backdrop than the one Chevron plans around.
BP: the balance sheet comes first
Where Chevron’s dividend kept growing through the lean years, BP’s went the other way, even though its figures today look better. Over the twelve months to June 30, 2026, BP’s dividend used a comfortable 31% of free cash flow. But the chart shows how BP got there.
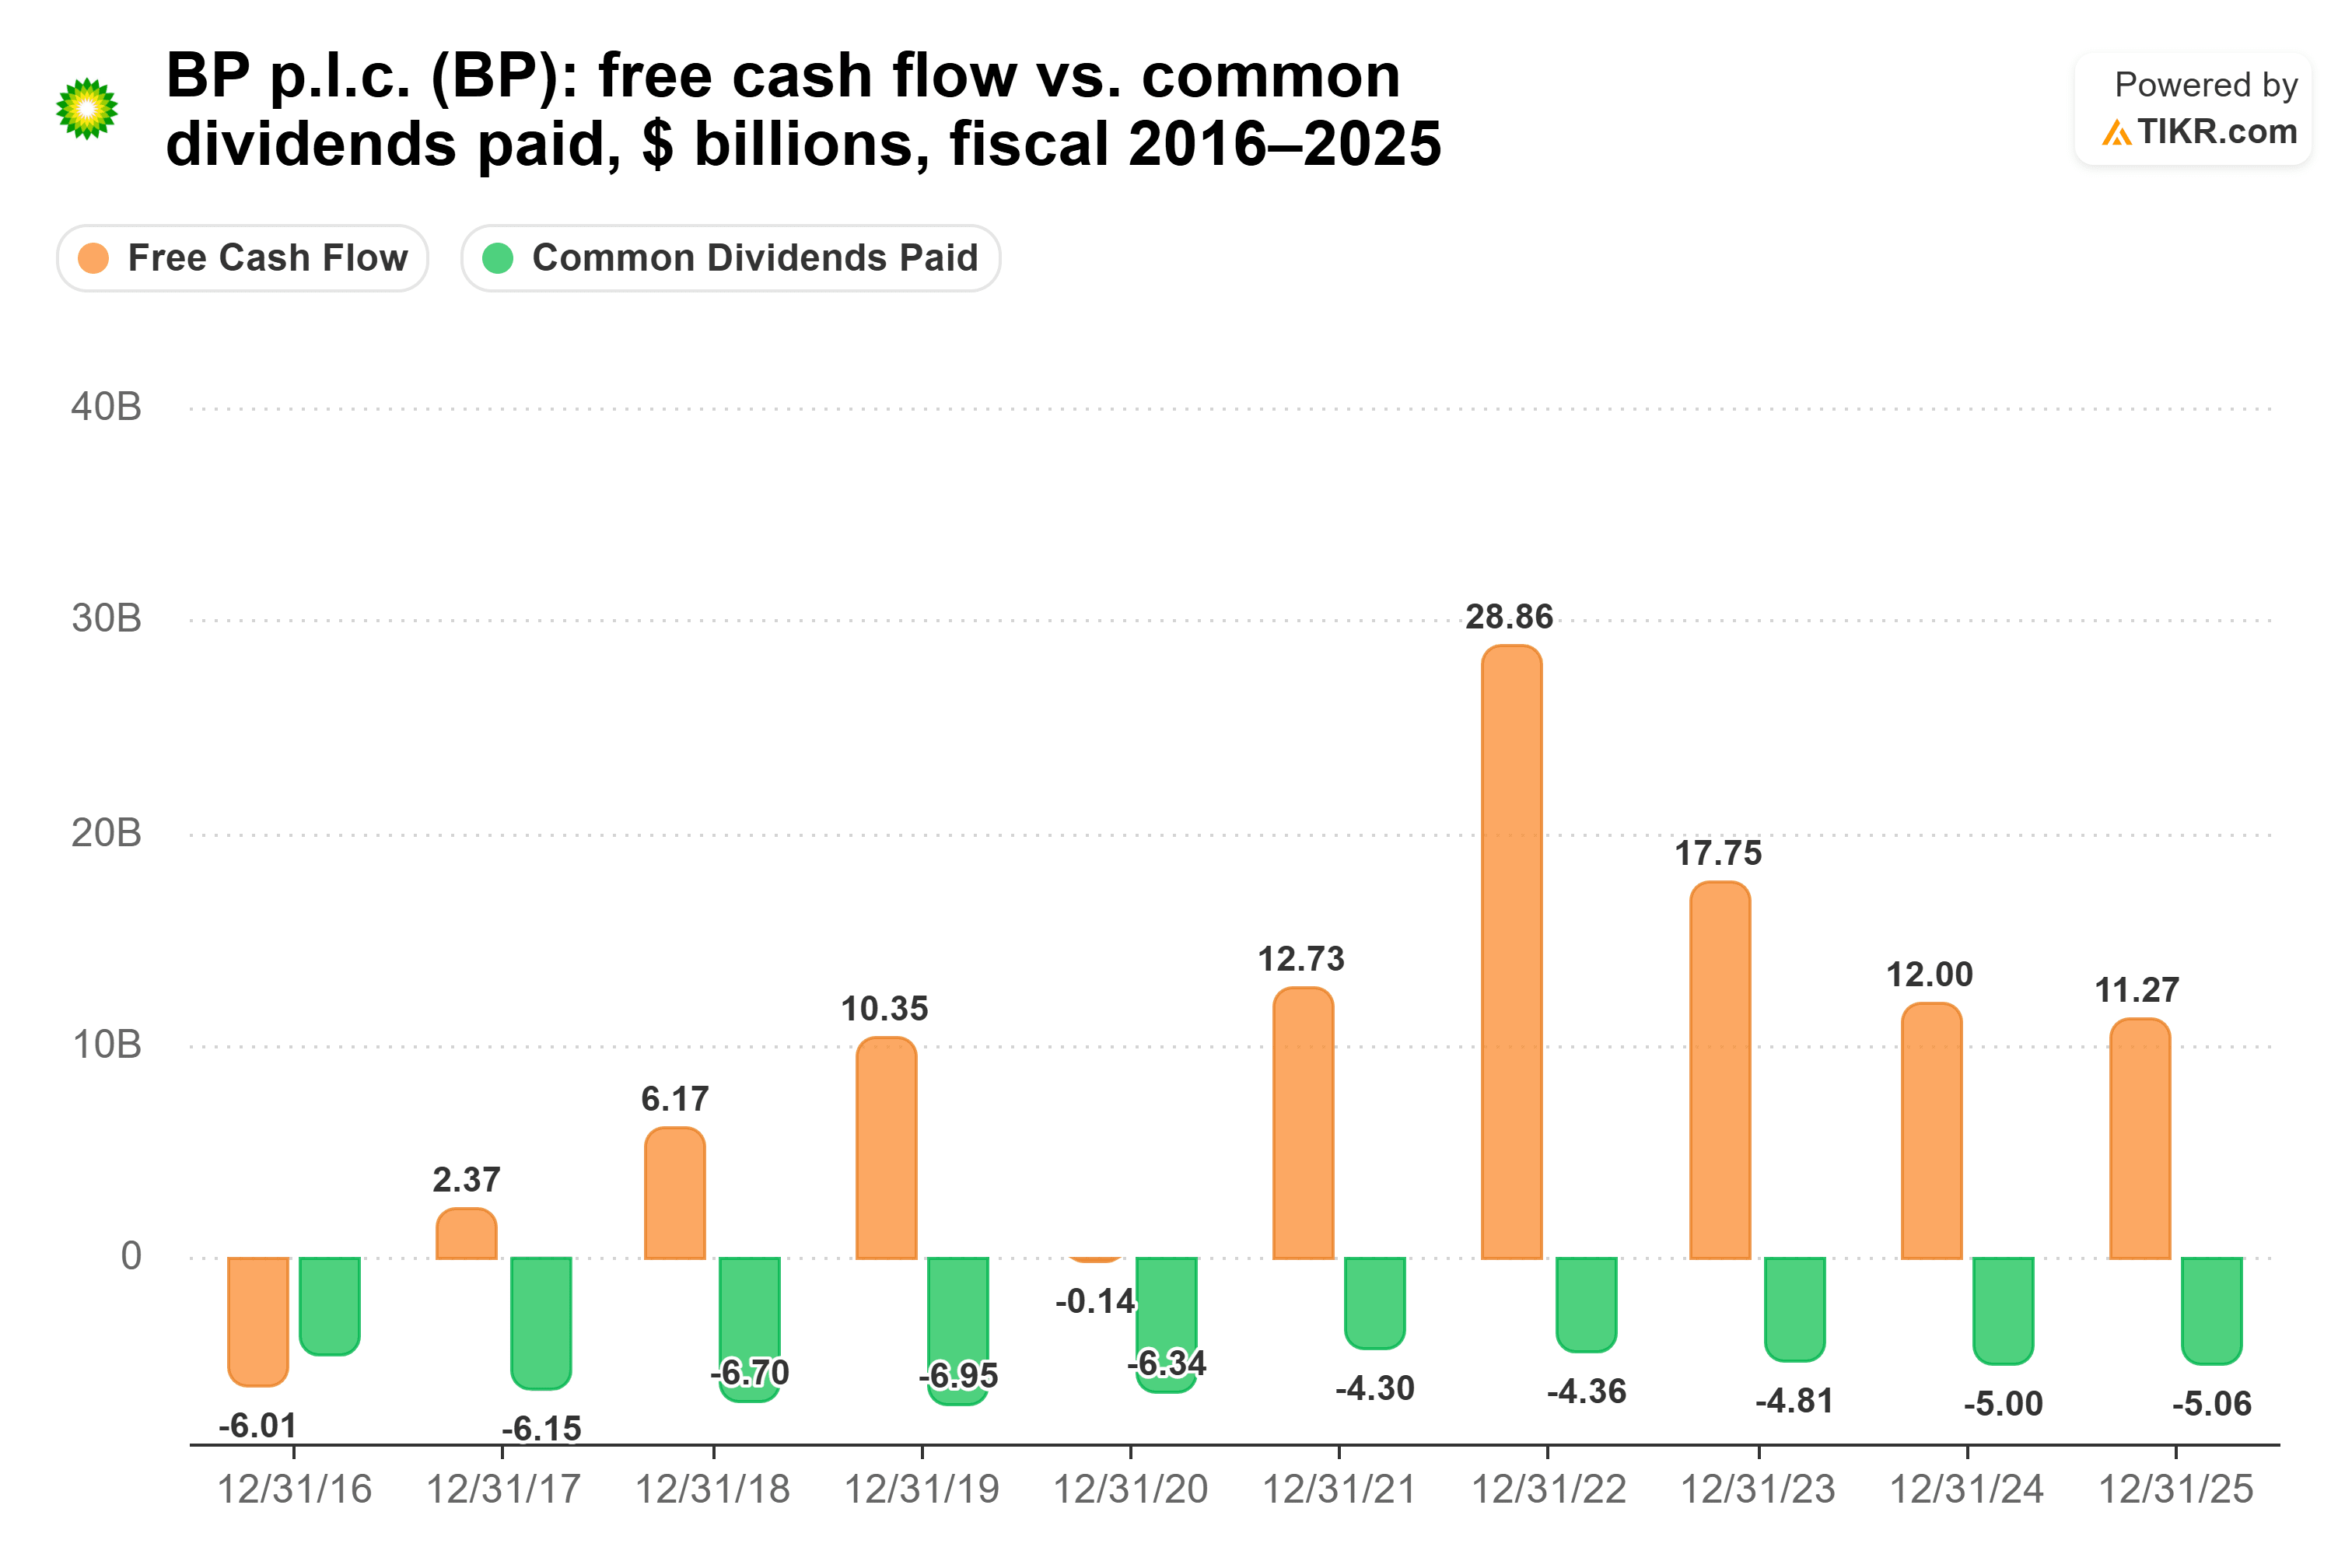
Free cash flow came in at negative $0.14 billion in fiscal 2020. The dividends BP paid fell from $6.34 billion that year to $4.30 billion in fiscal 2021, and they’ve climbed back only to $5.06 billion in fiscal 2025.
The business is being reworked. Deputy CEO Carol Howle said on the April 28 call that BP’s strategic LNG volumes rose year on year to just under 27 million tonnes a year. Meanwhile, BP has agreed to sell the Gelsenkirchen refinery and is marketing Archaea Energy and its North Sea business. O’Neill set the terms on Aug. 4: “BP has real growth potential, but growth must be earned through a track record of delivering consistent positive returns and cash flow.”
The main risk is one BP names itself: a cost base that leaves it too little resilience to low prices. On the Aug. 4 call, management also said it was disappointed that operating costs aren’t falling quickly enough.
So which dividend wins?
Chevron is the better dividend stock. BP wins on yield and on today’s coverage, so what decides it is which dividend I’d count on to keep growing through the next drop in oil prices. Chevron’s has already come through years when free cash flow fell short, and it carries far less strain from debt: 0.56x net debt to EBITDA and 18.9x interest coverage, against BP’s 0.84x and 6.0x.
BP’s case starts with income. Put $10,000 in BP and it pays $470 a year today, against $350 from Chevron. At each company’s 5-year growth rate, Chevron’s income passes BP’s around 2033. At each one’s fiscal 2025 rise (7.1% for BP, 4.9% for Chevron), it never does: in year 10, BP pays about $872 against about $539 from Chevron. BP is also cheaper, at 7.3x forward earnings against 12.5x.
It’s just that BP’s own management calls the balance sheet its first priority, and BP’s dividend per share is smaller than it was ten years ago. Chevron has grown its dividend for 39 years.
Of course, BP plans to shrink its hybrid stack by more than $4 billion by the end of 2027. If it gets there and keeps raising, that 4.7% yield gets much harder to pass up.
So what is Chevron stock actually worth?
TIKR lets you forecast the future price of any stock in less than a minute. Just enter a few assumptions into TIKR’s valuation model and see what Chevron could be worth. Start from Wall Street consensus estimates, or adjust the inputs to reflect your own view of the business. It’s free to use.
Disclaimer:
Please note that the articles on TIKR are not intended to serve as investment or financial advice from TIKR or our content team, nor are they recommendations to buy or sell any stocks. We create our content based on TIKR Terminal’s investment data and analysts’ estimates. Our analysis might not include recent company news or important updates. TIKR has no position in any of the stocks mentioned. Thank you for reading, and happy investing!


