
Key Stats for Apple Stock
- Past-6-Month Performance: 15%
- 52-Week Range: $169 to $289
- Valuation Model Target Price: $337
- Implied Upside: 28%
Value your favorite stocks like Apple with 5 years of analysts’ forecasts using TIKR’s new Valuation Model (It’s free) >>>
What Happened?
Apple stock is up about 15% over the past six months, recently trading near $264 per share as investors responded to record earnings, strong iPhone demand, and expanding margins.
Shares remain near the upper end of their $169 to $289 52 week range, reflecting renewed confidence in earnings durability even with the stock trading at roughly 33x earnings.
The rally accelerated after Apple delivered its best quarter ever, reporting $143.8 billion in revenue up 16% year over year, EPS of $2.84 up 19%, iPhone revenue of $85.3 billion up 23%, and services revenue of $30 billion up 14%.
CEO Tim Cook called it “a quarter for the record books,” while management guided March quarter revenue growth of 13% to 16% with gross margin between 48% and 49%, signaling sustained momentum into 2026 despite supply constraints on advanced node capacity.
Institutional filings show active but balanced positioning. New York State Common Retirement Fund trimmed its stake by 5%, selling 932,126 shares but still holding 17,816,949 shares worth about $4.54 billion.
Mirae Asset Global Investments increased its stake by 5.4% to 6,530,591 shares valued at about $1.66 billion, while AE Wealth Management raised its position by 11.4% to 2,010,129 shares worth about $511.8 million.
Coastal Bridge Advisors and TD Waterhouse Canada also added shares, while firms such as Great Lakes Advisors, Valeo Financial Advisors, and DSG Capital Advisors modestly reduced exposure.
The mixed adjustments suggest Apple remains a core institutional holding even after a strong run. The stock’s 15% gain over the past six months reflects earnings strength, services margin expansion, and continued capital returns rather than speculative enthusiasm.

See analysts’ growth forecasts and price targets for Apple (It’s free) >>>
Is Apple Undervalued?
Under valuation assumptions, the stock is modeled using:
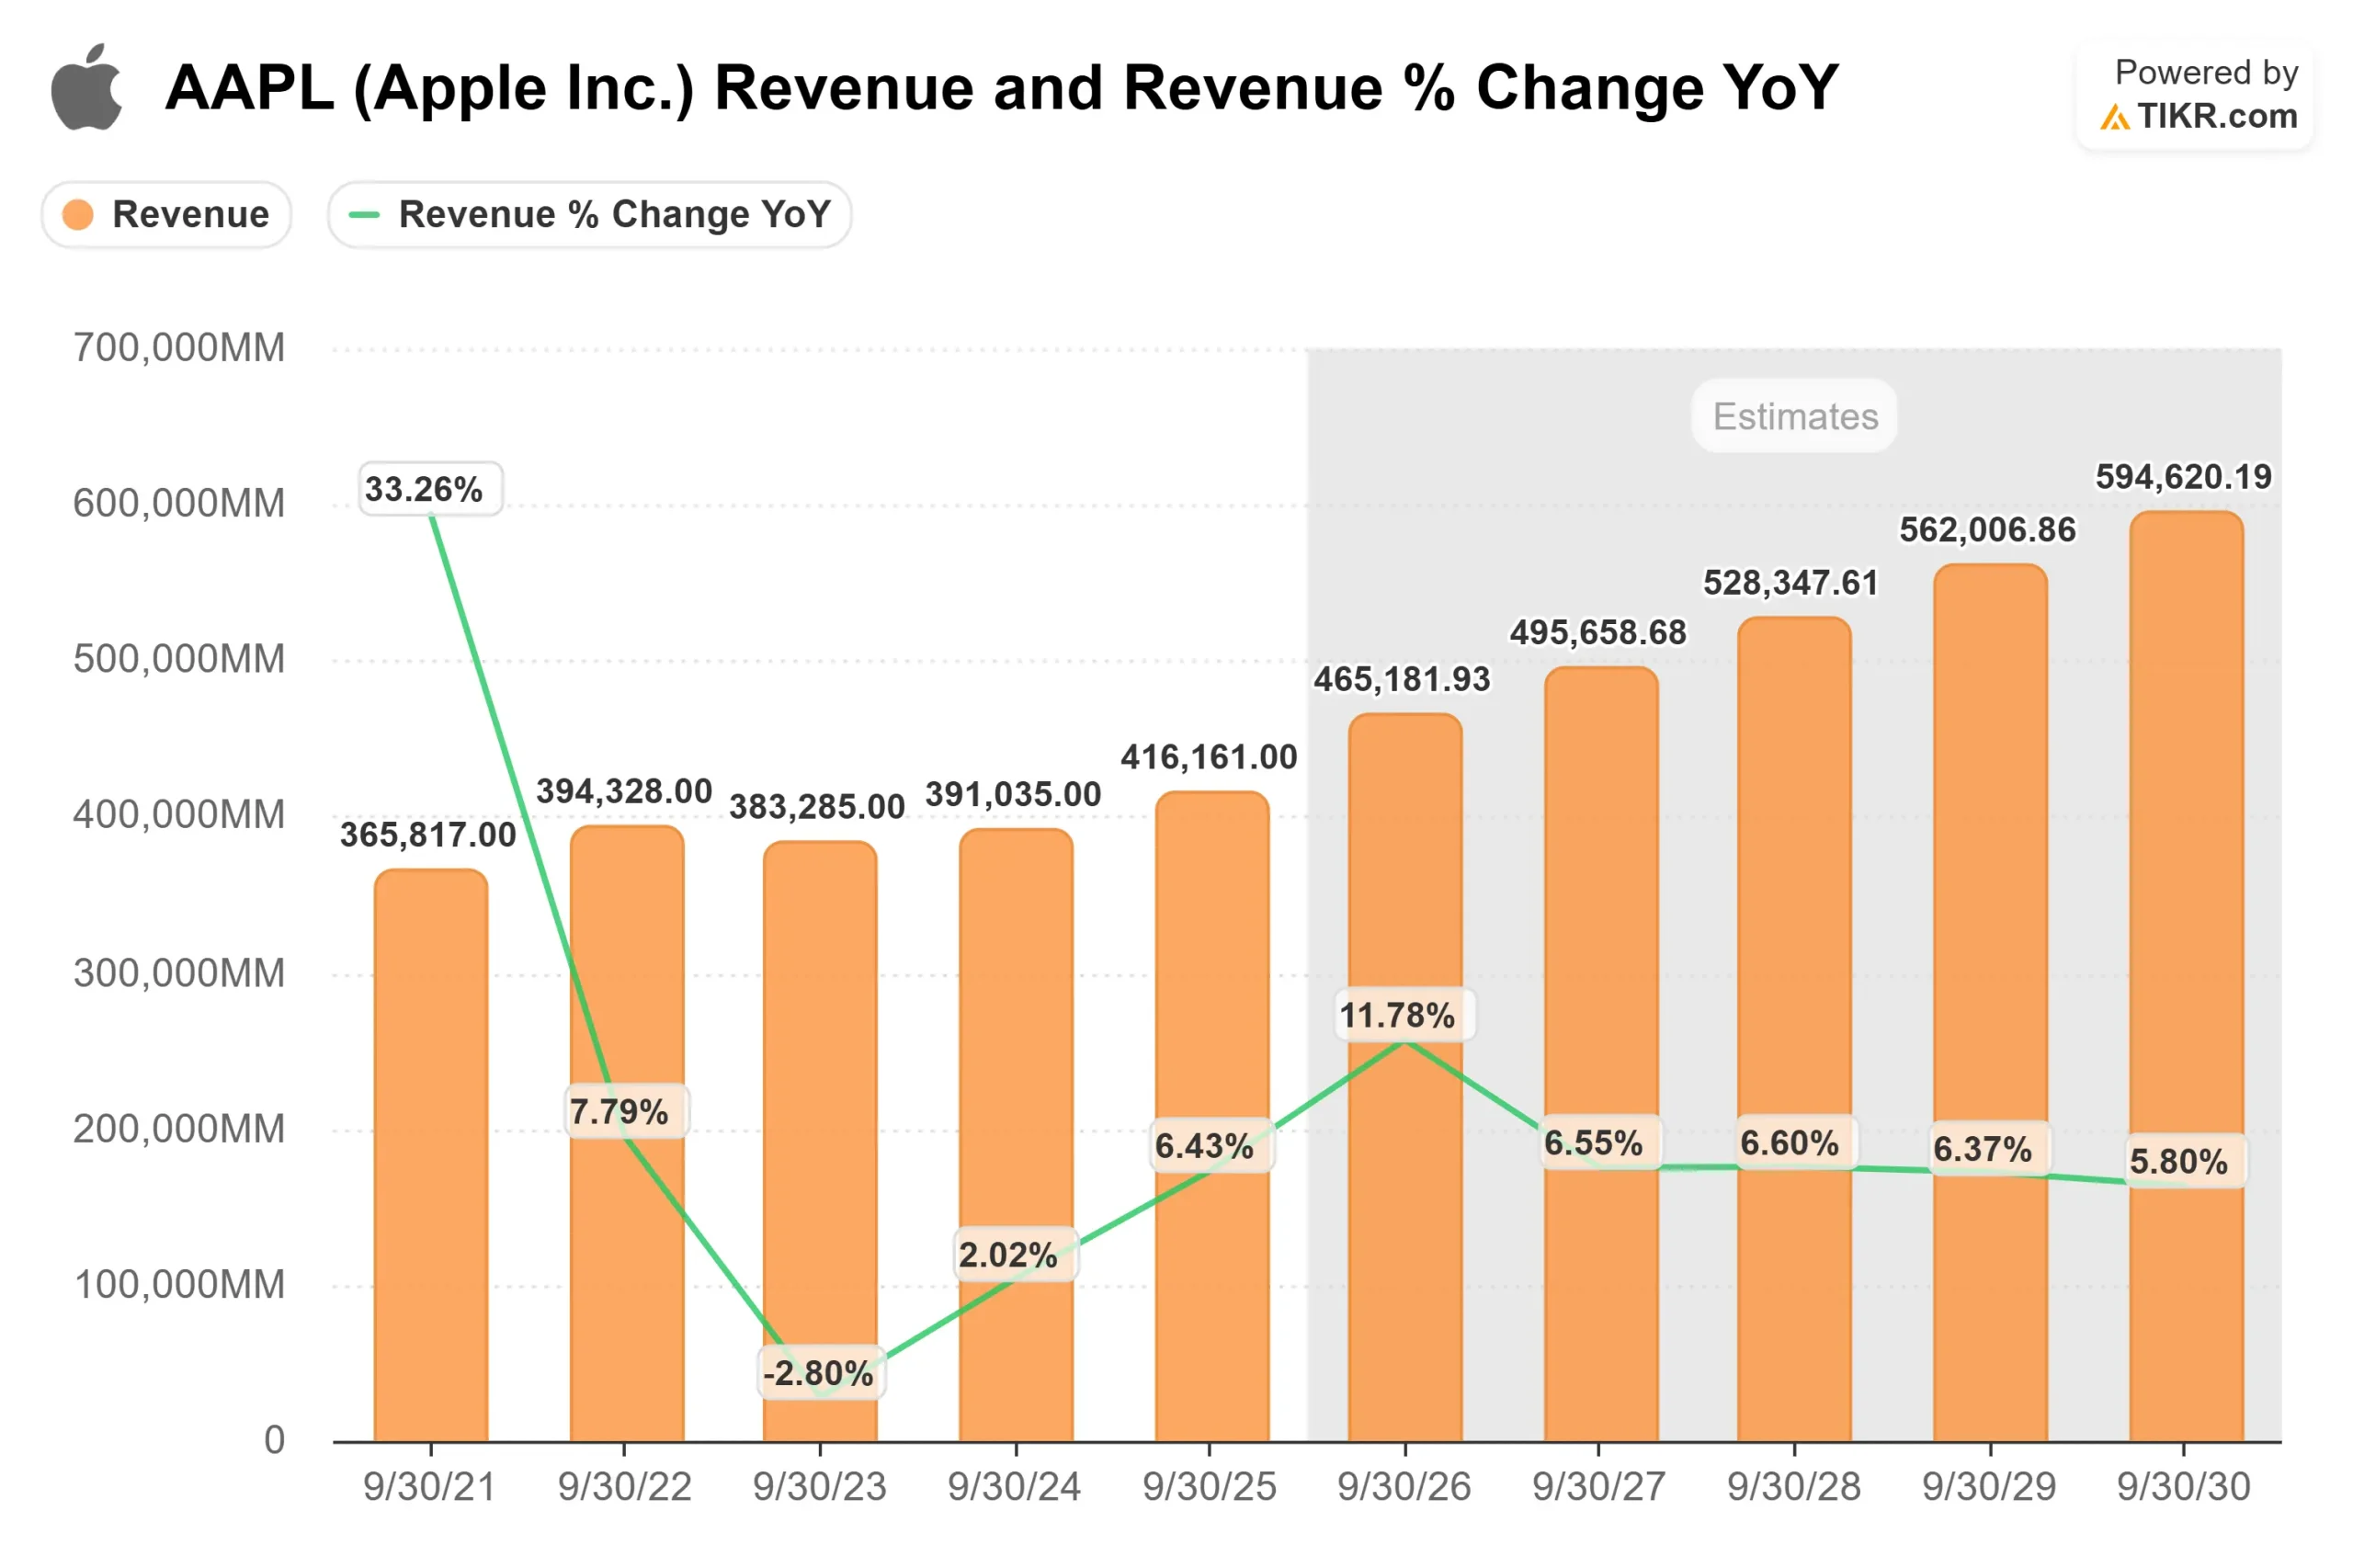
- Revenue Growth (CAGR): 8%
- Operating Margins: 33%
- Exit P/E Multiple: 29x
Revenue growth in the high single digit range reflects continued services expansion on a base that now exceeds $30 billion per quarter, along with sustained iPhone upgrade activity supported by record installed base levels above 2.5 billion active devices.
The iPhone 17 cycle has driven 23% revenue growth, and supply constraints indicate demand strength rather than weakness.
Operating margin durability near 33% is supported by a growing mix of high margin services, favorable product mix during strong iPhone cycles, and disciplined operating expense growth even as R&D investment increases.
Gross margin guidance of 48% to 49% suggests pricing power and leverage remain intact despite rising memory costs.
Key drivers in 2026 include continued services monetization through advertising, payments, and cloud growth, deeper integration of Apple Intelligence across devices, expansion in emerging markets such as India, and ongoing share repurchases funded by record operating cash flow of $53.9 billion. These factors directly influence earnings per share growth more than pure hardware unit volumes.
Based on these inputs, fair value trends toward $337 per share, implying about 28% upside from $264.
At current levels, Apple appears modestly undervalued, with performance in 2026 likely driven by earnings quality, margin stability, and ecosystem monetization rather than aggressive top line acceleration.
Estimate a company’s fair value instantly (Free with TIKR) >>>
How Much Upside Does APPL Stock Have From Here?
Investors can estimate Apple potential share price, or what any stock could be worth, in under a minute using TIKR’s New Valuation Model tool.
All it takes is three simple inputs:
- Revenue Growth
- Operating Margins
- Exit P/E Multiple
From there, TIKR calculates the potential share price and total returns under Bull, Base, and Bear scenarios so you can quickly see whether a stock looks undervalued or overvalued.
If you’re not sure what to enter, TIKR automatically fills in each input using analysts’ consensus estimates, giving you a quick, reliable starting point.
See Apple true value, or any stock’s, in under 60 seconds (Free with TIKR) >>>