Key Stats for UPS Stock
- Past week’s performance: -1.6%
- 52-week range: $82 to $122
- Valuation model target price: $136
- Implied upside: 41.9% over 2.8 years
Value your favorite stocks like UPS with 5 years of analysts’ forecasts using TIKR’s new Valuation Model (It’s free) >>>
What Happened?
United Parcel Service (UPS) stock slipped about 1.6% this week and closed at $95.86 on March 20. The move was modest, but it fits a broader cautious tone around the delivery sector. Investors are still weighing UPS’s restructuring plan, labor headlines, and the company’s lower-growth outlook into 2026.
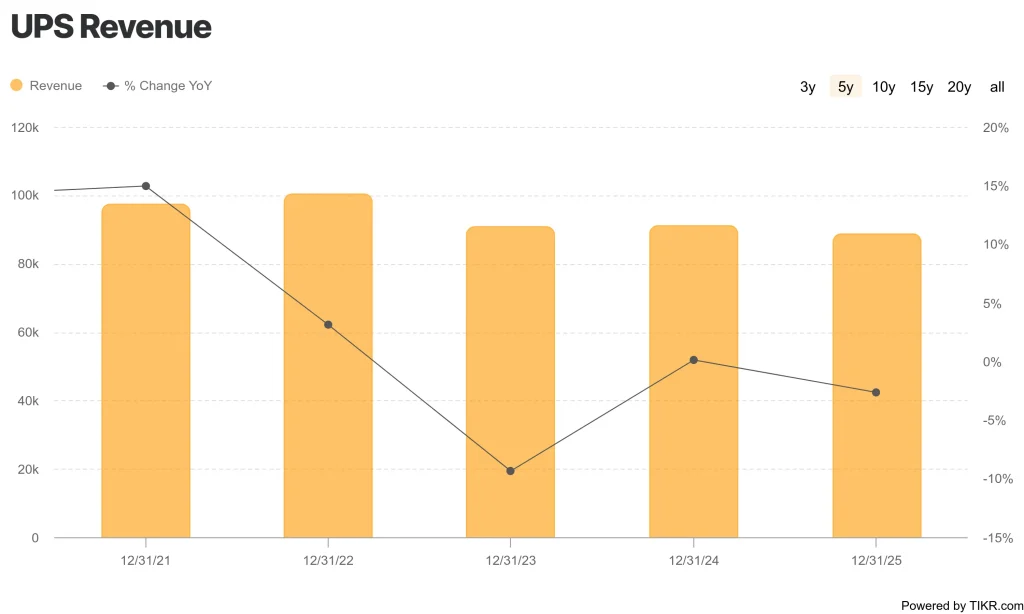
A big part of the current debate still traces back to UPS’s January earnings report. The company posted fourth-quarter 2025 revenue of $24.5 billion, above the $24.0 billion IBES estimate, and it guided to about $89.7 billion of 2026 revenue. At the same time, UPS said it planned to cut 30,000 jobs and close 24 facilities in 2026 as it reduced lower-margin Amazon volume.
Labor news also stayed in focus during the quarter. In February, a federal judge ruled UPS could move forward with offering $150,000 buyouts to unionized drivers while the Teamsters’ challenge proceeds in arbitration. That ruling matters because investors are watching whether cost actions can improve margins without creating new operational disruption.
This week’s tone was also shaped by sector read-through from FedEx. FedEx said global demand was holding up and raised its full-year profit outlook, but its weak quarterly forecast limited enthusiasm and kept attention on freight demand, fuel costs, and pricing power across parcel carriers. For UPS, that backdrop likely reinforced a wait-and-see stance ahead of first-quarter results on April 28.
See analysts’ growth forecasts and price targets for UPS (It’s free) >>>
Is UPS Stock Undervalued?
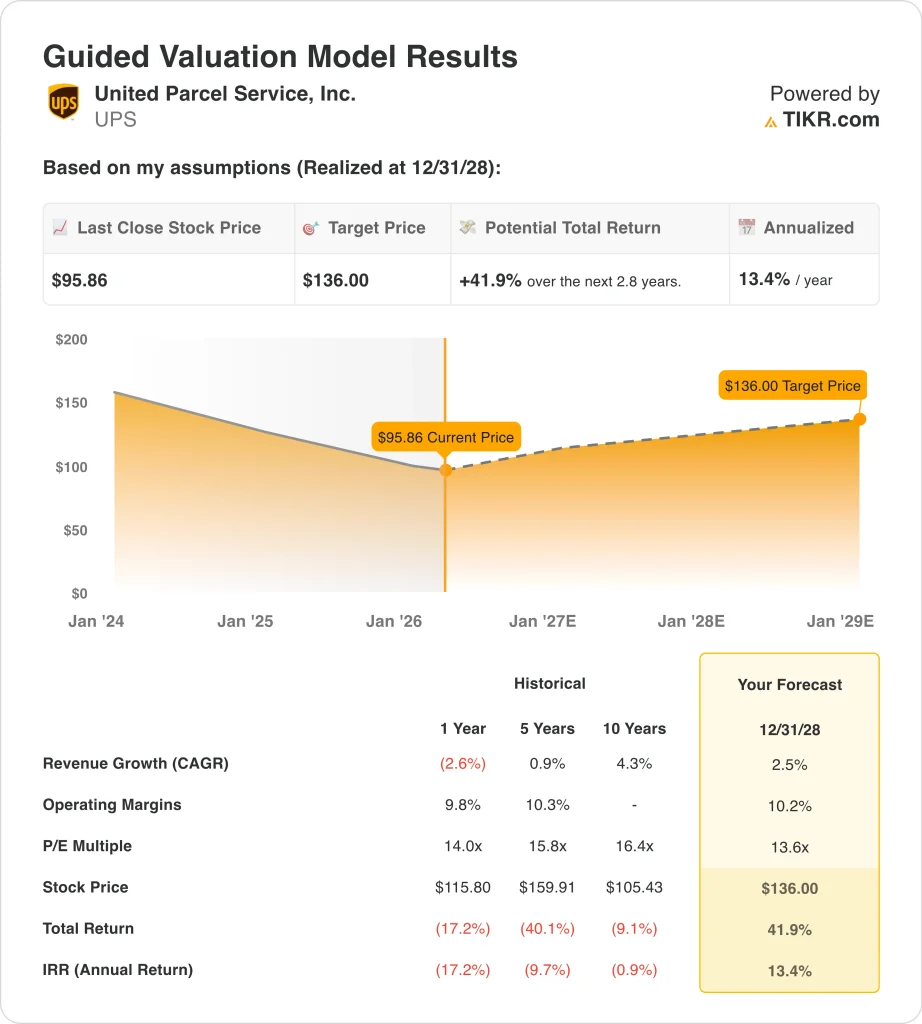
Under valuation model assumptions realized through 12/31/28, the stock is modeled using:
- Revenue growth (CAGR): 2.5%
- Operating Margins: 10.2%
- Exit P/E Multiple: 13.6x
Based on these inputs, the model estimates a target price of $136.00, implying 41.9% total upside from the current share price and a 13.4% annualized return over the next 2.8 years.
The model assumes modest top-line growth, and that fits the current business setup. Data shows a forward 2-year revenue CAGR of 2.5%, while the valuation image uses the same 2.5% revenue CAGR through 2028. This is not a high-growth story, so the case depends more on steadier execution and margin stability than on a sharp rebound in package volumes.
Margins are central because UPS is trying to reshape its network around more profitable freight. Data shows LTM EBIT margin at 9.6%, and the valuation model assumes 10.2% operating margins by 2028. That suggests the model is not pricing in an aggressive turnaround, but rather a moderate recovery as cost cuts and network changes flow through.
The multiple assumption is also conservative relative to history. The model uses a 13.6x exit P/E, versus a 5-year historical P/E of 15.8x and a 10-year historical P/E of 16.4x in the valuation image. So the target price does not require a major re-rating, which is important for a mature logistics business facing slower growth.
Street sentiment is still constructive, but not euphoric. Analysts’ data shows a mean street target of $113.07 as of March 20. The spread suggests analysts see room for improvement, but they are still divided on how quickly UPS can convert restructuring into stronger earnings.
What’s Driving the Stock Going Forward?
UPS’s next move will likely depend on whether management can prove that lower revenue can still produce better quality earnings. Full-year 2025 revenue was $88.7 billion, down 2.6%, while LTM gross margin was 22.6% and LTM EBIT margin was 9.6%. Those numbers show the business is still profitable, but they also show why investors want more evidence that the network reset is working.
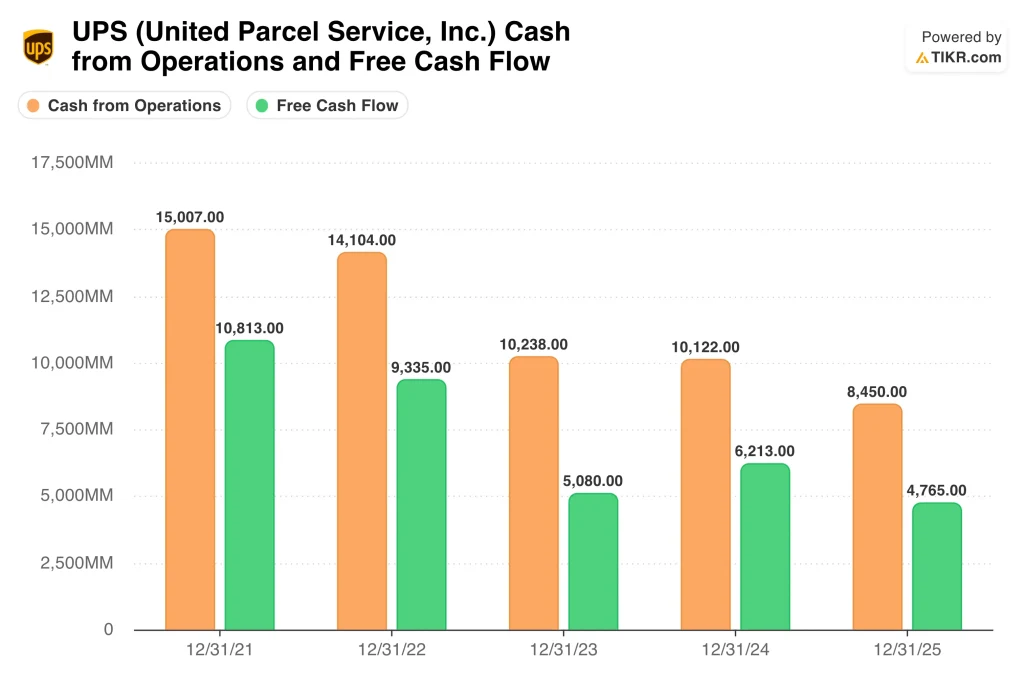
Cash generation is another key driver. UPS generated $8.45 billion of operating cash flow and $4.77 billion of free cash flow in the last twelve months, but that is below the levels it produced a few years ago. At the same time, the company carries $22.7 billion of net debt and a 96.9% payout ratio, so investors are watching the balance between dividends, capital spending, and debt management.
Competitive context matters as well. FedEx’s recent results suggested global delivery demand is still holding up, but they also highlighted how sensitive the sector remains to fuel, trade flows, and pricing mix. For UPS, that means the market will keep comparing its margin path and network efficiency against rivals even if macro demand stays stable.
The clearest near-term catalyst is the April 28 earnings report. Investors will want updates on U.S. domestic volume, Amazon-related mix changes, labor costs, and whether restructuring benefits are arriving on schedule. The May 7 annual meeting and shareholder call could also matter, but first-quarter results are likely the main event for the stock.
Estimate a company’s fair value instantly (Free with TIKR) >>>
Should You Invest in United Parcel Service, Inc.?
The only way to really know is to look at the numbers yourself. TIKR gives you free access to the same institutional-quality financial data that professional analysts use to answer exactly that question.
Pull up UPS, and you’ll see years of historical financials, what Wall Street analysts expect for revenue and earnings in the quarters ahead, how valuation multiples have moved over time, and whether price targets are trending up or down.
You can build a free watchlist to track UPS alongside every other stock on your radar. No credit card required. Just the data you need to decide for yourself.
Analyze United Parcel Service stock on TIKR Free→
Looking for New Opportunities?
- See what stocks billionaire investors are buying so you can follow the smart money.
- Analyze stocks in as little as 5 minutes with TIKR’s all-in-one, easy-to-use platform.
- The more rocks you overturn… the more opportunities you’ll uncover. Search 100K+ global stocks, global top investor holdings, and more with TIKR.
Disclaimer:
Please note that the articles on TIKR are not intended to serve as investment or financial advice from TIKR or our content team, nor are they recommendations to buy or sell any stocks. We create our content based on TIKR Terminal’s investment data and analysts’ estimates. Our analysis might not include recent company news or important updates. TIKR has no position in any stocks mentioned. Thank you for reading, and happy investing!