
Key Stats for United Airlines Stock
- Current Price: $125.34
- Target Price (Mid): ~$119
- Street Target: ~$162
- Potential Total Return: ~(5%)
- Annualized IRR: ~(1%) / year
Now Live: Discover how much upside your favorite stocks could have using TIKR’s new Valuation Model (It’s free) >>>
What Happened?
United Airlines Holdings (UAL) trades at about $125, and for once, the interesting number is not the price. It is the distance between two forecasts. After United reported second-quarter results on July 16 and lifted its full-year profit floor, Wall Street pushed its average target to roughly $162, with a lone high mark of $203 at JPMorgan. That mean target implies about 29% upside from today’s price. Run the same company through a disciplined valuation model built on consensus estimates, and the fair value lands near $119, about 5% below where the stock sits today, a small loss rather than a gain.
Both numbers describe the same airline, the same raised guidance, and the same balance sheet. The gap between them is a question of what you believe about airline pricing three to four years out.
A Raised Guide That Still Left the Stock Below Target
Revenue rose 16% to $17.7 billion, a company record for the period, and adjusted earnings of $1.99 beat the $1.85 consensus. More telling, management raised the full-year 2026 adjusted EPS floor to $9 to $11 from a prior $7 to $11, lifting the bottom by $2 while absorbing nearly $6 billion of extra annual fuel cost. Premium revenue climbed 16%, cargo rose about 23%, and contracted corporate revenue flown rose 27% year over year.
Yet the stock slipped 1.79% the session after the print and still trades around $125, roughly 10% under its June high. The soft spot was near-term: third-quarter guidance of $2.50 to $3.50 used an all-in fuel price of about $3.69 a gallon drawn from a single day’s forward curve, a midpoint below much of the Street. The market discounted the near-term fuel math even as the annual outlook improved.
Analysts looked past the Q3 number. JPMorgan raised its target to $203 from $156, Morgan Stanley moved to $190, and Goldman Sachs to $165, while Jefferies and Susquehanna trimmed slightly to $155 and $165. The $203 is the outlier; the mean of the roughly two dozen targets sits at $162.15, behind a lineup of 19 Buys, 4 Outperforms, 2 Holds, and a single Underperform in the investor relations materials. That consensus rests on one belief: the fuel hit is a one-year event in front of a structurally better airline.

See historical and forward estimates for United Airlines stock (It’s free!) >>>
The Structural Bet, and Where the Model Pushes Back
CEO Scott Kirby spent much of the call arguing that airline economics have permanently changed. His framing was blunt: “economic gravity always wins.” Airport fees, labor, and maintenance costs have risen and harmonized across every carrier, and roughly 90% of this year’s fare increases come from that cost structure rather than capacity discipline a rival could undo. Fares still sit about 13% below pre-pandemic levels in real terms, leaving room to keep climbing. United backs the argument with spending: it expects close to 1,000 Starlink-equipped aircraft by year-end, a free fast-WiFi rollout that Delta and American are years behind on, and its first Boeing MAX 10 in mid-to-late 2027, an aircraft management calls best-in-class on unit cost.
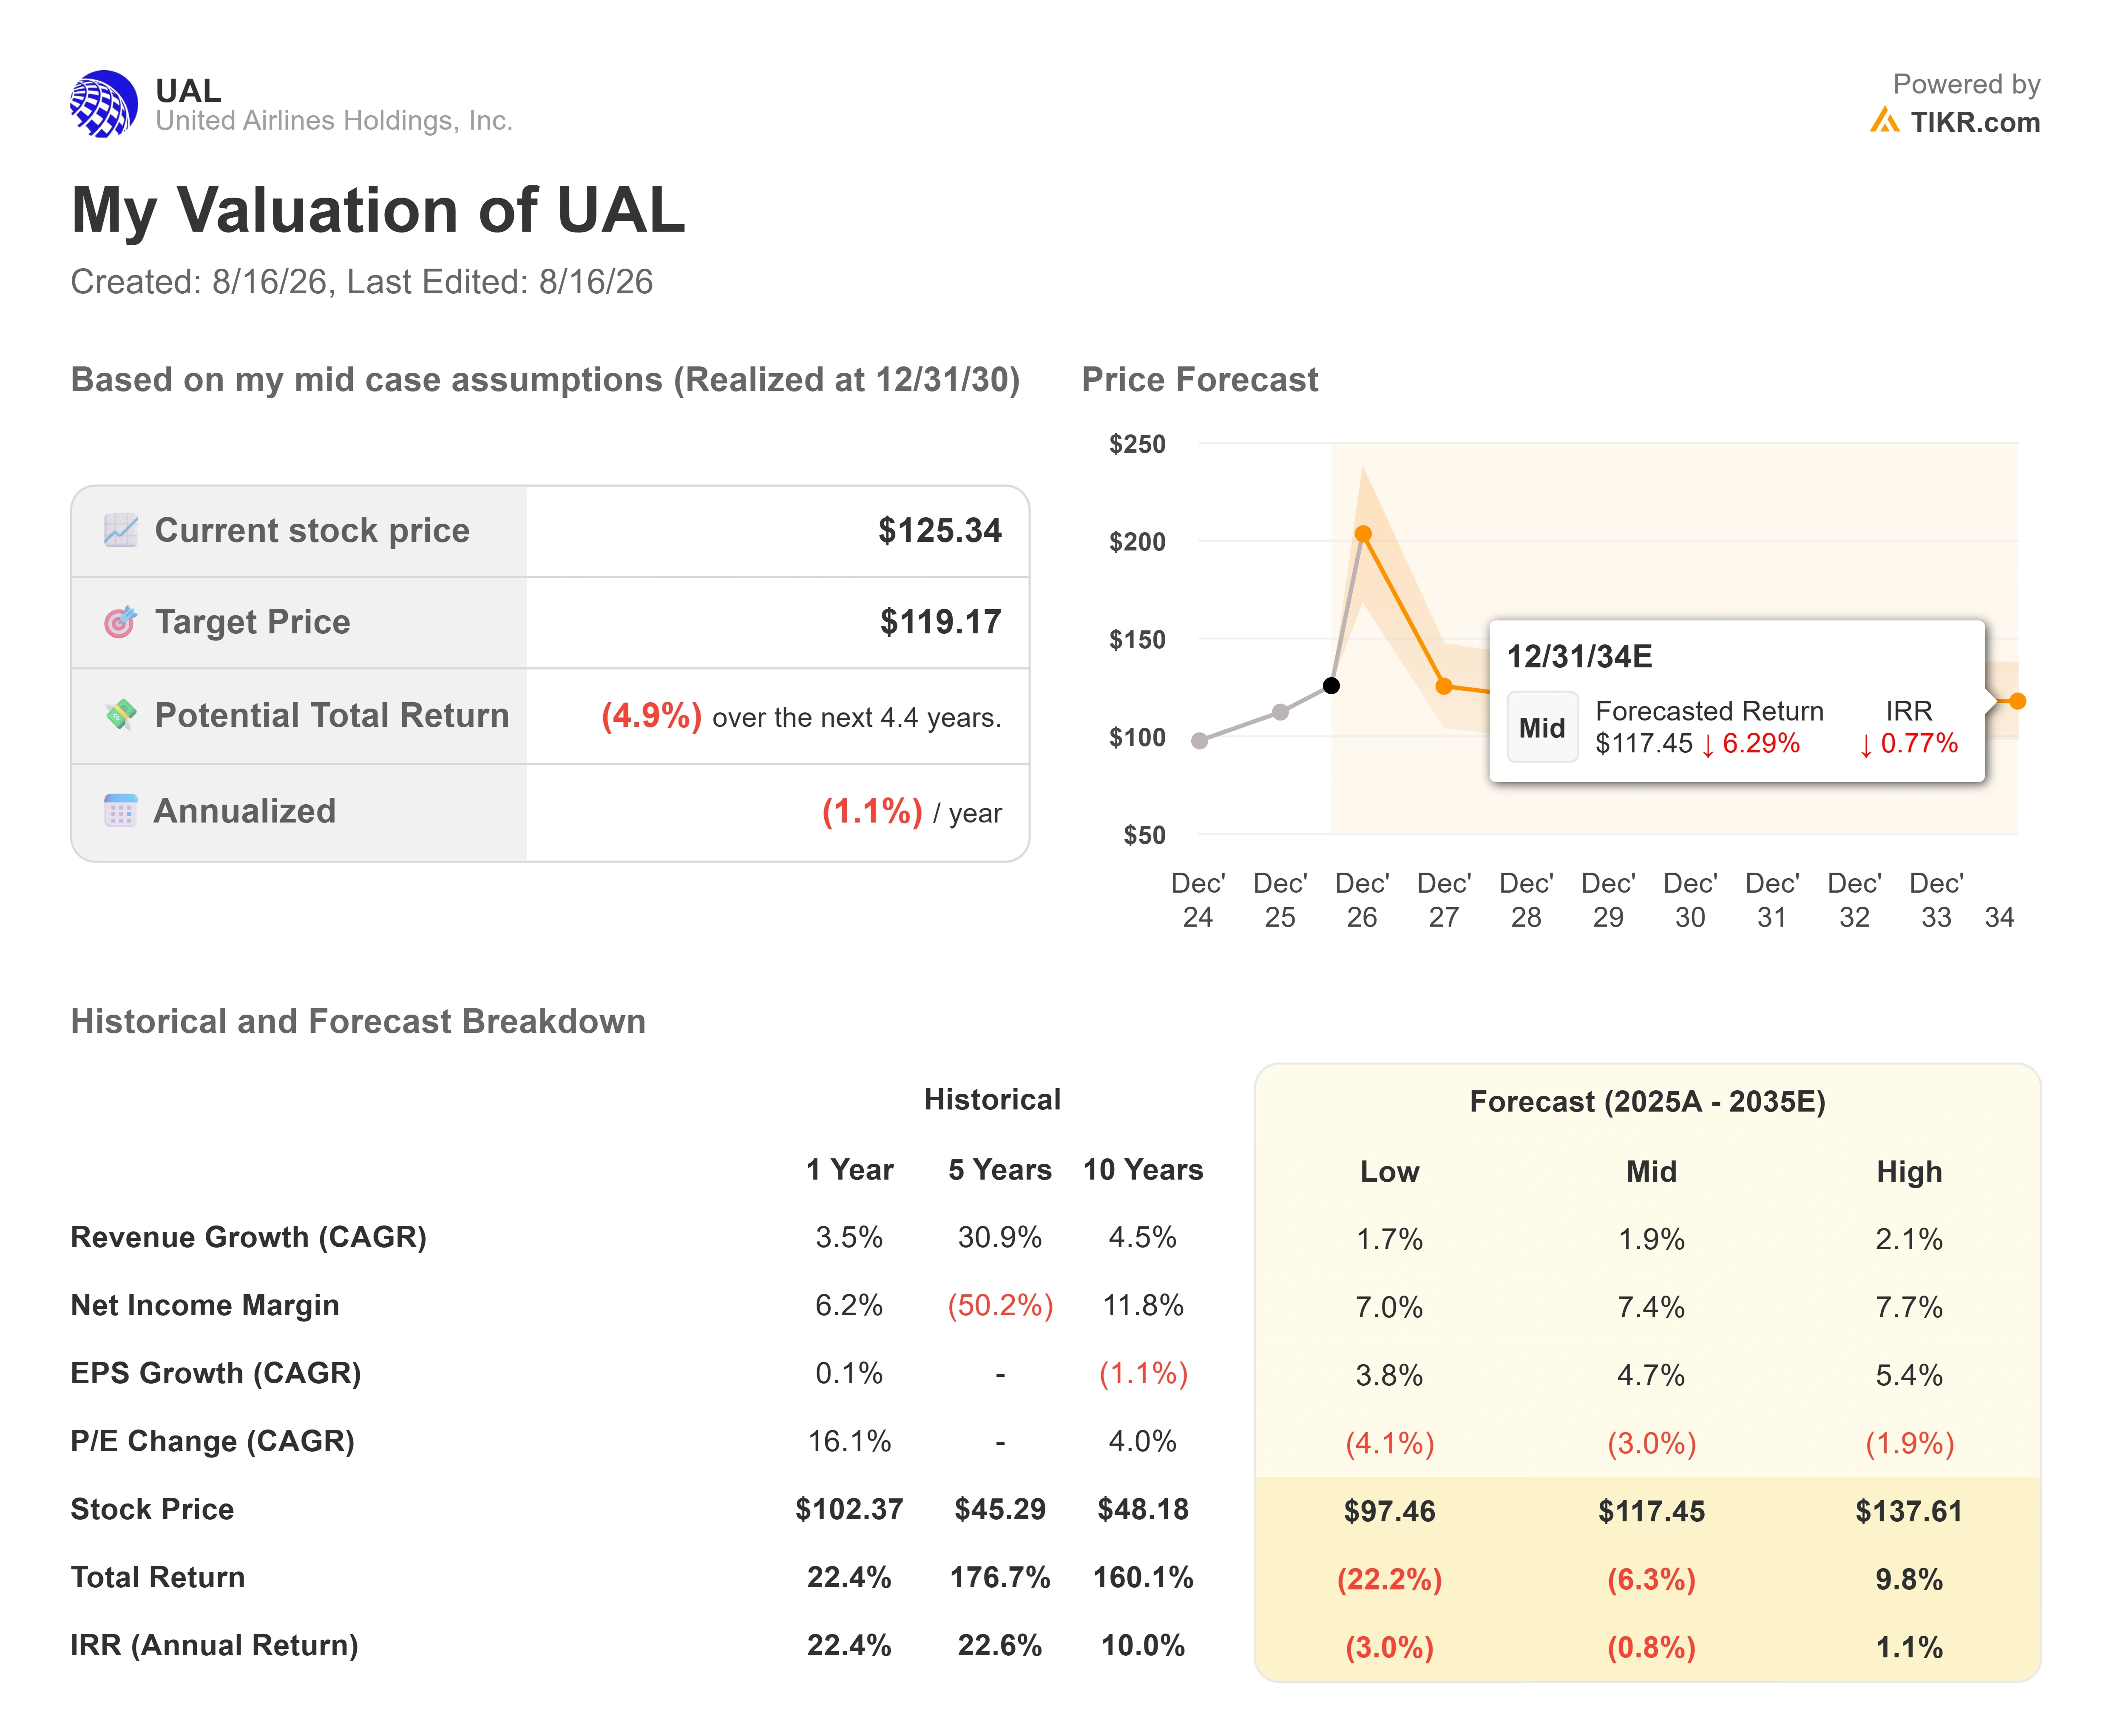
TIKR’s model runs on consensus through 2030, and that horizon is where the cases separate. Consensus has normalized EPS recovering from about $10 this year to roughly $15 in 2027 and near $18 by 2028 as fuel normalizes. The snapback is real. What the model then assumes is a mid-case revenue CAGR of only about 2% through 2030, with net income margin near 7% and a modestly compressing multiple. Those are not aggressive inputs, and that is the point: once the fuel snapback is behind United, the model sees a mature domestic business growing with GDP and international flying a little faster, not a franchise compounding fast enough to earn a much higher price. The mid case lands near $119, a total return of about negative 5%. The high case, with margins near 8%, reaches about $138. Even the optimistic scenario falls short of the Street’s $162.
Two revenue drivers carry whatever upside exists: premium and international. Premium capacity is growing faster than the main cabin by design, and CCO Andrew Nocella flagged an 80% yield premium on corporate travel, still sitting five load-factor points below pre-COVID levels. The margin driver is fuel recovery converting into durable pricing rather than a temporary pass-through, the path CFO Mike Leskinen ties to his double-digit 2027 margin call.
The primary risk is the one that an analyst pressed Kirby on directly: ” Industry structure is only as good as the least rational carrier,” and about 10% of pricing depends on competitors not chasing share when fuel falls. The valuation is undemanding, at roughly 9x forward earnings and under 6x forward EV/EBITDA, so the stock does not need a re-rating to work. It needs the 2027 margin promise to become an actual number.

See how United Airlines performs against its peers in TIKR (It’s free!) >>>
TIKR Advanced Model Analysis
- Current Price: $125.34
- Target Price (Mid): ~$119
- Potential Total Return: ~(5%)
- Annualized IRR: ~(1%) / year
See analysts’ growth forecasts and price targets for United Airlines stock (It’s free!) >>>
Using the mid case as the honest baseline, the model values United near $119 through 2030, a small negative total return from today’s price. The two revenue drivers are premium-cabin expansion outpacing main-cabin capacity and faster international growth against a mature domestic market. The margin driver is fuel recovery hardening into durable yield gains; the primary risk is competitive pricing discipline unwinding when fuel falls.
- Upside: full fuel recovery plus the premium and loyalty flywheel lifts margins to management’s double-digit target, and the high case near $138 comes into view.
- Downside: growth normalizes toward 2%, a competitor breaks ranks, and a stock that already caught most of its recovery drifts to the mid-case $119.
Conclusion
The number that settles this is the 2027 margin. Leskinen said United will exit 2026 at a second-half revenue run rate that “on its own” implies double-digit margins for 2027. Watch the Q3 print in mid-October. If adjusted EPS lands in or above the $2.50 to $3.50 guide and management holds the 2027 margin call, the Street’s $162 starts to look defensible, and the model’s caution gets tested. If Q3 comes in soft, or the 2027 language turns conditional the way this quarter’s fuel math did, the gap closes toward $119 instead. The stock is not asking whether United is a great airline. It is asking what you pay for one after the easy part of the recovery is already priced.
See what stocks billionaire investors are buying so you can follow the smart money with TIKR.
Should You Invest in United Airlines?
The only way to really know is to look at the numbers yourself. TIKR gives you free access to the same institutional-quality financial data that professional analysts use to answer exactly that question.
Pull up United Airlines, and you’ll see years of historical financials, what Wall Street analysts expect for revenue and earnings in the quarters ahead, how valuation multiples have moved over time, and whether price targets are trending up or down.
You can build a free watchlist to track United Airlines alongside every other stock on your radar. No credit card required. Just the data you need to decide for yourself.
Analyze United Airlines on TIKR Free →
Looking for New Opportunities?
- See what stocks billionaire investors are buying so you can follow the smart money.
- Analyze stocks in as little as 5 minutes with TIKR’s all-in-one, easy-to-use platform.
- The more rocks you overturn… the more opportunities you’ll uncover. Search 100K+ global stocks, global top investor holdings, and more with TIKR.
Disclaimer:
Please note that the articles on TIKR are not intended to serve as investment or financial advice from TIKR or our content team, nor are they recommendations to buy or sell any stocks. We create our content based on TIKR Terminal’s investment data and analysts’ estimates. Our analysis might not include recent company news or important updates. TIKR has no position in any stocks mentioned. Thank you for reading, and happy investing!