
Experienced investors already know revenue growth is the metric that cuts straight through the noise. It shows whether real demand is expanding, whether management is executing, and whether the business has genuine compounding power over the long haul.
Yet those same free tools almost always stop at the headline number. They rarely reveal segment contributions, pricing versus volume drivers, true peer comparisons, or credible forward estimates. Without that context, even a strong “25% growth” figure can mislead or already sit fully priced in.
That’s exactly why most free revenue-growth resources work best as quick filters rather than complete decision engines. You know the deeper questions that matter: Is growth accelerating or quietly slowing? Is growth sustainable or propped up by one-time factors? How does a company’s growth really stack up once you adjust for industry cycles? Serious investment analysis demands the ability to drill down, test assumptions, and connect today’s trends directly to tomorrow’s valuation.
You’ve likely bounced between tabs and spreadsheets enough times to recognize the frustration. Once you move beyond basic charts into a seamless end-to-end process, everything changes for investors who expect more than surface-level snapshots.
The Best Free Tools to Analyze a Stock’s Growth Trends
Track the detailed financials of thousands of stocks with TIKR (It’s free) >>>
1. TIKR
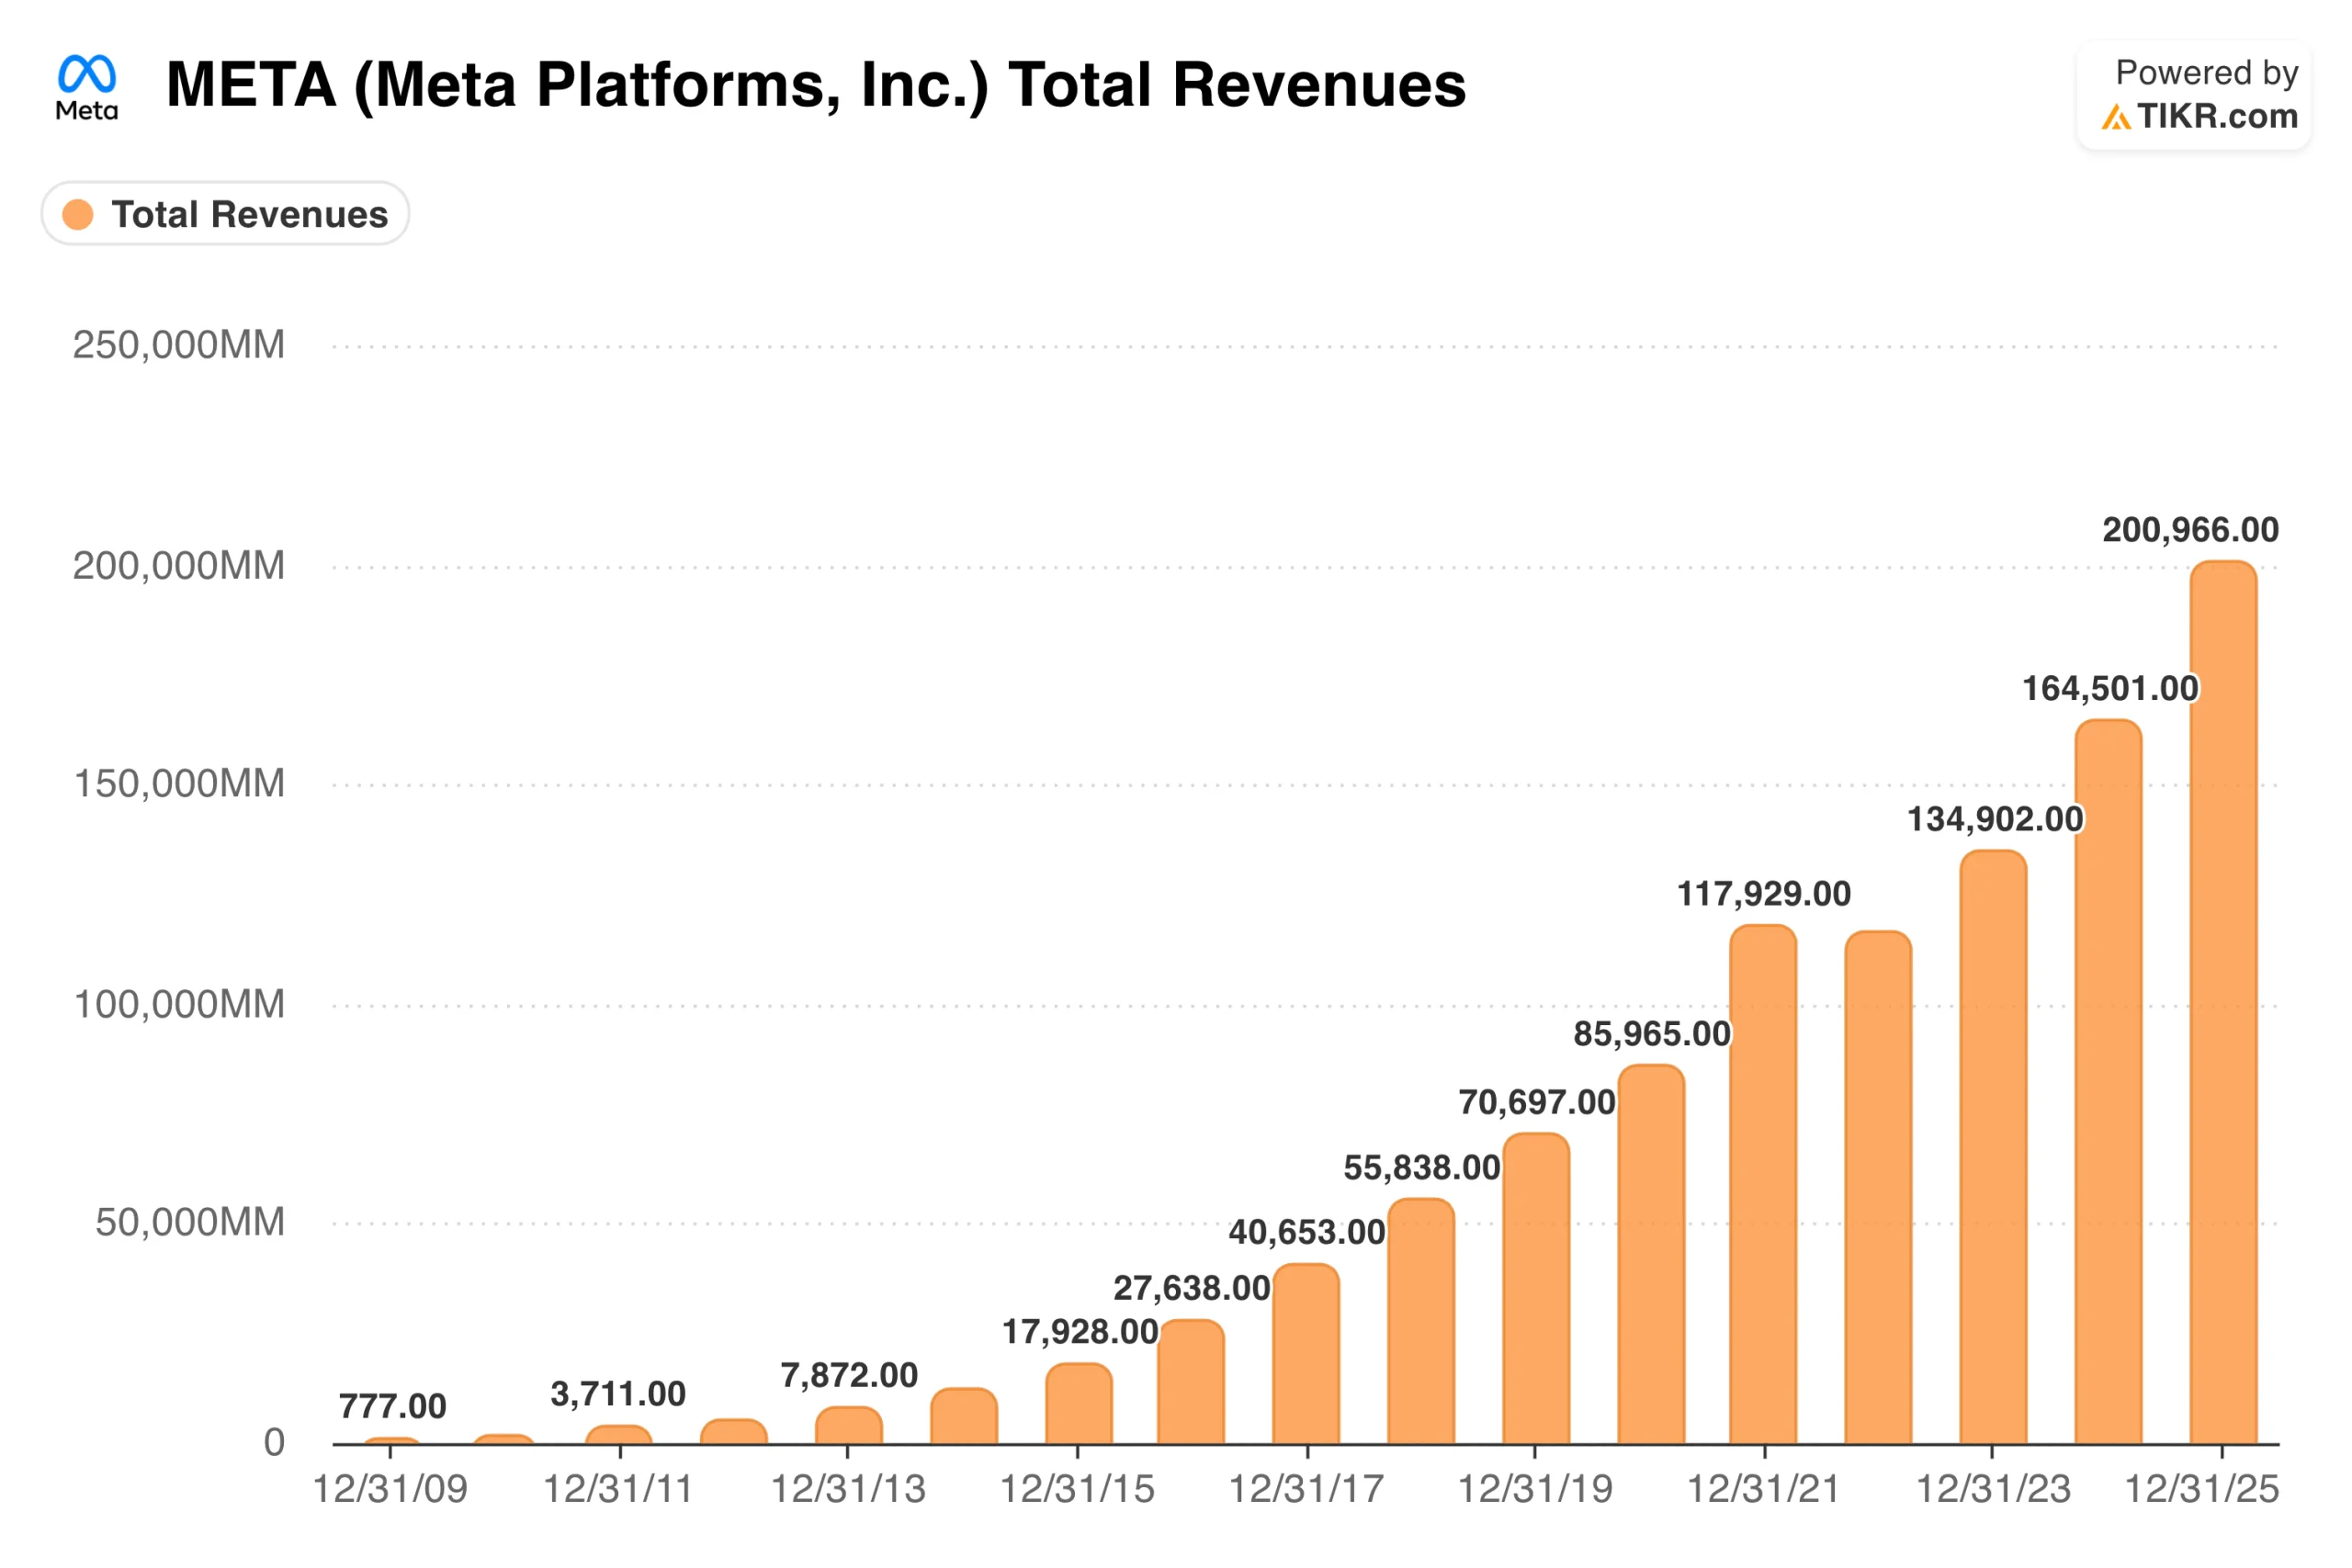
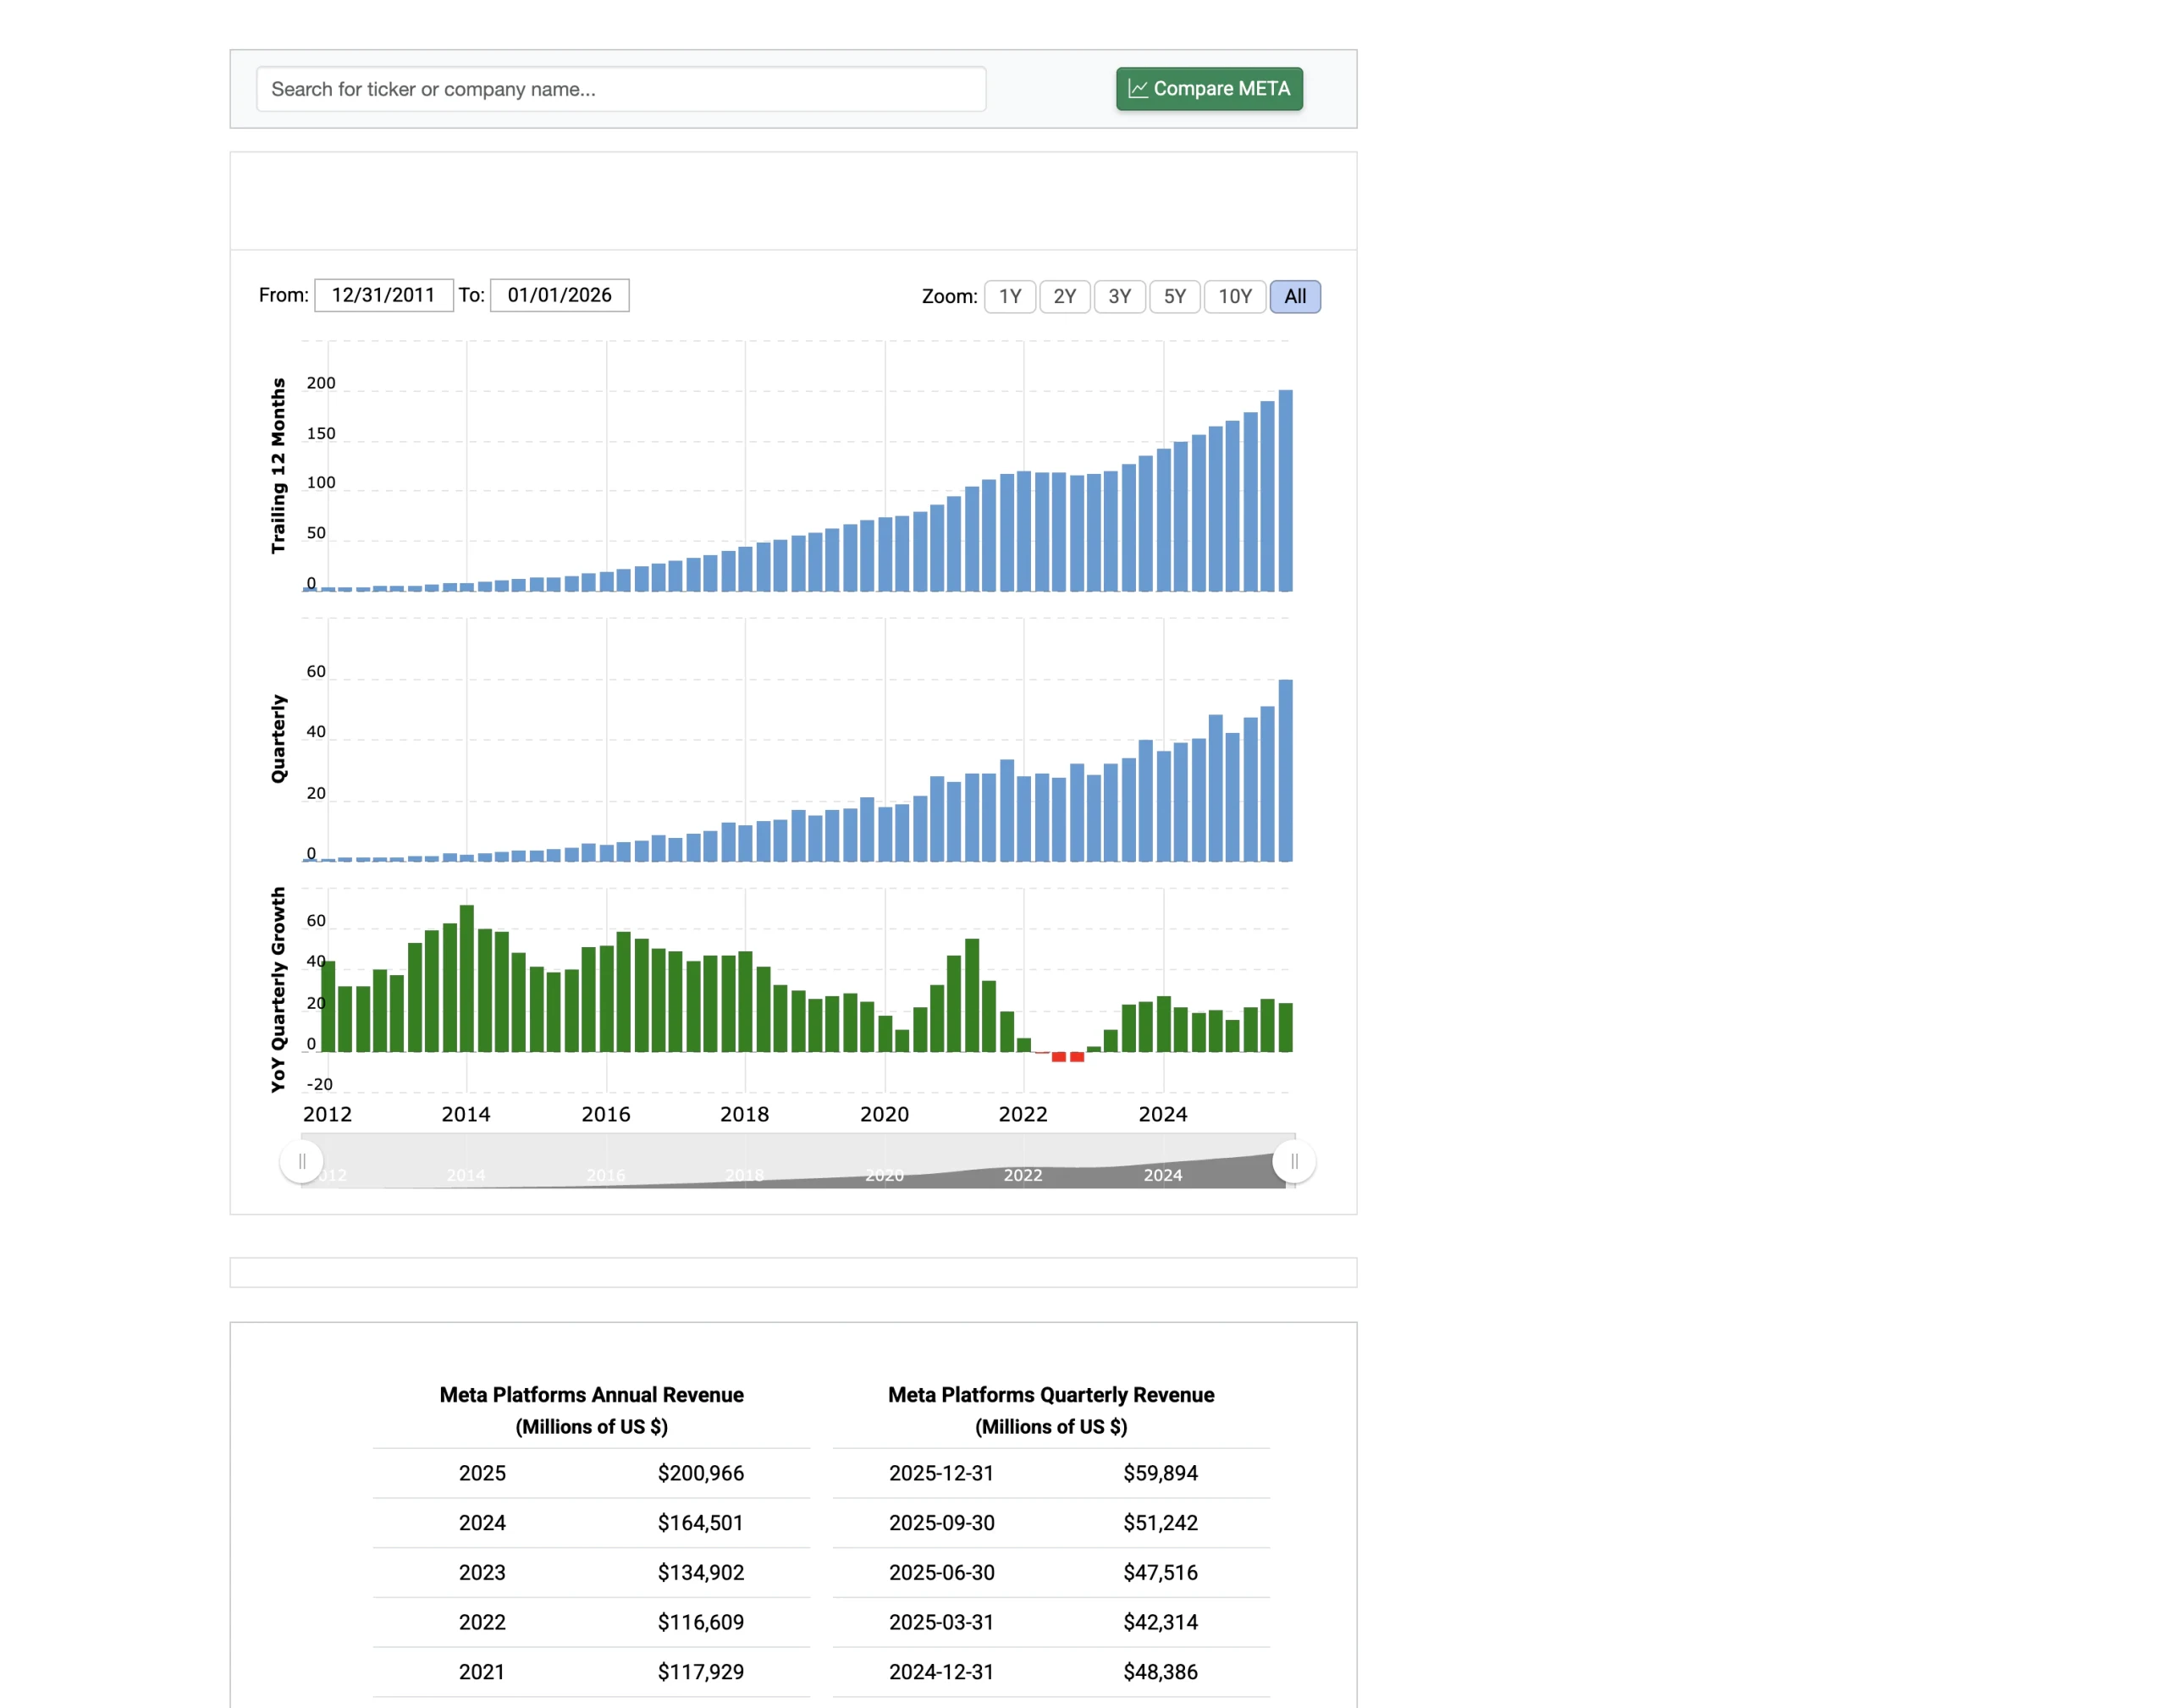
TIKR sits at the top of this list of free tools because it gives you the entire revenue-growth workflow inside one fast platform, no tab switching, no spreadsheets, no lost context.
You instantly access up to 3 years of clean total revenue figures on TIKR free (20 years on TIKR Pro), audited history, segment-level breakdowns (where available), live YoY and CAGR calculations, and real-time Wall Street consensus revenue estimates for next year and the next five years. From there, you move straight into the projection engine to stress-test volume, pricing, market share, and new-product assumptions yourself, then watch every change flow directly into valuation.
This seamless integration is why TIKR stands alone as the only free tool that lets experienced investors complete every step, from raw data to custom scenarios and valuation impact, without ever leaving the platform.
Best features:
- 20-year historical revenue with every growth rate pre-calculated
- Global screener filtering thousands of stocks by any revenue metric
- Live analyst consensus revenue forecasts you can override in seconds
- Built-in multi-stage modeler that links your assumptions straight to fair value
- Peer-group comparison charts with margin-trend overlays, all in one view
Use revenue history to find stocks that will increase in value over time with TIKR (It’s free) >>>
2. Macrotrends Free Revenue Charts
When you need the longest historical runway possible, Macrotrends remains the go-to destination. The site offers clean, interactive charts that span 10-20 years for most U.S.-listed companies, complete with automatic YoY growth rates, 5-year and 10-year CAGRs, trend lines, and the ability to toggle between absolute dollars and percentages.
For larger firms, you’ll often find segment revenue detail as well, making it easier to spot secular shifts or cyclical patterns that shorter data sets simply miss. One-click CSV export lets you pull the full series into your own models if needed.
This depth of history makes it an ideal foundation for understanding long-term revenue cycles before you layer in your own forward-looking assumptions. Ultimately, it is an incredible resource for 20-30 year historical data, but it is strictly a “rear-view mirror” tool. It completely lacks forward-looking analyst estimates, real-time news integration, and the ability to build custom, live dashboards to compare multiple stocks side-by-side.
Review stock fundamentals in less than 60 seconds with TIKR (It’s free) >>>
3. Yahoo Finance Historical Financials
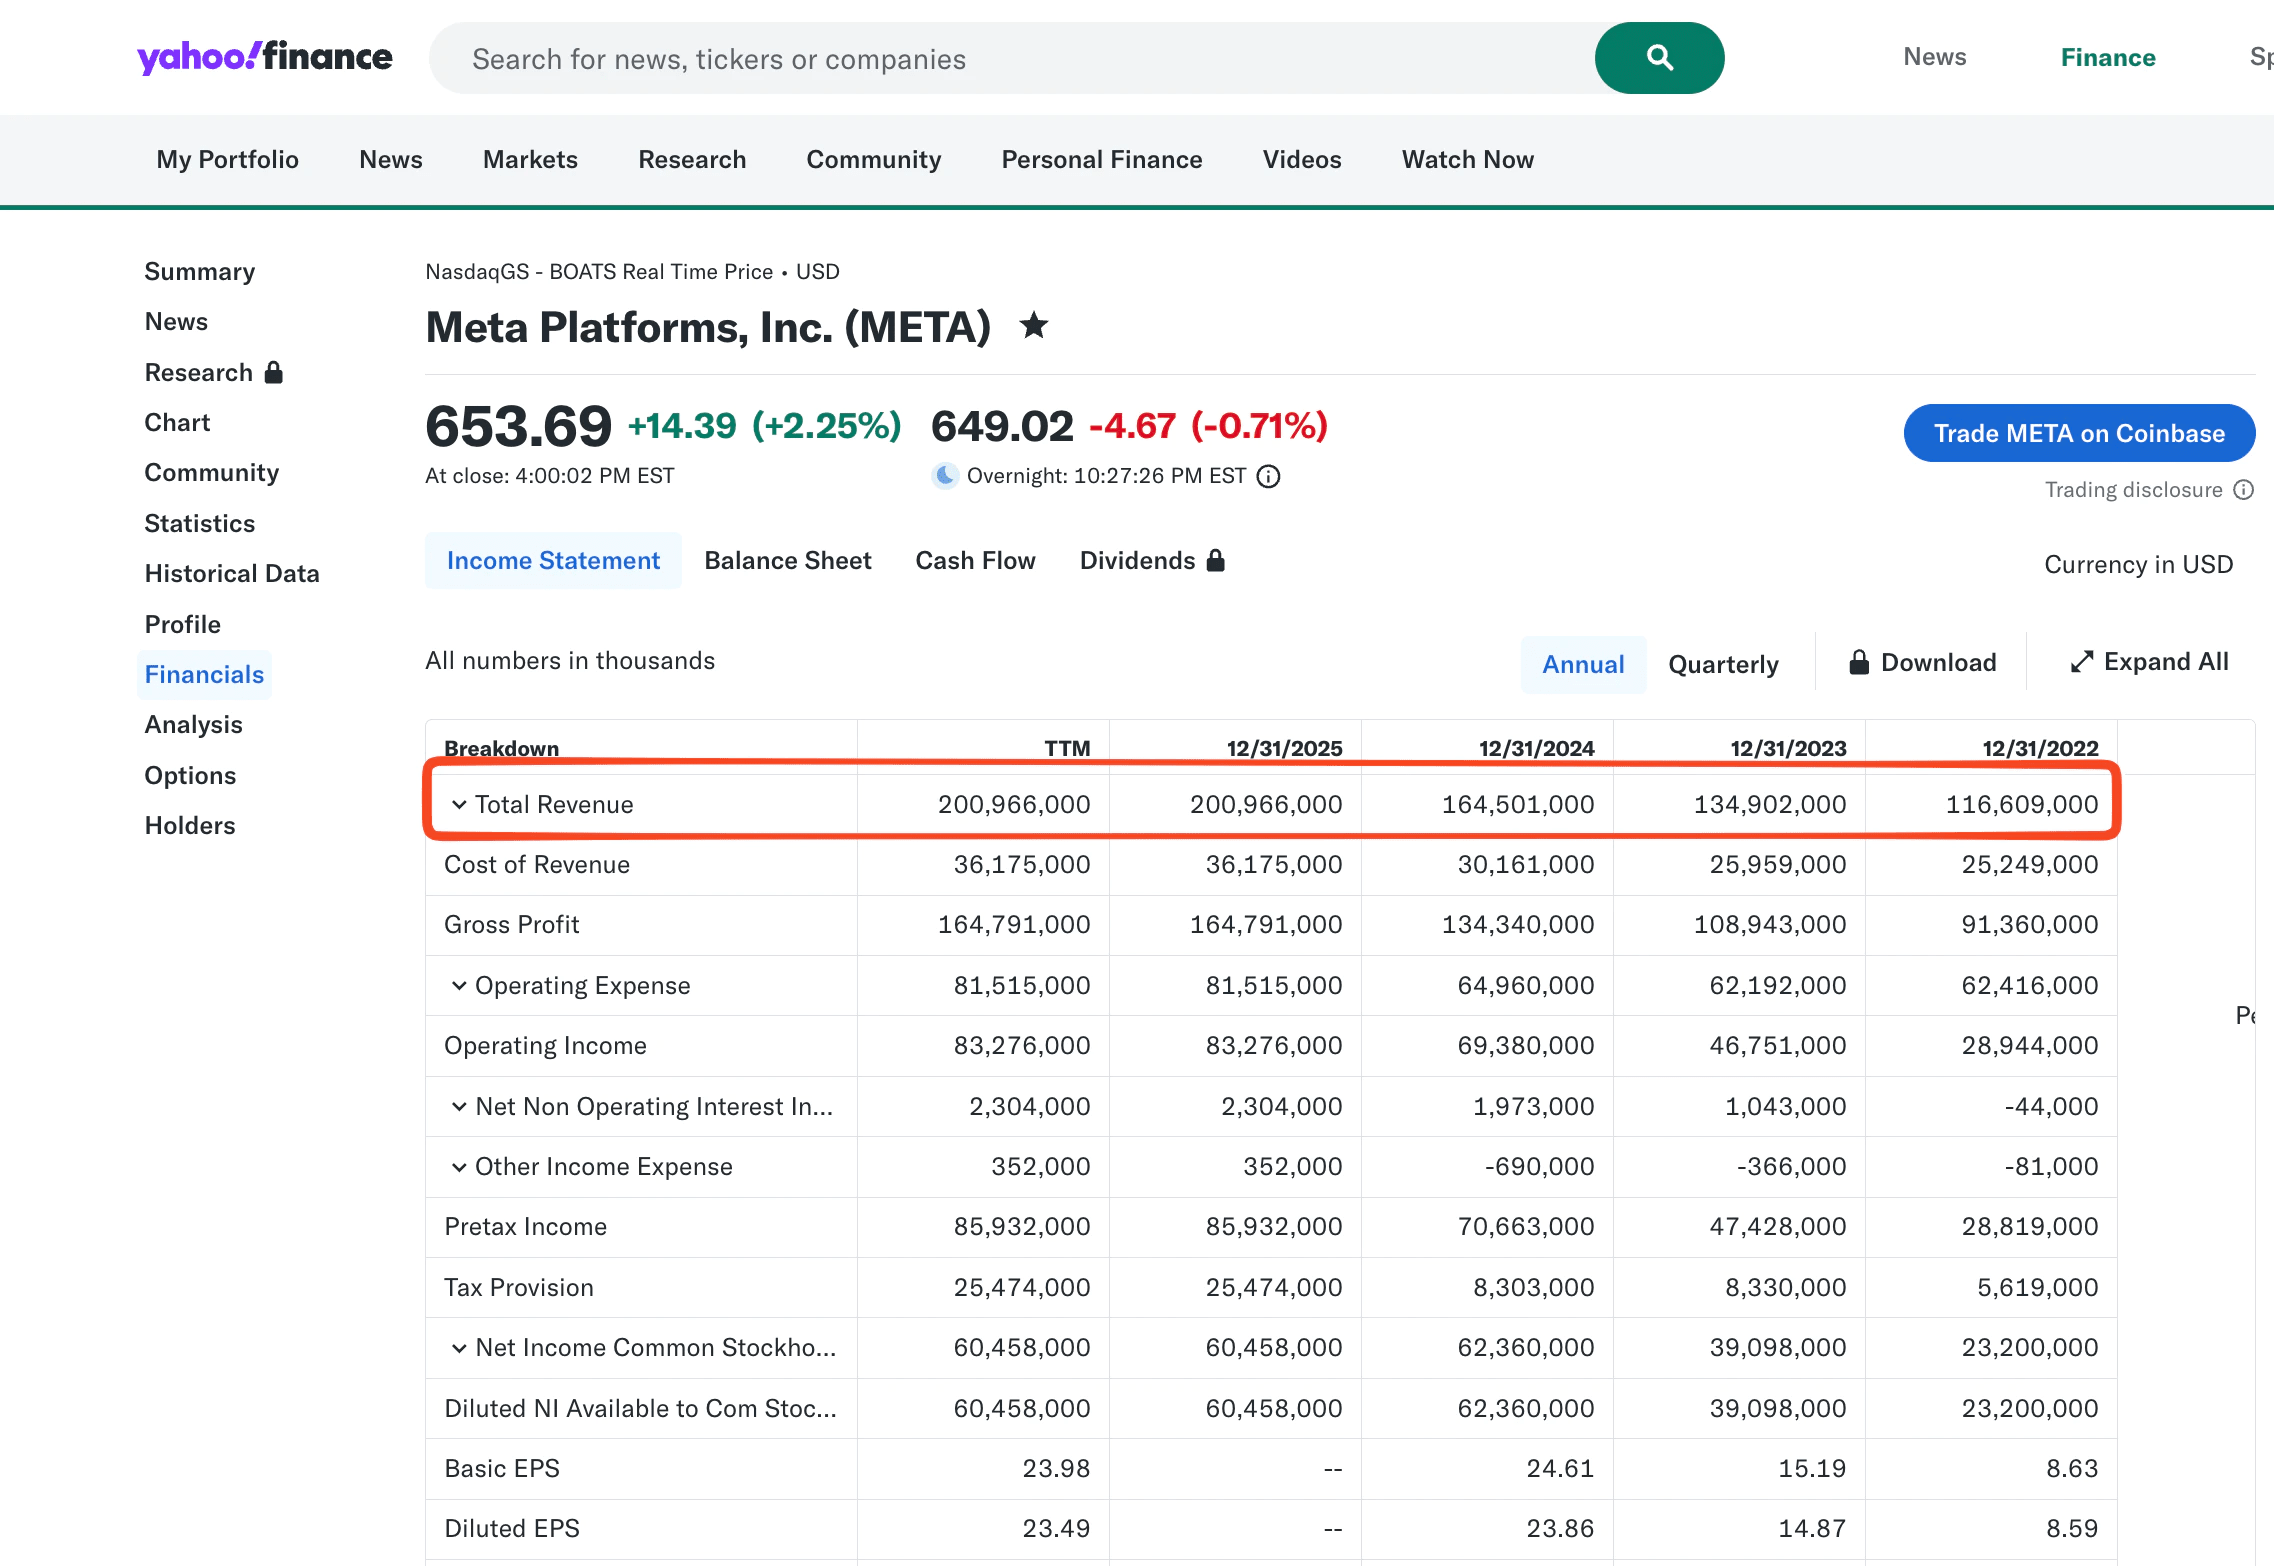
Yahoo Finance delivers speed and familiarity when you’re scanning watchlists or confirming growth stories on the go. Open the statistics tab, and you immediately see the last 4 years of annual and quarterly revenue with built-in YoY growth percentages, plus clean side-by-side views of gross and operating margins for the same periods. One-click Excel downloads give you the full statements to slice however you like, and the entire page updates the moment new earnings hit the wire.
Its instant updates and mobile-friendly design make it especially handy for rapid validation during fast-paced research sessions. While excellent for a quick snapshot, Yahoo Finance lacks the deep, 10+ year standardized financial histories and advanced, customizable screening needed for thorough trend analysis. Its interface is also cluttered, making consistent, deep fundamental research cumbersome compared to dedicated financial terminals.
4. Finviz Growth Screener
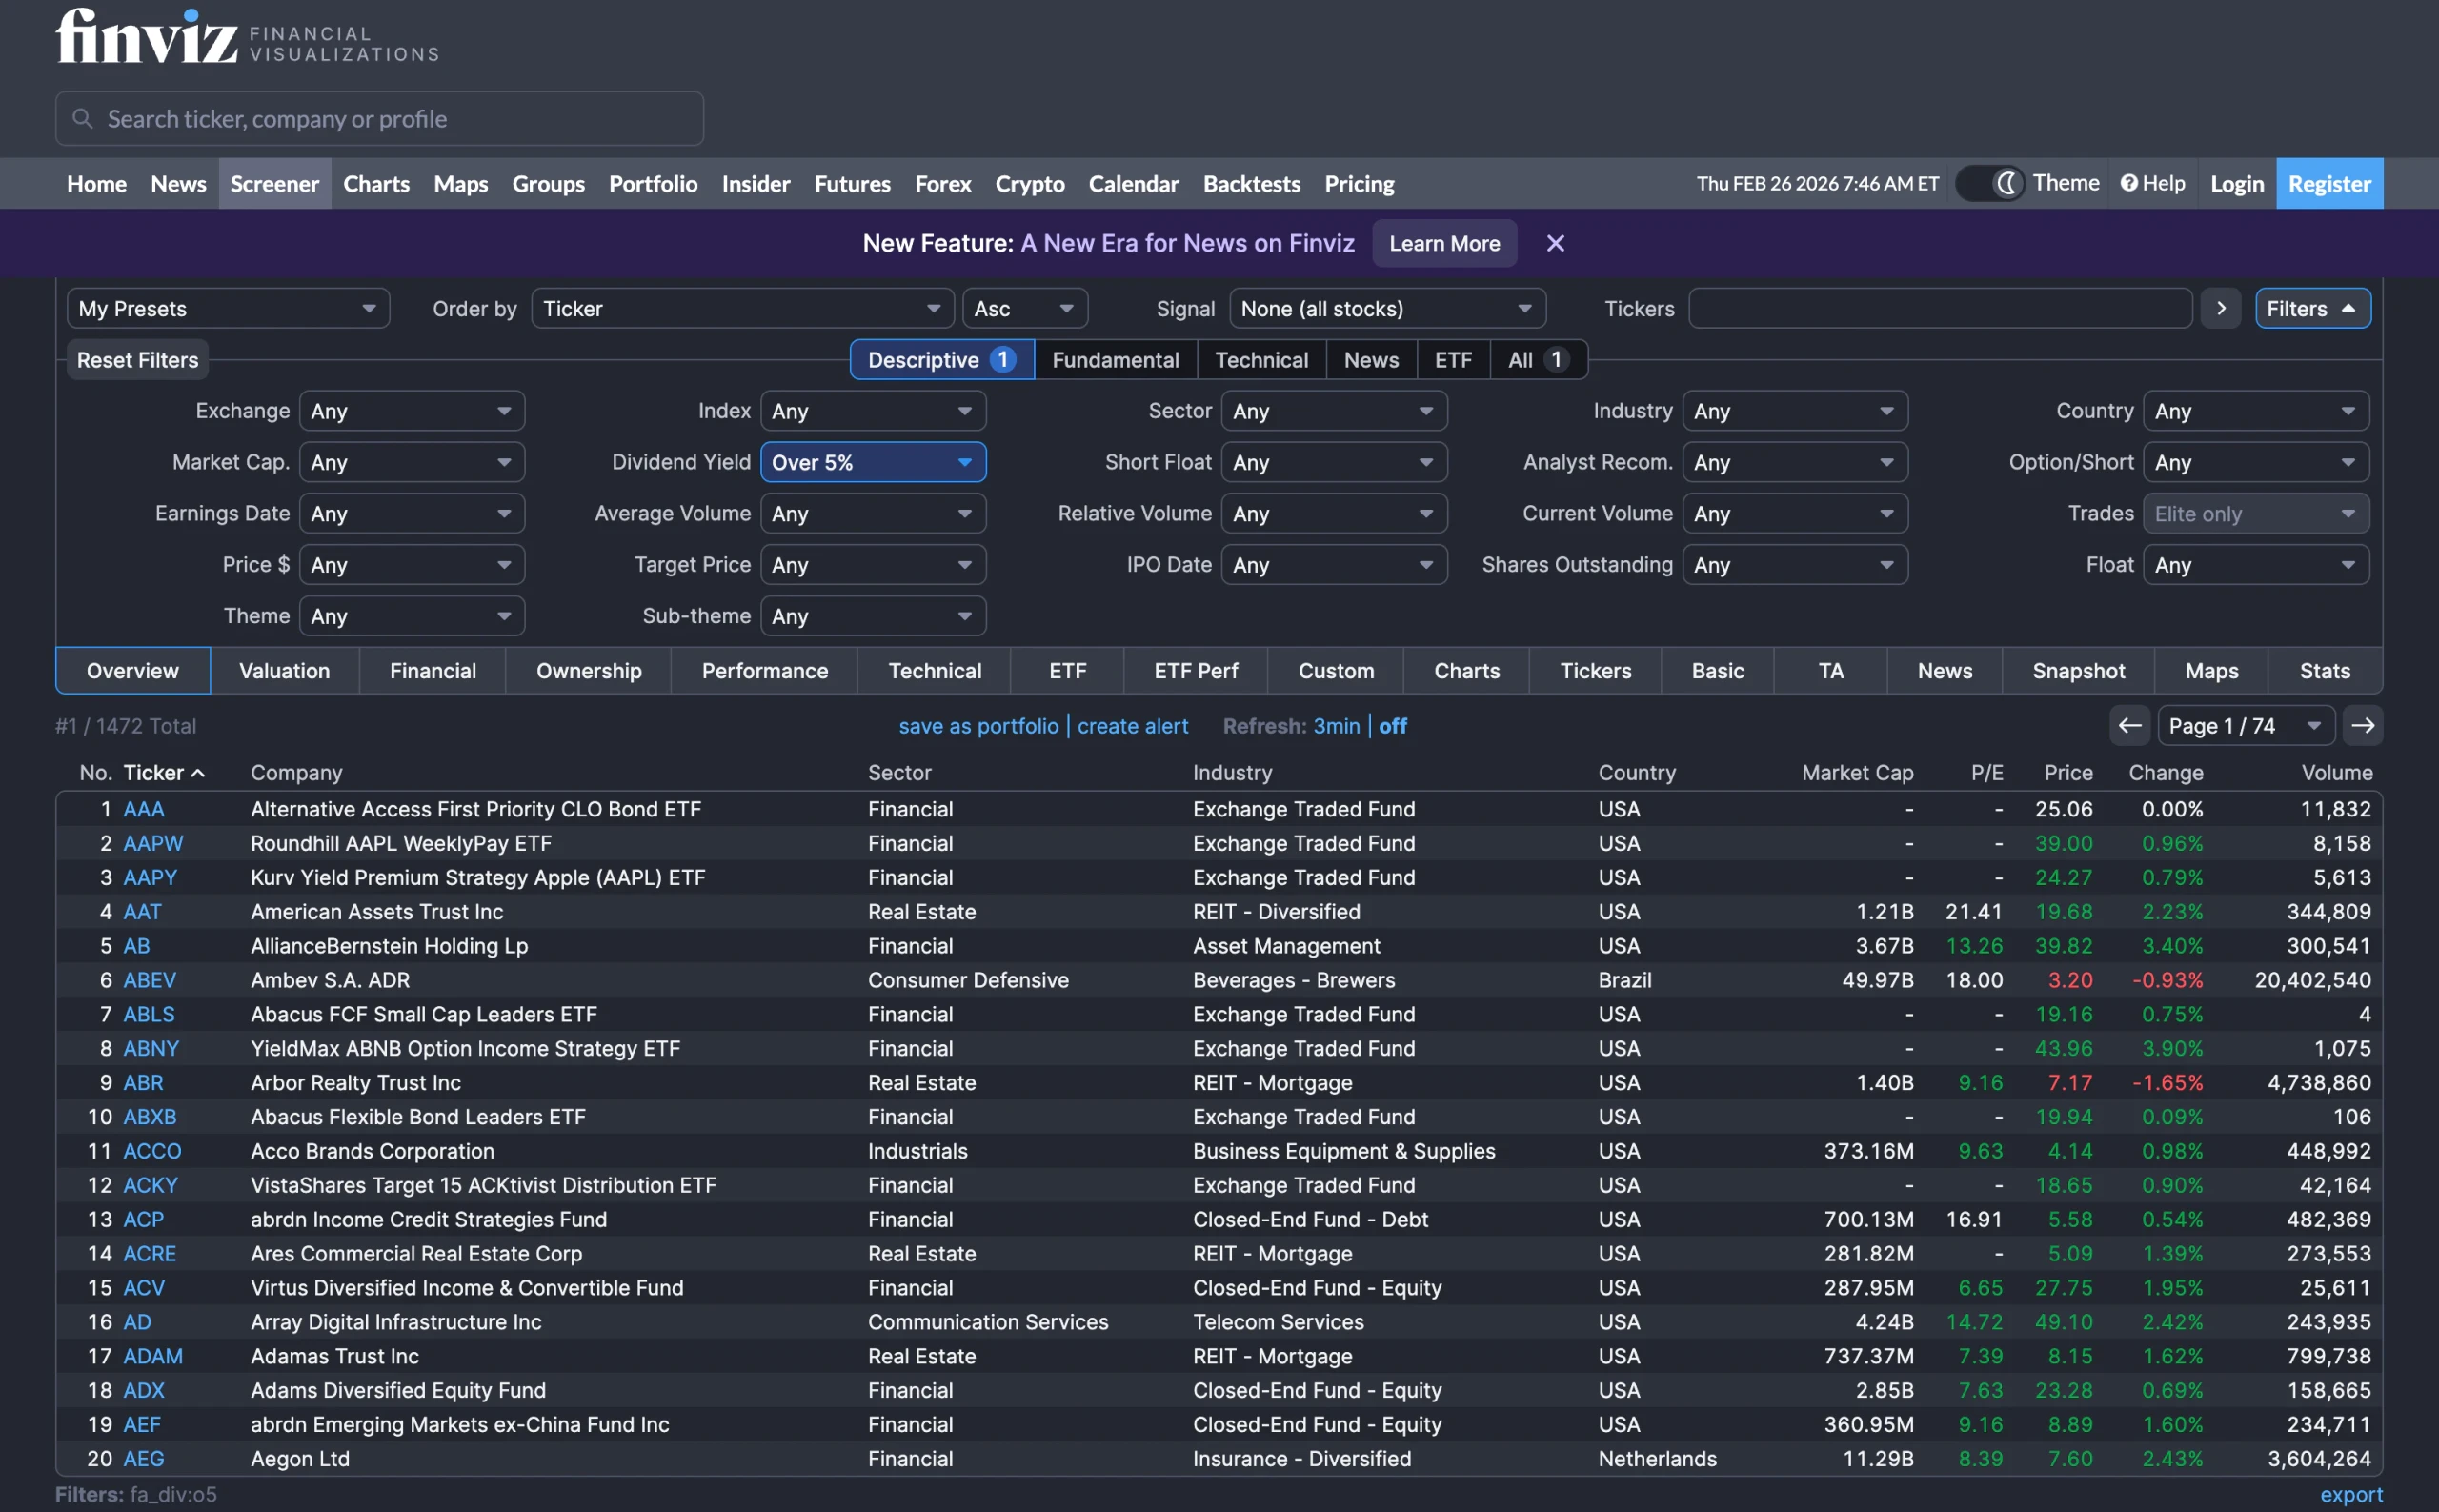
Finviz turns the whole market into an efficient hunting ground for revenue momentum. In just a few clicks, you screen for companies posting 5%+, 10%+, or review target pricing, then layer on market-cap, sector, or profitability filters. Results appear as sortable tables, heat-maps, or mini-charts that let you spot patterns instantly, and you can export up to 100 tickers or save custom screens with email alerts.
This combination of speed and flexibility lets you quickly surface a focused shortlist of momentum names worth deeper investigation later. While it is a powerhouse for visual screening and identifying market trends, Finviz is primarily a snapshot tool rather than a deep research platform.
It lacks the deep, multi-decade historical financial statements and comprehensive consensus analyst estimates required for rigorous growth trend analysis, and free users are restricted to delayed market data (15 minutes).
5. TradingView Fundamentals & Charts
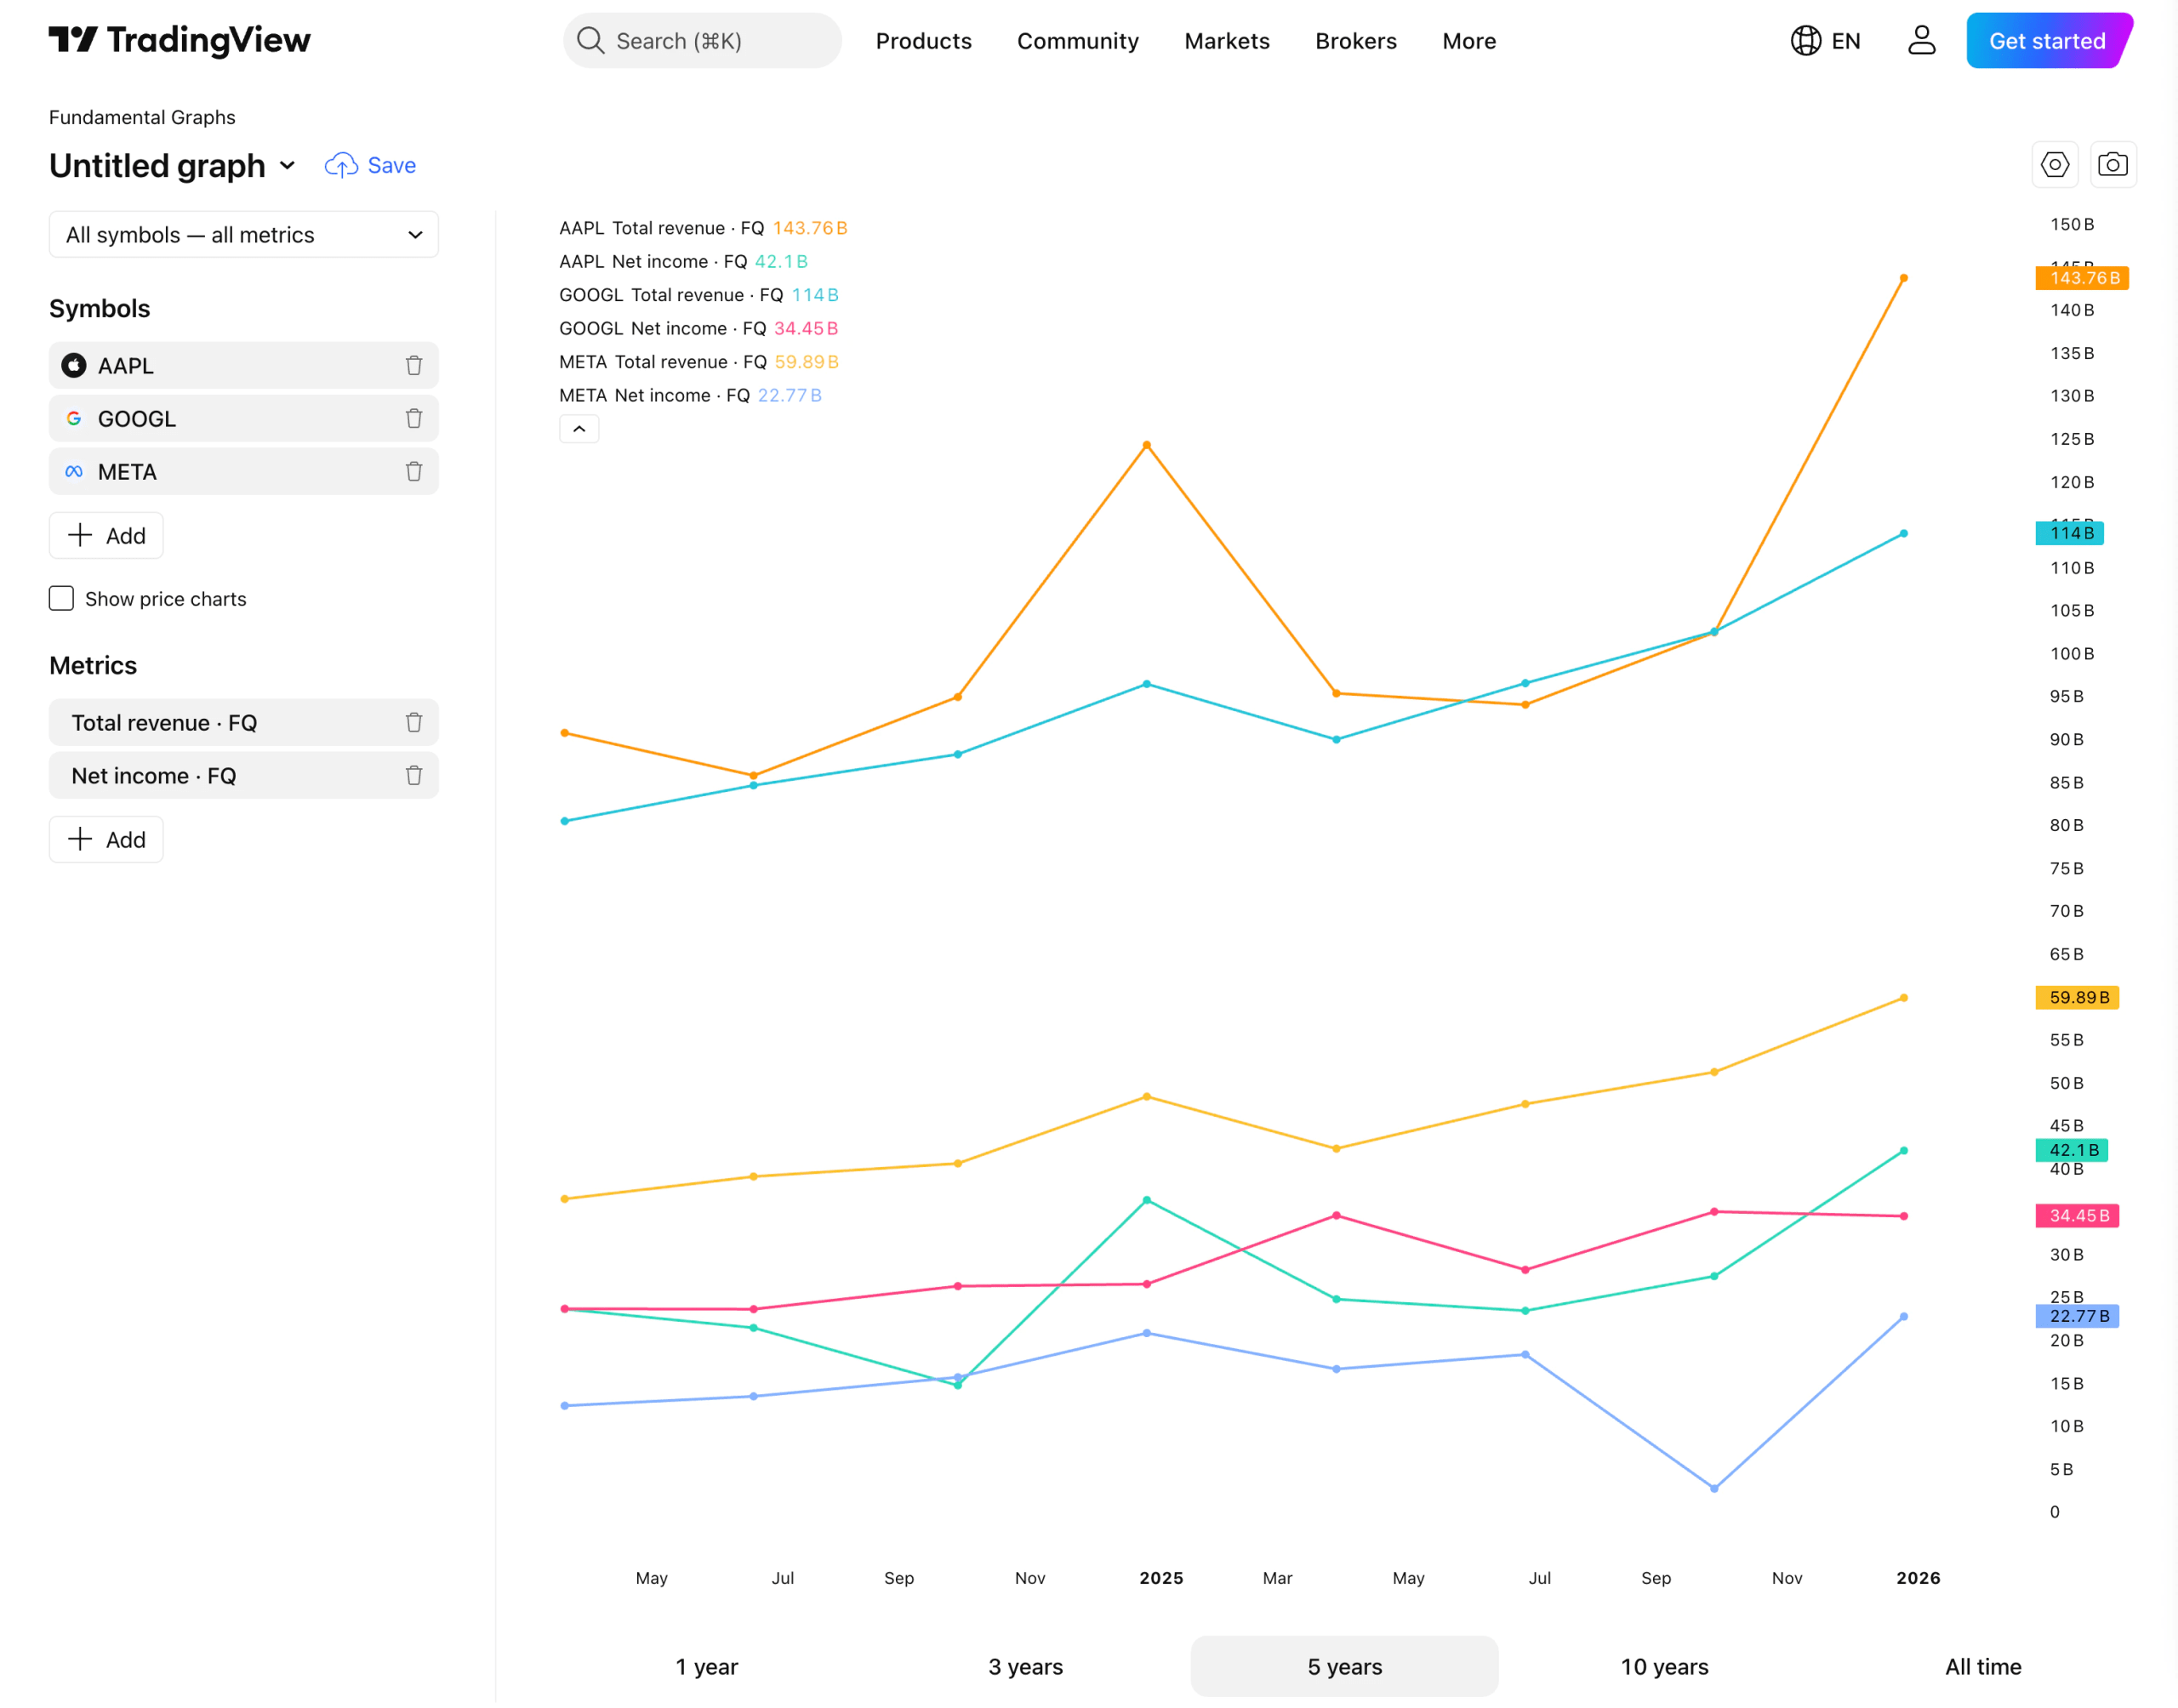
TradingView excels when you want revenue growth alongside price action. You can overlay revenue bars or lines directly on the chart, synchronize multiple tickers on the same screen, and watch automatic YoY calculations update in real time. The fundamentals tab presents clean historical data, while the community ideas section often includes annotations from other seasoned investors studying the exact same trends.
The tight integration of growth data with price movements gives visual investors valuable context when evaluating both fundamentals and technical signals. TradingView is the gold standard for technical analysis and price action, but it falls short on fundamental depth. It does not offer the granular, standardized financial statement history or the consensus estimate data required to properly analyze a company’s long-term growth trajectory.
Track detailed financials of all of your favorite stocks with TIKR (It’s free) >>>
TIKR Takeaway
Inside TIKR, you screen thousands of global stocks by any revenue metric that matters to you, pull 20 years of audited history with every growth rate already calculated, review and override live Wall Street consensus forecasts, then build and save your own multi-stage revenue models by adjusting volume, pricing, market share, and product ramps.
You compare trajectories against custom peer groups, overlay margins, and see every assumption flow straight through to valuation, all without ever leaving TIKR. That seamless workflow is exactly what experienced investors rely on day after day.
Value Any Stock in Under 60 Seconds with TIKR
With TIKR’s new Valuation Model tool, you can estimate a stock’s potential share price in under a minute.
All it takes is three simple inputs:
- Revenue Growth
- Operating Margins
- Exit P/E Multiple
If you’re not sure what to enter, TIKR automatically fills in each input using analysts’ consensus estimates, giving you a quick, reliable starting point.
From there, TIKR calculates the potential share price and total returns under Bull, Base, and Bear scenarios so you can quickly see whether a stock looks undervalued or overvalued.
See a stock’s true value in under 60 seconds (Free with TIKR) >>>
Looking for New Opportunities?
- Discover which stocks billionaire investors are purchasing, so you can follow the smart money.
- Analyze stocks in as little as 5 minutes with TIKR’s all-in-one, easy-to-use platform.
- The more rocks you overturn… the more opportunities you’ll uncover. Search 100K+ global stocks, global top investor holdings, and more with TIKR.
Disclaimer:
Please note that the articles on TIKR are not intended to serve as investment or financial advice from TIKR or our content team, nor are they recommendations to buy or sell any stocks. We create our content based on TIKR Terminal’s investment data and analysts’ estimates. Our analysis might not include recent company news or important updates. TIKR has no position in any stocks mentioned. Thank you for reading, and happy investing!