Key Stats for Snap Inc. (SNAP)
- 52-Week Range: $3.81 to $10.41
- Current Price: $4.70
- Street Mean Target: $7.48
- TIKR Model Target (Mid Case): $8.30
- Market Cap: ~$7.8B
- Q1 2026 Revenue: $1.53B (up 12% YoY)
- Q1 2026 Adjusted EBITDA: $233M (up 115% YoY)
- Q1 2026 Free Cash Flow: $286M (up 150% YoY)
- Daily Active Users: 483M (up 5% YoY)
Now Live: Discover how much upside your favorite stocks could have using TIKR’s new Valuation Model (It’s free)>>>
The Market Has Been Selling Snap All Year. Here’s What the Chart Actually Shows
Snap Inc. (SNAP) started 2026 as one of the most crowded short ideas in consumer tech. The stock peaked above $10 late last year, and what followed was a nearly uninterrupted decline that erased more than half its value by late March.
Even a partial recovery couldn’t hold, and the stock has spent most of the second quarter drifting back toward the lows.
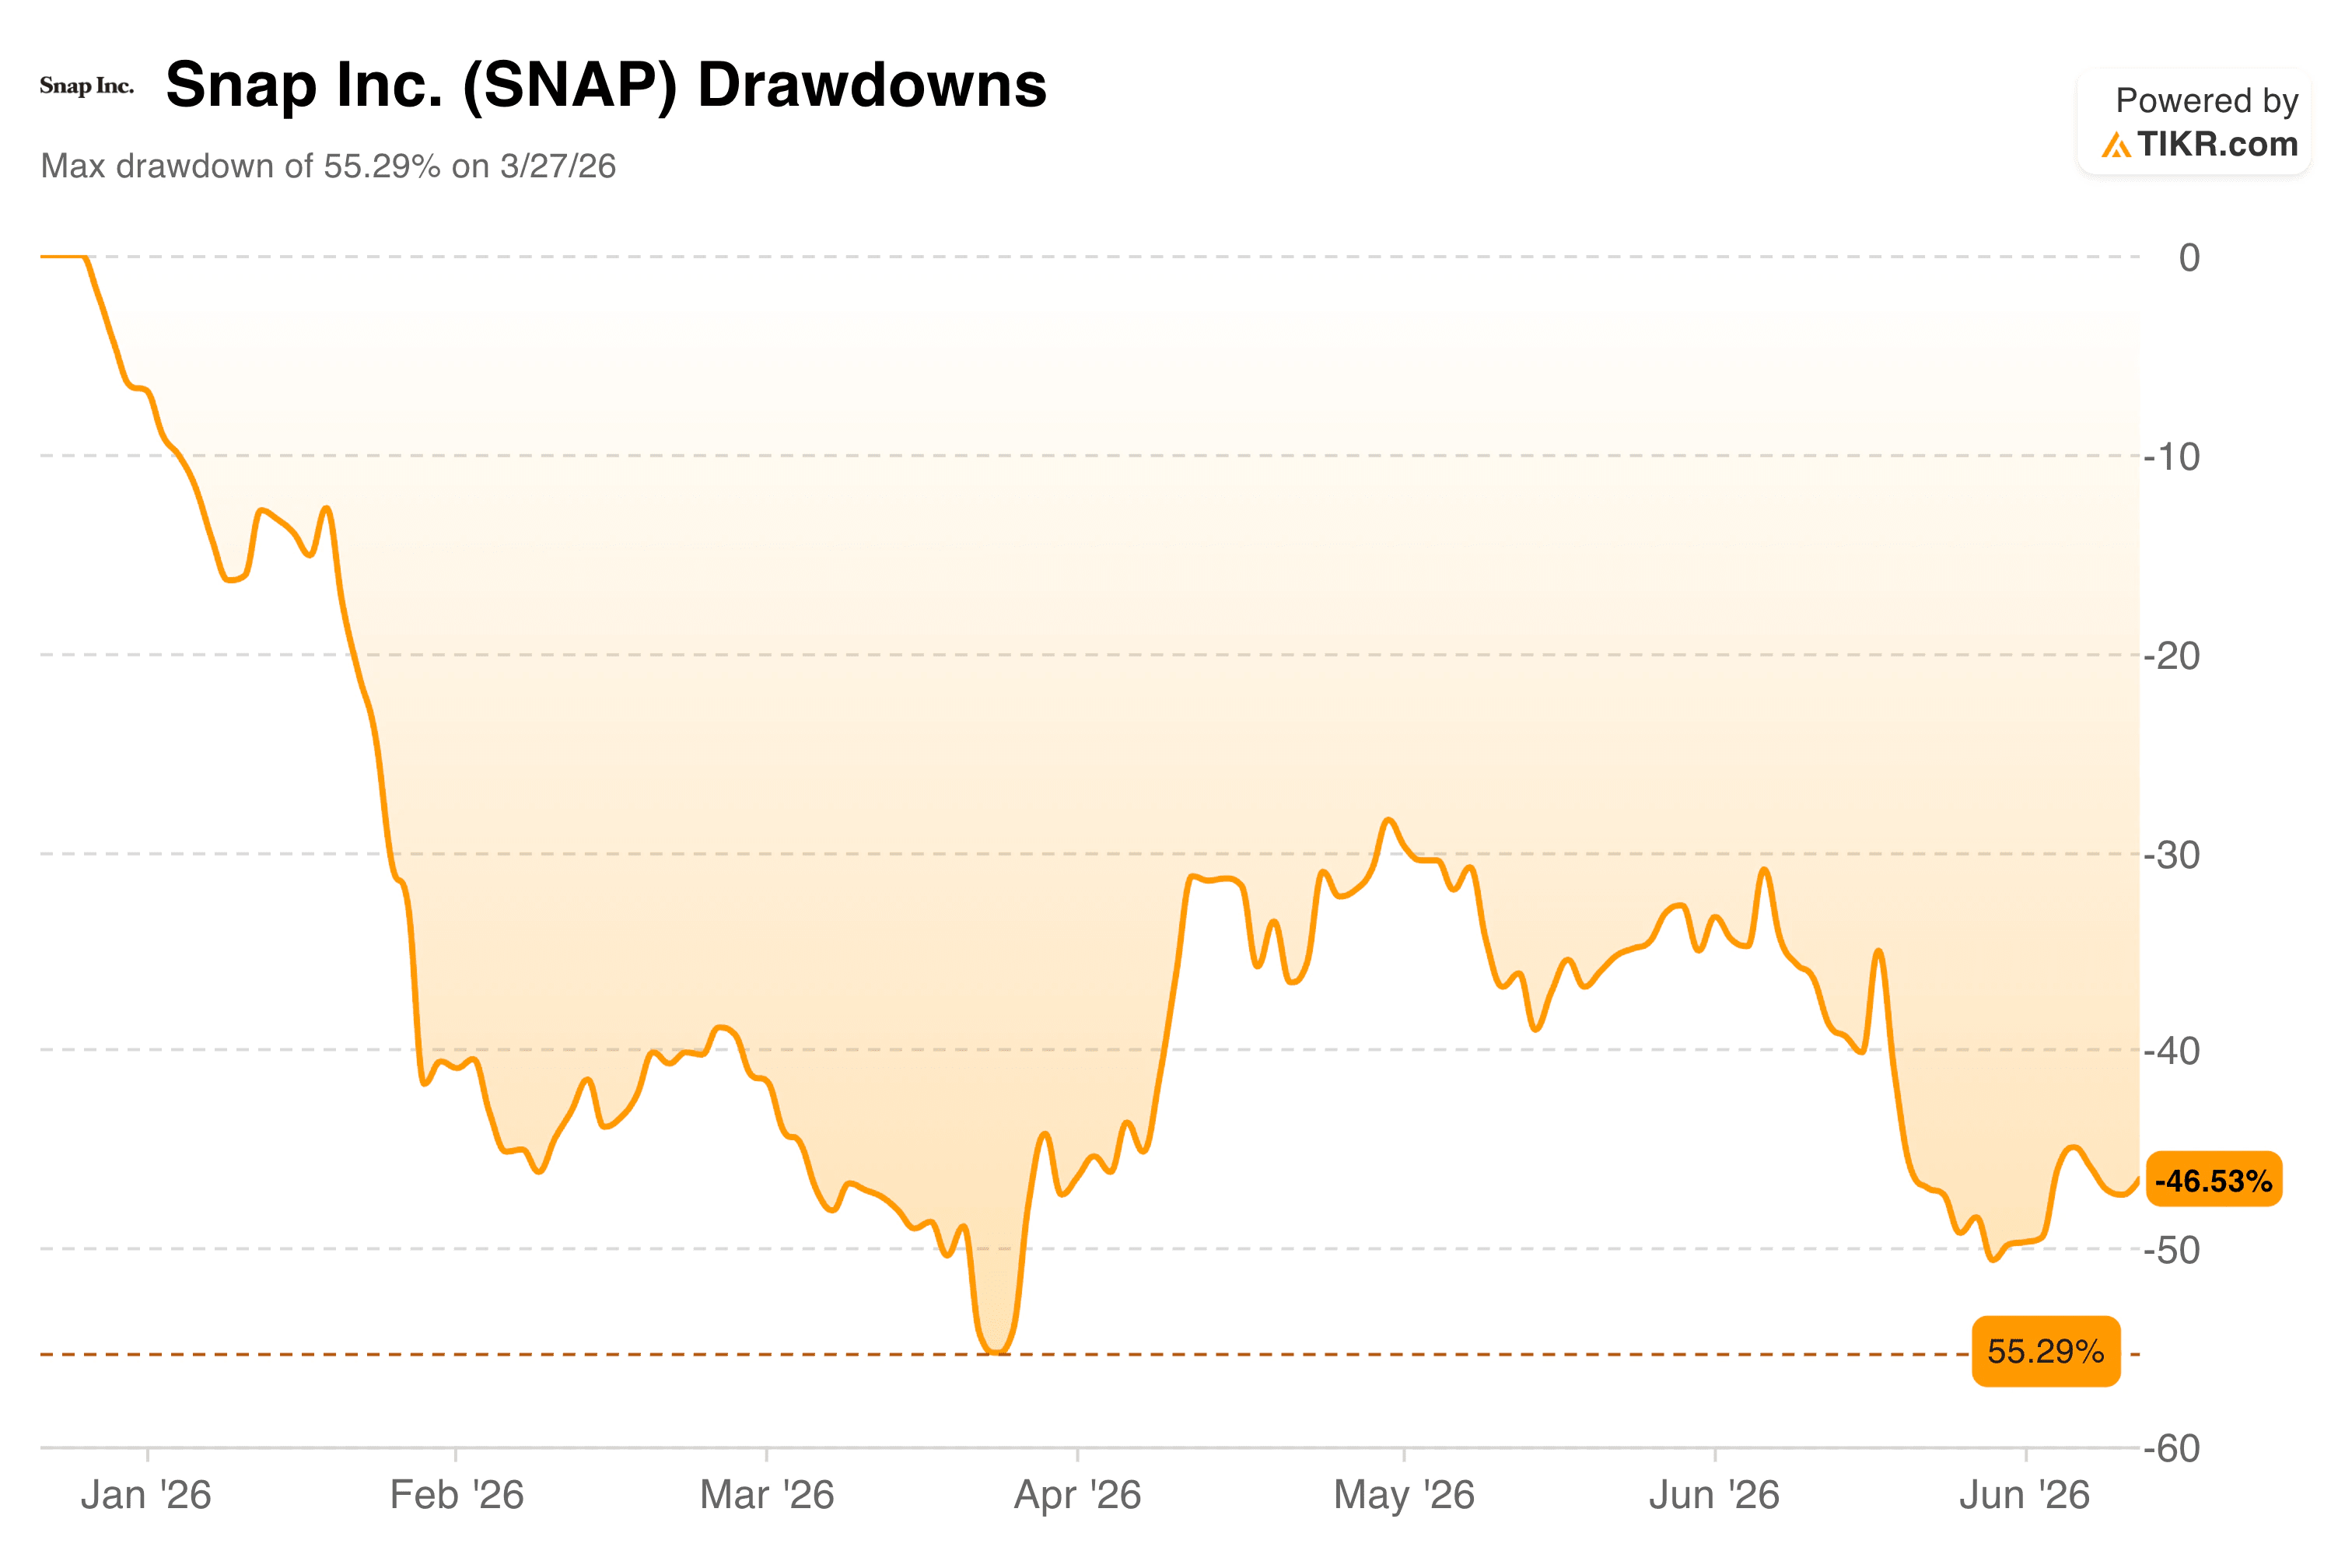
The drawdowns chart shows just how punishing this year has been. Snap hit a maximum drawdown of 55.29% in late March, and while it clawed back to around -30% by mid-May, the recovery quickly lost momentum. As of late June, the stock was down 46.53% from its prior peak, back near the year’s worst levels.
The selling pressure has come from multiple directions: a JPMorgan Underweight call, Goldman Sachs cutting its target from $7 to $6, Wells Fargo lowering its target from $7 to $5, and ongoing regulatory scrutiny around children’s safety on social platforms.
Snap also launched its $2,195 Specs AR glasses in June, a move that split analyst opinion between those who see it as a transformative long-term platform and those who expect minimal near-term revenue contribution from a device priced like a luxury item.
What’s been largely ignored in all of this is that the core advertising business has been improving in ways that weren’t true a year ago.
See analysts’ growth forecasts and price targets for Snap stock (It’s free) >>>
While the Stock Sold Off, Free Cash Flow Nearly Doubled
This is the part of the Snap story that tends to get buried beneath the hardware headlines and the analyst downgrades. The underlying ad engine is generating more cash than it has in years.

The free cash flow chart runs from 2021 through 2025 and shows a business that nearly ran out of road before finding its footing.
FCF was $223M in 2021, collapsed to $55M in 2022, and bottomed out at $35M in 2023 as Snap worked through a painful restructuring and ad market reset. Then it started climbing. FCF recovered to $219M in 2024 and jumped to $437M in full-year 2025, the strongest reading in the company’s public history.
What the chart doesn’t show yet is Q1 2026: Snap generated $286M in free cash flow in a single quarter, already 65% of what the entire year 2025 produced. On a trailing twelve-month basis, free cash flow is now running around $609M.
The driver behind that improvement is a combination of leaner cost structure and a more focused ad product. Snap’s Q1 Adjusted EBITDA more than doubled year over year to $233M, and operating cash flow hit $327M.
CEO Evan Spiegel pointed to growing traction in formats such as Sponsored Snaps and Dynamic Product Ads, with revenue up more than 30% year over year in Q1. S&P Global noticed, too, upgrading Snap’s credit rating to BB- with a positive outlook in June, citing stronger cash flow and more than $500M in targeted annualized cost cuts starting in the second half of 2026.
For a company that the market is pricing like a business in distress, the actual cash dynamics tell a very different story.
Estimate a company’s fair value instantly (Free with TIKR) >>>
What the TIKR Model Says About Where the Stock Could Go
The valuation model builds a reasonable base case for investors thinking two to three years out, and the inputs are worth walking through because they’re neither heroic nor pessimistic.

The mid-case assumes around 8% annual revenue growth, which is roughly in line with what Snap delivered in Q1 and below the company’s own historical pace.
Net margins are expected to expand from deeply negative to around 24% over the forecast period, which may sound dramatic until you remember that Snap already has 56% gross margins and the restructuring work is underway.
Under those assumptions, the model targets around $8.30 per share, implying about 14% annualized returns from the current price over the next four and a half years.
The low case gets you to around $7.50 at about 6% annually, and the high case reaches nearly $14 at around 14%. The historical track record in the table is sobering, with negative total returns across every period shown, which is exactly why the stock is priced where it is. The model is essentially asking whether the future margin expansion can overcome a long history of value destruction.
The piece that changes the answer is Specs. Snap debuted its $2,195 AR glasses in June, positioning them as a standalone spatial computing device rather than a companion product. B. Riley kept a Buy with a $10 target on that news, calling Specs a potentially transformative medium-term catalyst.
Stifel stayed at Hold, expecting limited near-term adoption. Both can be right at the same time: Specs probably won’t move the revenue needle in 2026, but they represent the optionality that the model doesn’t fully price in.
Should You Invest in Snap Inc.?
Snap is a genuinely complicated setup right now. The advertising business has cleaned itself up considerably: cash flow is rising, margins are expanding, and the cost structure is tighter than it’s been in the company’s history.
At the same time, the stock has a poor long-term track record, the debt load is real, and Specs is a big hardware bet in a category that has humbled larger companies than Snap. The model suggests around 14% annualized returns in the mid-case from today’s price, which is a reasonable outcome if the margin expansion story holds.
Whether Specs accelerates or disappoints will likely determine whether investors end up closer to the low case or the high one.
See a stock’s true value in under 60 seconds (Free with TIKR) >>>
Looking for New Opportunities?
- See what stocks billionaire investors are buying so you can follow the smart money.
- Analyze stocks in as little as 5 minutes with TIKR’s all-in-one, easy-to-use platform.
- The more rocks you overturn… the more opportunities you’ll uncover. Search 100K+ global stocks, global top investor holdings, and more with TIKR.
Disclaimer:
Please note that the articles on TIKR are not intended to serve as investment or financial advice from TIKR or our content team, nor are they recommendations to buy or sell any stocks. We create our content based on TIKR Terminal’s investment data and analysts’ estimates. Our analysis might not include recent company news or important updates. TIKR has no position in any stocks mentioned. Thank you for reading, and happy investing!