Key Stats for Occidental Stock
- Current Price: $58.84
- Target Price (Mid): ~$63
- Street Target (Mean): ~$68
- Potential Total Return: ~7%
- Annualized IRR: ~2% / year
Now Live: Discover how much upside your favorite stocks could have using TIKR’s new Valuation Model (It’s free) >>>
What Happened?
Occidental Petroleum (OXY) has a gap that most investors don’t know how to read. Through September, one bank after another lifted its price target. Evercore ISI moved to $70 and kept its Outperform rating, UBS went to $67, Wells Fargo pushed to $82, and Stifel and Seaport initiated at $68 and $73. TIKR’s data puts the Street mean near $68. The stock closed at $58.84 on September 18, below all five.
Crude prices retreated in mid-September as Middle East supply fears eased, and OXY, the most oil-price-sensitive large producer in the U.S., fell 5.42% on September 16 in a sector-wide slide with no company news attached. So the question is whether a stock the Street values near $68, trading at $59, is a gift or a warning. But note what the target hikes hide: the median analyst still rates OXY a Hold, 16 Holds against 10 Buy-or-better and two bearish.
The Bullish Case Rests on a Balance Sheet
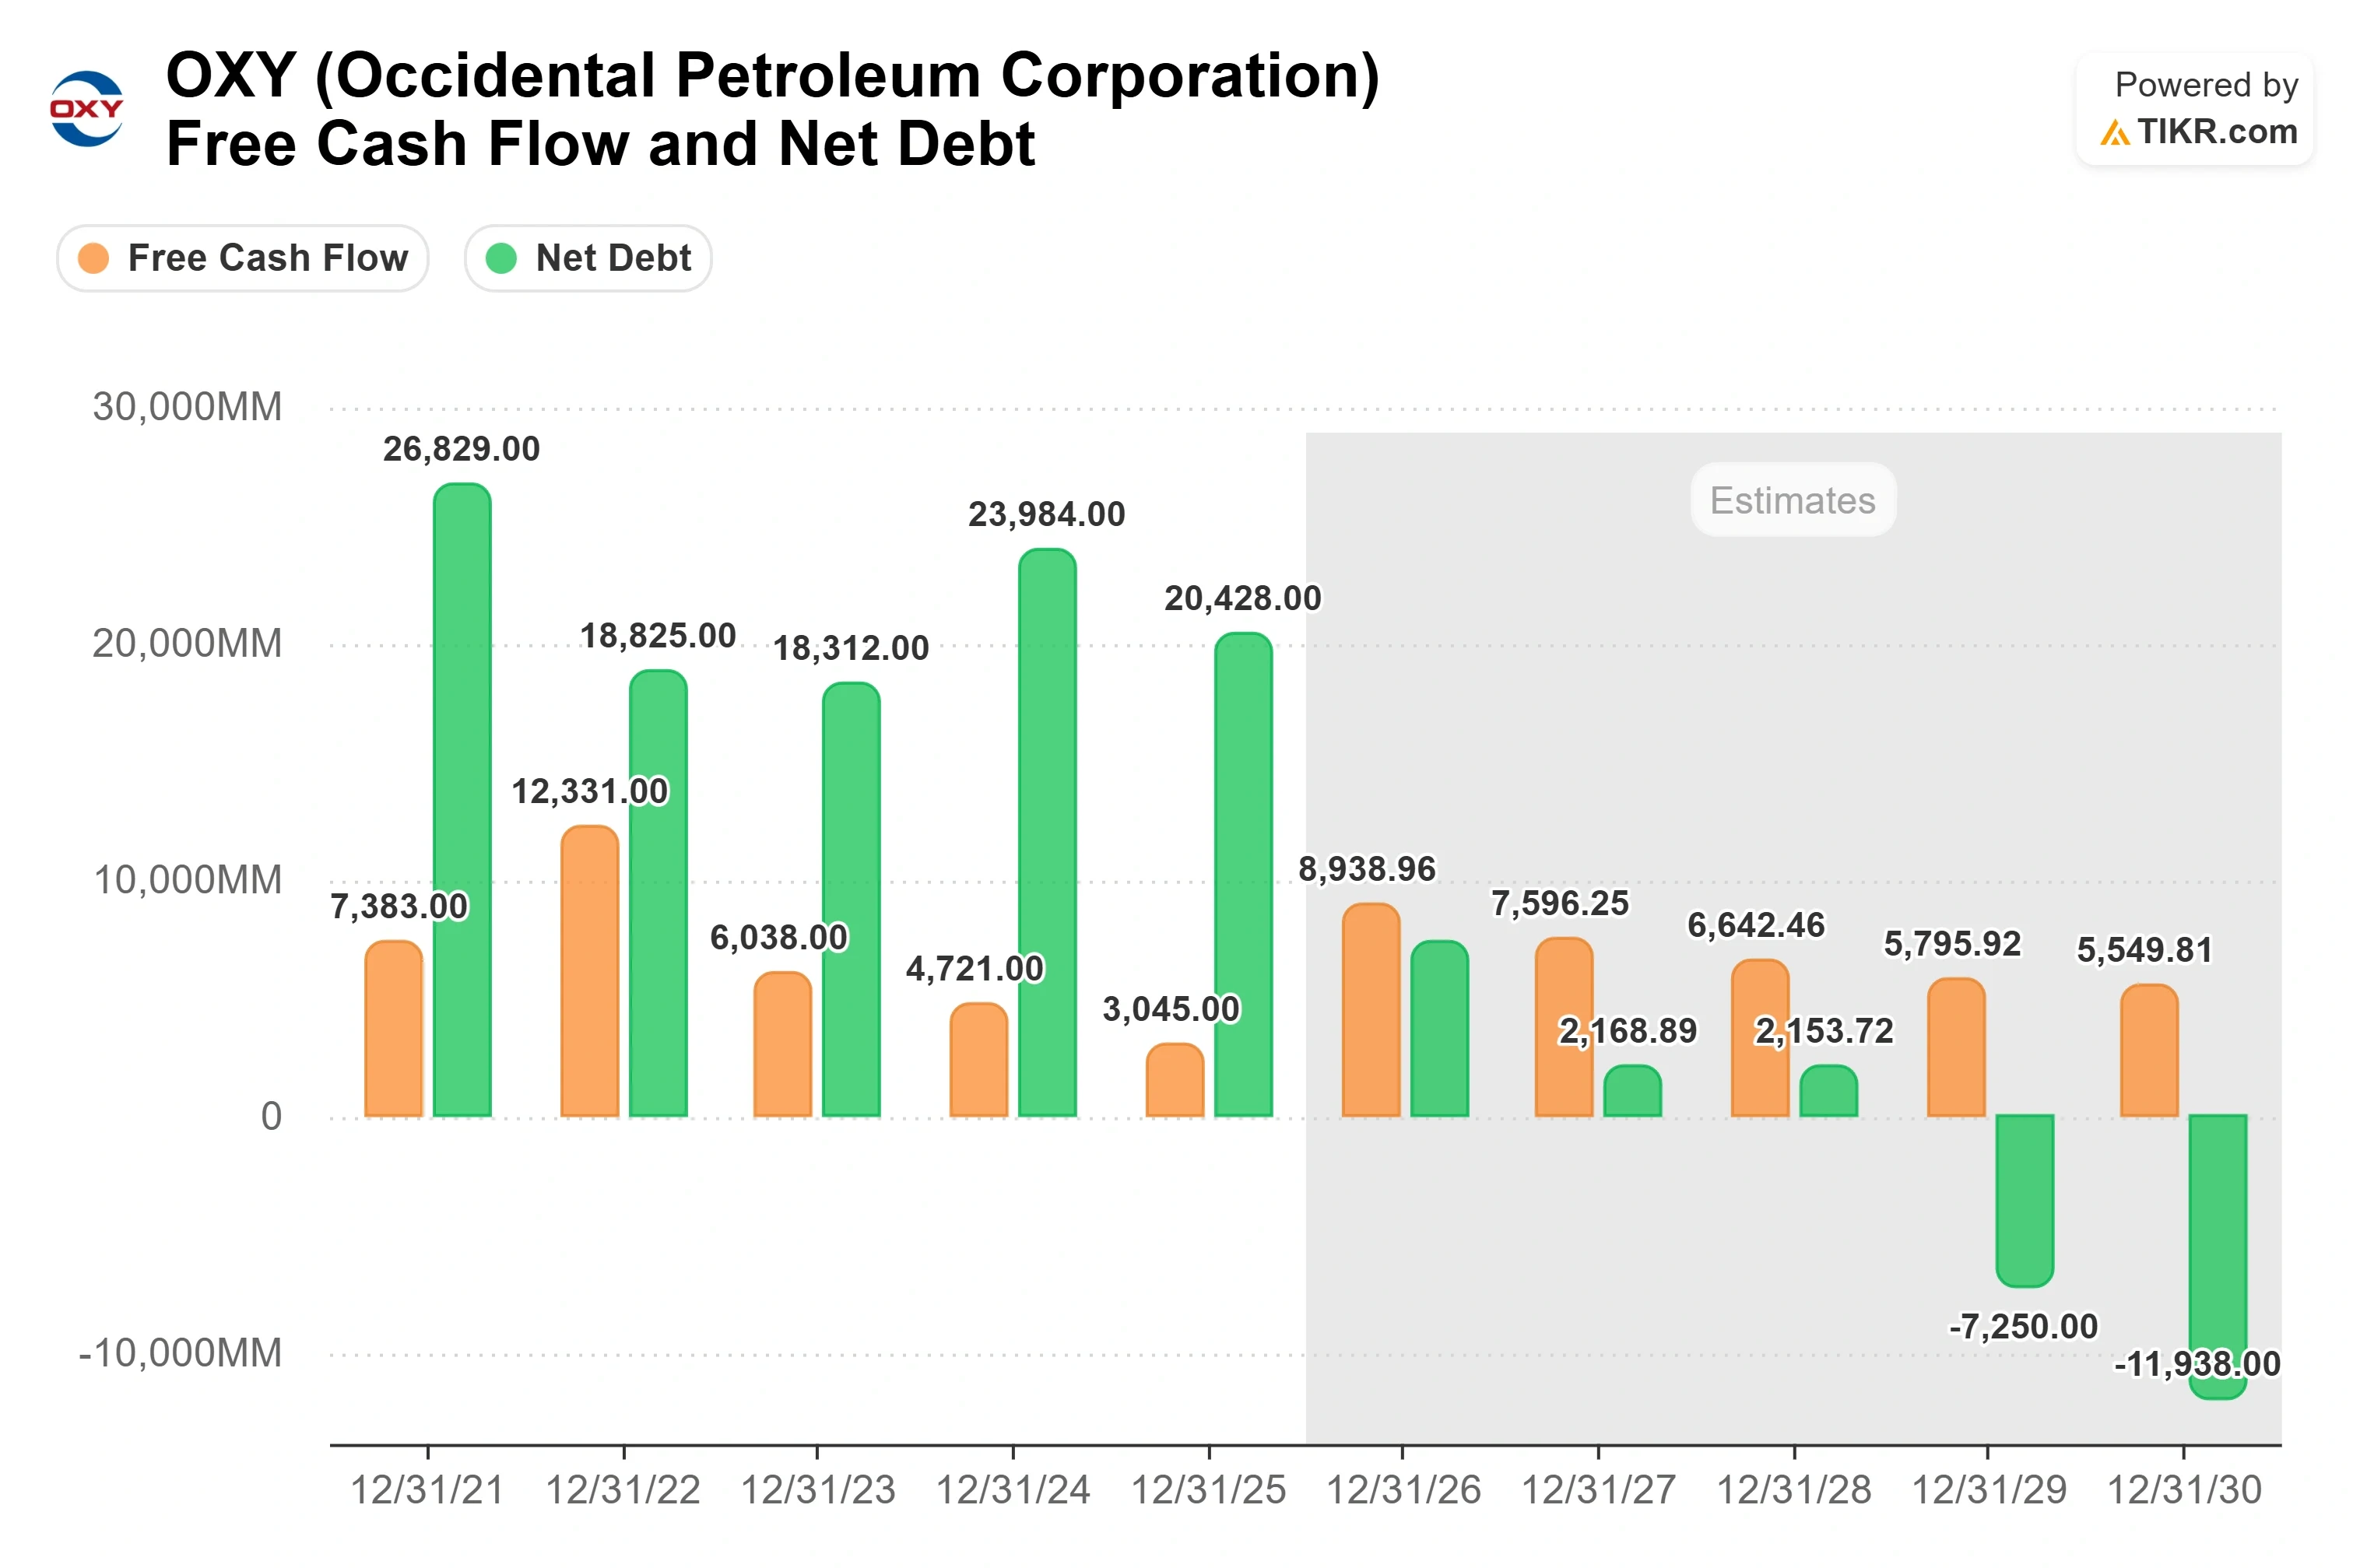
What moved the analysts was Occidental’s shift to a lower-cost, lower-debt business. When Evercore double-upgraded the stock in July, its analyst was explicit that the call did not need faster growth: the firm modeled free cash flow per share compounding near 8% a year through 2030 at a flat $75 WTI price, slower than peers, and still saw the stock as too cheap.
Occidental cut principal debt to $11.8 billion in Q2, its lowest since 2019, and holds net principal debt of $7.6 billion against $4.2 billion of cash. That deleveraging cut its go-forward annual interest run rate by roughly $630 million versus 2025. New CEO Richard Jackson set a milestone on where it leads: more than $4 billion of added annual sustainable cash flow by 2030, and he stressed the plan can “deliver this cash flow without increasing production,” with about 85% of the improvement achievable even at lower prices. The durability comes from operations. Senior Vice President Ken Dillon detailed the waterflood program that lowers field decline rates, citing Oman floods that reduce declines “from 19% to around 7% once complete.”

See historical and forward estimates for Occidental stock (It’s free!) >>>
Why the Stock Keeps Ignoring Them
The problem is that Occidental barely hedges the thing that sets its share price. Management carries only a small costless collar on about 100,000 barrels a day, so when WTI slid in September, the stock went with it. That sensitivity cuts both ways, and it left OXY carrying a max drawdown of 27.63% as of July 1 despite a strengthening business underneath.
OXY trades near 5.1x NTM EV/EBITDA, a slight premium to TotalEnergies at 4.8x and a discount to Suncor at 7.4x. For a pure-play producer carrying more leverage than the integrated majors, sitting mid-pack among peers is about right, not an obvious mispricing. The capital-return clock reinforces the patience required: buybacks stay a low priority until Occidental redeems its preferred equity in 2029, so investors are asked to wait years, collecting a dividend the company raised 8% in August to $0.28 a share while the balance sheet strengthens.
See how Occidental performs against its peers in TIKR (It’s free!) >>>
TIKR Advanced Model Analysis
- Current Price: $58.84
- Target Price (Mid): ~$63
- Potential Total Return: ~7%
- Annualized IRR: ~2% / year

See analysts’ growth forecasts and price targets for Occidental stock (It’s free!) >>>
That is roughly a 7% total return over the horizon, about 2% a year. The model assumes revenue growth near 1% annually, a business holding production flat, with net income margins improving toward 16% as cost and interest savings land. The margin driver is the efficiency program management is selling: lower well costs and a base decline rate falling from roughly 25% toward 20%. The primary risk sits outside the company’s control, in realized oil prices. A sustained stronger crude environment lifts the model well past the mid case, toward the roughly $96 the high scenario implies, while weak prices pressure cash flow and the dividend cushion faster than efficiency gains offset. The model says the Street’s $68 needs oil to cooperate in a way the base case does not assume.
Conclusion
The next real test is the third-quarter print, due in early November. Watch two numbers. Q3 production was guided to 1.4 to 1.44 million BOE per day, so a result at the high end confirms the momentum the upgrades assume. And watch debt reduction toward the $10 billion principal milestone, since every step there moves closer to the 2029 preferred redemption that gates buybacks. If both hold and crude stabilizes, the gap between $59 and $68 looks like an opportunity. If oil rolls over first, the targets come back down, and the Hold-heavy Street will have told you why before the numbers do.
See what stocks billionaire investors are buying so you can follow the smart money with TIKR.
Should You Invest in Occidental?
The only way to really know is to look at the numbers yourself. TIKR gives you free access to the same institutional-quality financial data that professional analysts use to answer exactly that question.
Pull up Occidental, and you’ll see years of historical financials, what Wall Street analysts expect for revenue and earnings in the quarters ahead, how valuation multiples have moved over time, and whether price targets are trending up or down.
You can build a free watchlist to track Occidental alongside every other stock on your radar. No credit card required. Just the data you need to decide for yourself.
Analyze Occidental on TIKR Free →
Looking for New Opportunities?
- See what stocks billionaire investors are buying so you can follow the smart money.
- Analyze stocks in as little as 5 minutes with TIKR’s all-in-one, easy-to-use platform.
- The more rocks you overturn… the more opportunities you’ll uncover. Search 100K+ global stocks, global top investor holdings, and more with TIKR.
Disclaimer:
Please note that the articles on TIKR are not intended to serve as investment or financial advice from TIKR or our content team, nor are they recommendations to buy or sell any stocks. We create our content based on TIKR Terminal’s investment data and analysts’ estimates. Our analysis might not include recent company news or important updates. TIKR has no position in any stocks mentioned. Thank you for reading, and happy investing!