Key Stats for Norwegian Cruise Line Stock
- Current Price: $17.61
- Target Price (Mid): ~$24
- Street Target: ~$21
- Potential Total Return: ~35%
- Annualized IRR: ~7% / year
Now Live: Discover how much upside your favorite stocks could have using TIKR’s new Valuation Model (It’s free) >>>
What Happened?
Norwegian Cruise Line Holdings (NCLH) closed at $17.61 on August 18, down 3.1% on the day, after two Wall Street firms reached opposite conclusions about the same company within hours of each other. Mizuho cut the stock to Neutral from Outperform and dropped its target to $17 from $22. UBS went the other way, lifting its target to $20 from $17 while keeping a Neutral rating. One bank saw a balance sheet heading toward trouble. The other saw a turnaround starting to work, but not enough to turn bullish. A soft, broader tape that day, with oil rising on Middle East tension, added to the pressure.
Norwegian has spent 2026 proving it can cut costs while struggling to prove it can sell cruises. The Q2 report captured the split cleanly: it cleared its own profit targets, yet management cut full-year 2026 net yield guidance to the low end of its range, a decline of around 5%, and trimmed full-year adjusted EBITDA guidance to roughly $2.5 billion. Shares are down roughly 25% over the past year and trade closer to the 52-week low of $14.53 than the high of $27.18.
The Downgrade Is Really About a $1.3 Billion Gap
Mizuho analyst Ben Chaiken did not frame this as a demand call. He framed it as a funding call. His note argues that to keep operating and take delivery of new ships, Norwegian likely needs to draw more than $1 billion on its revolving credit facility over the next 18 months, on top of $2.7 billion in export credit agency debt tied to newbuilds. Stacking those against cash generation, he maps roughly $5.3 billion of sources against $6.6 billion of outflows, a $1.3 billion gap he says could force an equity raise if the recovery builds slowly. This is a brokerage model built on Mizuho’s own assumptions, not a shortfall the company has disclosed or confirmed.
NCLH carries $15.76 billion in net debt against LTM net debt to EBITDA of 5.78x, per TIKR data. Mizuho models that ratio climbing above 7x, and management itself said on the Q2 call it now expects to end 2026 above 6x, up from prior expectations. A company deleveraging from 6x has far less room to absorb a slow recovery than one deleveraging from 4x. The downgrade is a bet that the yield recovery arrives too late to keep leverage from becoming the story.
CFO Mark Kempa pushed back on that read directly. “Reducing net leverage remains a top priority,” he said, pointing to a capital-spending cliff as the mechanism: gross newbuild and growth capital expenditure is set to fall by nearly $1 billion a year as the ship delivery pace slows to one vessel in each of 2028 and 2029. His argument is that free cash flow inflects sharply once spending drops and the cost savings hit full run rate. The bear rebuttal is simple: that relief is a 2028 event, and the funding gap is an 18-month problem.
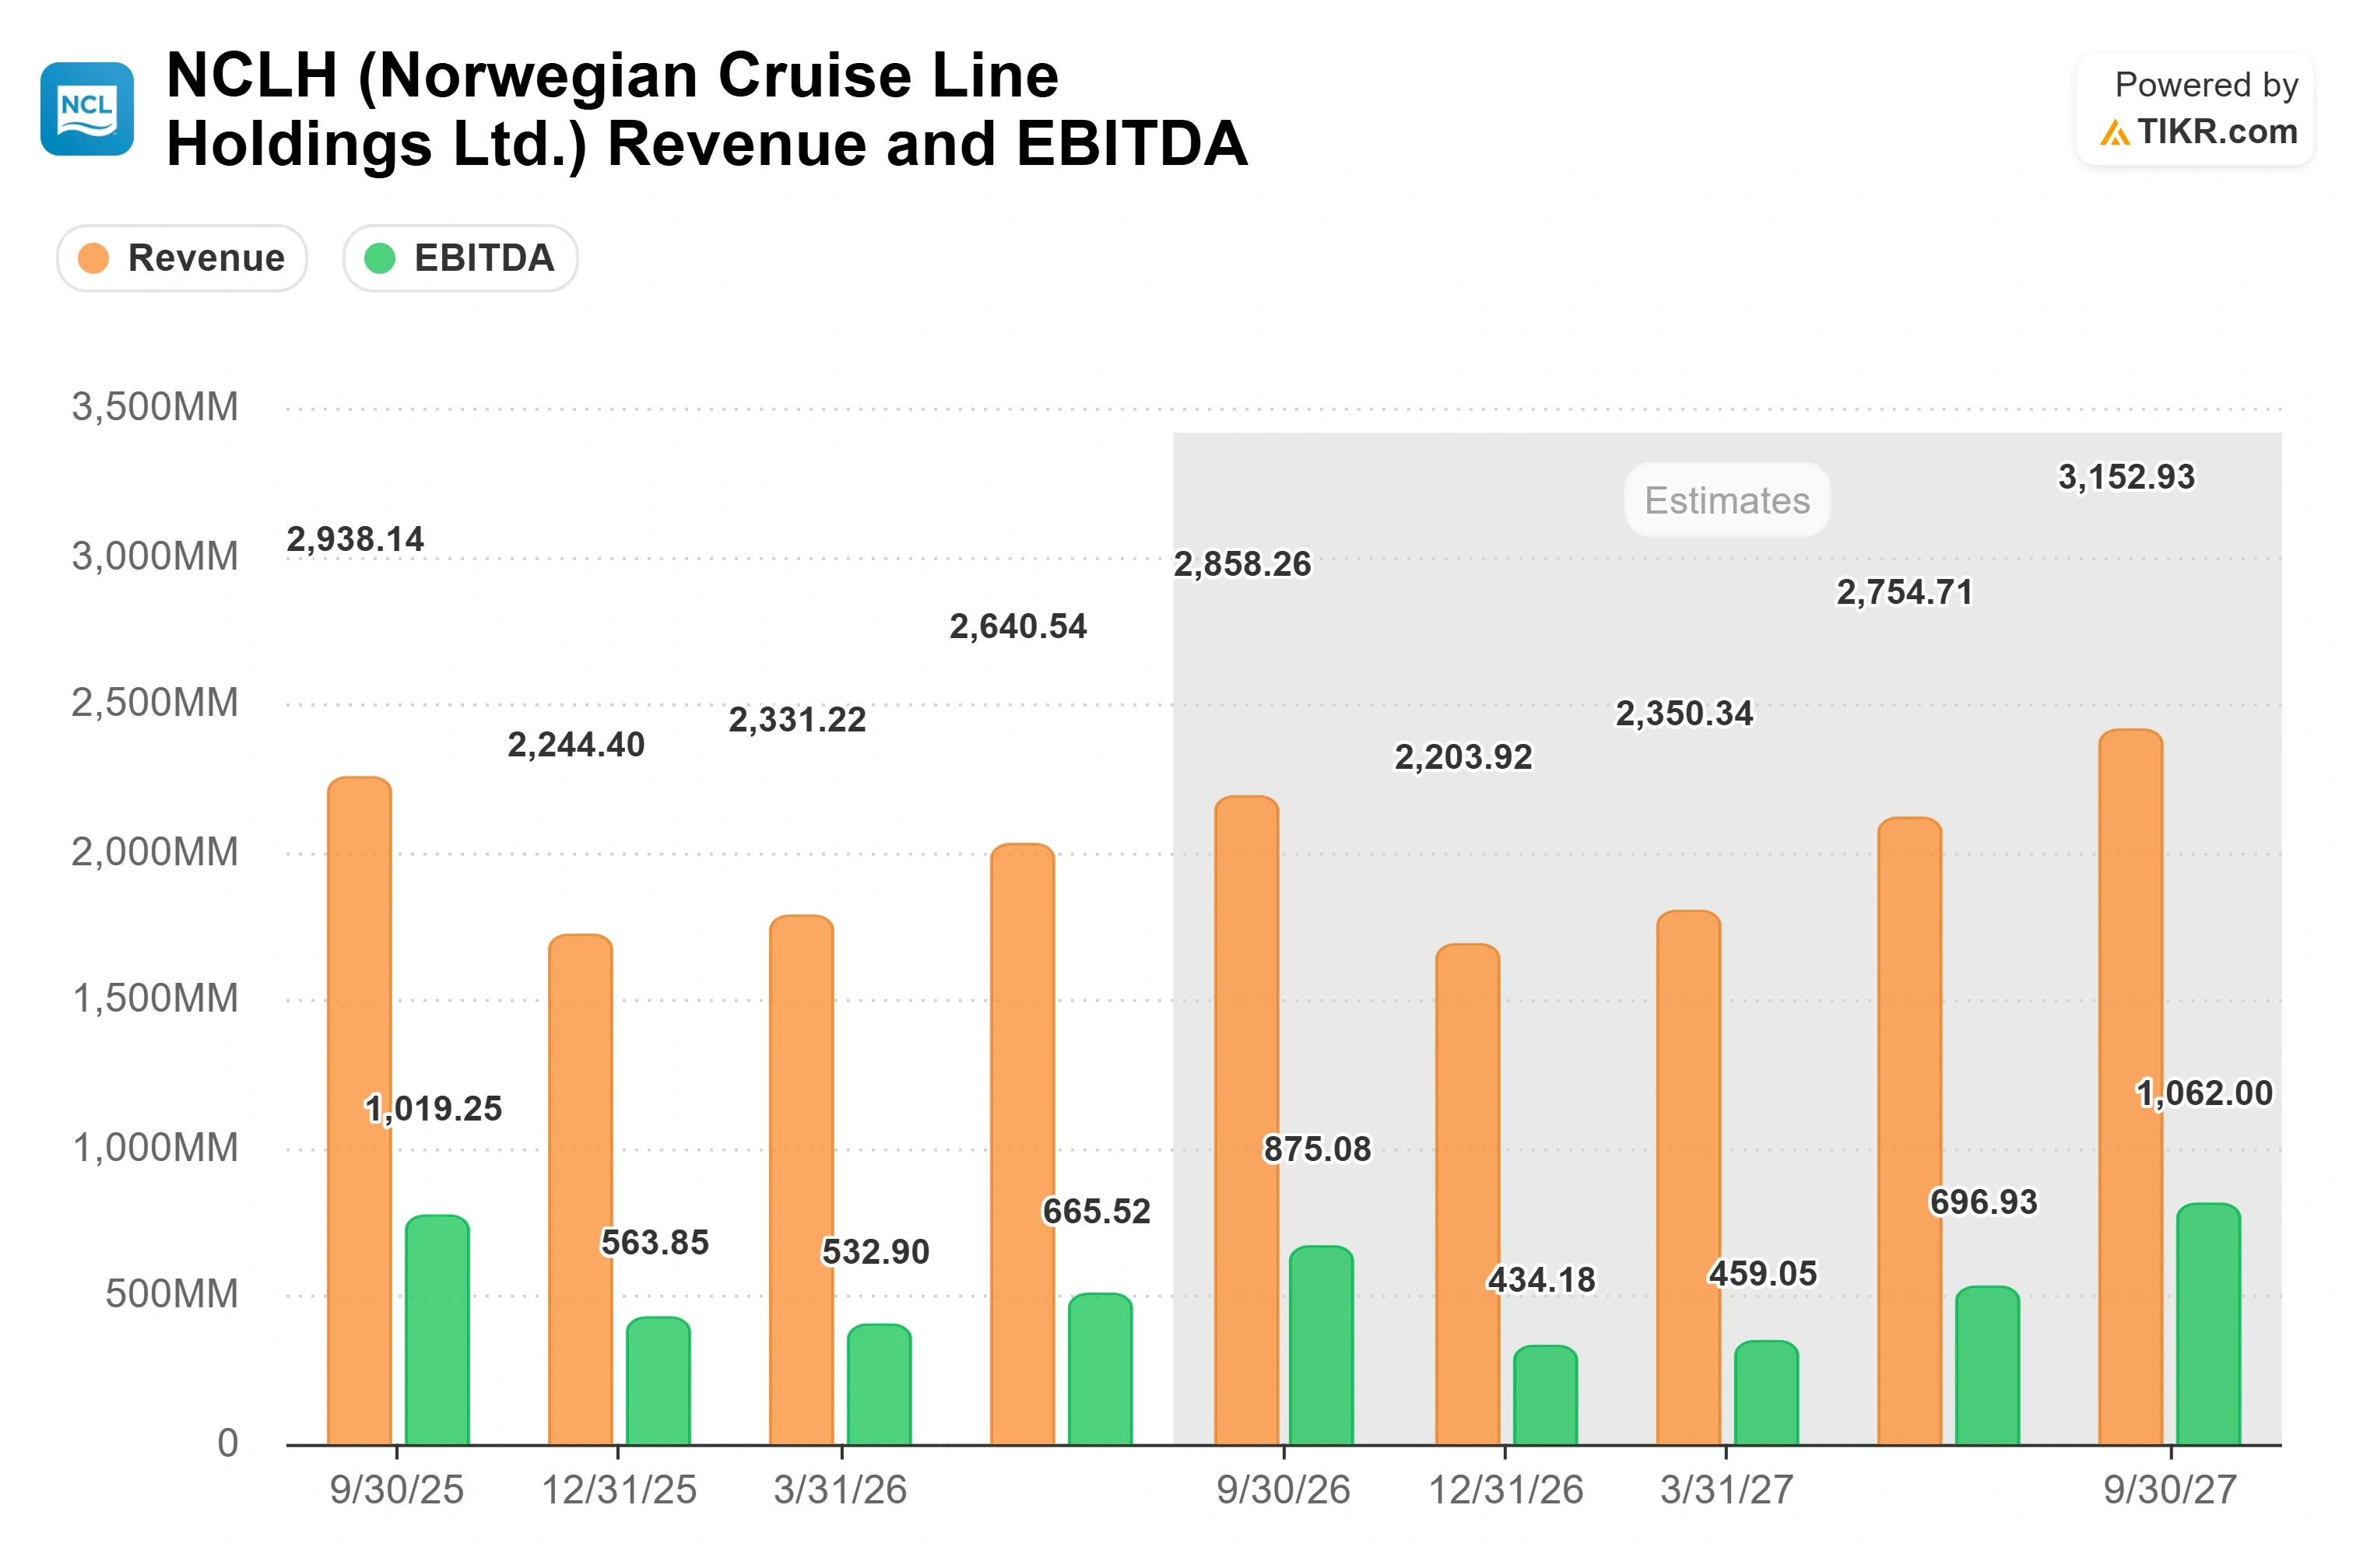
See historical and forward estimates for Norwegian Cruise Line stock (It’s free!) >>>
Why the Other Side Isn’t Buying the Panic
Norwegian beat its own Q2 guidance: adjusted EPS of $0.48 came in $0.10 ahead of the company’s outlook and above the $0.39 the Street expected, while adjusted EBITDA of $666 million cleared guidance by $34 million. Revenue of $2.64 billion landed essentially in line with the Street, a miss of just 0.05%, and net yield fell 2.6%, 100 basis points better than management expected. The demand problem is real, but it lives in the forward guidance, not in a quarter that came apart. This is a company missing on demand and beating on nearly everything it directly controls.
Management identified another $100 million in annualized savings this quarter, bringing the two-quarter total to roughly $225 million, and now expects unit costs (adjusted net cruise cost ex-fuel) to decline about 0.25% for the full year, a third straight year of holding cost growth at 1% or less. CEO John Chidsey was blunt about where the real problem sits, and it is not the product or the cost base. “I really think our issue is all in how we’ve marketed or not marketed,” he said, describing a company that overspent at the bottom of the funnel and underspent on awareness at the top. A marketing problem is fixable with a new team and new creative, which is now in place. A structural demand problem would not be. Insiders appear to share that read, buying a combined $28.2 million in shares over the three months through mid-August with no reported selling, though insider buying signals conviction, not certainty.
Even so, UBS raising its target to $20 is not an endorsement. The firm stayed Neutral, acknowledging progress without betting on it. Against peers, the valuation gap is real: NCLH trades at 9.67x NTM EV/EBITDA versus Royal Caribbean at 12.75x and a peer mean of 15.32x, per TIKR’s Competitors data, with only Carnival cheaper at 8.38x. That discount is not hard to explain: Norwegian carries the heaviest relative leverage and the only broken revenue engine in the group.

See how Norwegian Cruise Line performs against its peers in TIKR (It’s free!) >>>
TIKR Advanced Model Analysis
- Current Price: $17.61
- Target Price (Mid): ~$24
- Potential Total Return: ~35% over the next 4.4 years
- Annualized IRR: ~7% / year

See analysts’ growth forecasts and price targets for Norwegian Cruise Line stock (It’s free!) >>>
Revenue CAGR drivers: a return to positive net yields as the baseloading pricing shift and rebuilt marketing engine take hold in late 2027, plus full-fleet contribution from newbuilds and Great Stirrup Cay’s expanded island revenue (mid-case revenue growth ~6%)
Margin driver: the cost structure, with ~$225 million in annualized savings and the ~$1 billion-a-year capex decline converting to free cash flow as deliveries slow (mid-case net income margin ~8%)
Primary risk: Mizuho’s path, where EBITDA grows only 2% to 3% next year, the $1.3 billion gap forces dilutive equity issuance, and leverage above 7x compresses the multiple before the recovery lands
Upside: yields inflect on schedule, free cash flow funds deleveraging internally, and the gap never becomes a raise.
Downside: the recovery slips, the raise happens, and dilution caps the return. At roughly 7% annualized, the mid-case return is modest for a stock carrying this much balance-sheet risk, which is exactly why the Street mean of around $21 sits so close to today’s price.
Conclusion
The next real test is Q1 2027, which both management and the bears flagged as the low point. Management expects first-half 2027 yields to stay negative, driven mostly by Q1, before improvement builds as the marketing and revenue-management changes reach the booking curve. Watch two numbers when NCLH reports next on November 3: the Q4 net yield print against the guided decline of roughly 6.5%, and any update on the revolver balance or 2027 funding plan. A cleaner-than-feared yield with no signal of a raise validates the UBS read. Confirmation of the funding draw, or a yield miss, hands the argument to Mizuho. Until one lands, the stock stays exactly where the split left it.
See what stocks billionaire investors are buying so you can follow the smart money with TIKR.
Should You Invest in Norwegian Cruise Line?
The only way to really know is to look at the numbers yourself. TIKR gives you free access to the same institutional-quality financial data that professional analysts use to answer exactly that question.
Pull up Norwegian Cruise Line, and you’ll see years of historical financials, what Wall Street analysts expect for revenue and earnings in the quarters ahead, how valuation multiples have moved over time, and whether price targets are trending up or down.
You can build a free watchlist to track Norwegian Cruise Line alongside every other stock on your radar. No credit card required. Just the data you need to decide for yourself.
Analyze Norwegian Cruise Line on TIKR Free →
Looking for New Opportunities?
- See what stocks billionaire investors are buying so you can follow the smart money.
- Analyze stocks in as little as 5 minutes with TIKR’s all-in-one, easy-to-use platform.
- The more rocks you overturn… the more opportunities you’ll uncover. Search 100K+ global stocks, global top investor holdings, and more with TIKR.
Disclaimer:
Please note that the articles on TIKR are not intended to serve as investment or financial advice from TIKR or our content team, nor are they recommendations to buy or sell any stocks. We create our content based on TIKR Terminal’s investment data and analysts’ estimates. Our analysis might not include recent company news or important updates. TIKR has no position in any stocks mentioned. Thank you for reading, and happy investing!