Dividend investing sounds simple in that you just find a stock with a nice yield, buy it, and collect income. In practice, many investors learn the hard way that a high yield can also signal trouble. Dividends get cut. Debt piles up. Payouts grow more slowly than inflation.
The goal is not just to find dividend stocks. The goal is to find dividend stocks that pay you reliably and have a good chance of growing those payments over time. To do that, you need two things. First, clear rules for what “good” looks like. Second, a way to scan thousands of stocks so you are not guessing from a tiny list.
Discover how much upside your favorite stocks could have using TIKR’s new Valuation Model (It’s free) >>>
This is where TIKR’s data helps, as its screener tool lets you filter by dividend yield, dividend growth, payout levels, and other financial metrics. The dividend tiles in TIKR show you the exact numbers behind those payouts, both in history and in analyst estimates. Together, they give you a simple, structured way to find income ideas without spending hours on random lists.
This guide walks through how to use those tools in a beginner-friendly way. The focus is on clarity, not jargon, so you can feel more confident picking dividend stocks for your own portfolio.
Start With What You Want From Dividends
Before you touch a screener, pause and decide what you want your dividends to do. Some investors want higher income right now. Others care more about long-term growth in the payout, even if the current yield is lower.
Ask yourself a few questions.
- Are you looking for current income, dividend growth, or a mix of both?
- What yield range feels reasonable? Many investors focus on stocks between roughly 2% and 6%, high enough to matter but not so high that risk explodes.
- How much volatility are you comfortable with? Utilities and consumer staples often feel steadier. Cyclical sectors can move more.
Once you have a rough picture of your goals, you can build smarter filters in TIKR rather than chasing every high yield that pops up.
A Quick Tour of TIKR’s Dividend Screener

When you open the Global Screener in TIKR, you can set conditions at the top of the page. You choose a field, such as Dividend Per Share or Dividend Yield, then choose how to filter it. For example, you can look for stocks where the Dividend Per Share % Change YoY is greater than a certain number for the next fiscal year. TIKR then shows you how many companies match that rule and lets you add more conditions if you want.
Below the filters, you see summary statistics for the group you found. You can view the average dividend growth, the median, the high and low, and the number of companies that passed your screen. This alone helps you understand the overall tone of the dividend market. Under that, you see a table with each stock, its ticker, name, and the metric you screened for, such as dividend growth for a specific year.
On the Screener page, you see all the dividend-related fields you can use. These include Dividend Yield, Dividend Per Share, Common Dividends Paid, Period Close Dividend Yield Percent, special dividend fields, and even analyst Dividend per Share estimates. TIKR gathers this in one place so you can build highly focused screens for dividend investors, rather than relying on rough lists that ignore growth or safety.
Track the ownership level of each stock with TIKR (It’s free) >>>
Key Dividend Metrics to Know In TIKR
The good news is that you do not need every metric at once, and there is no quiz from anyone to test your knowledge. Instead, start with a few that matter most for dividend investors and get comfortable with them.
Dividend Yield

Dividend yield is the annual dividend per share divided by the stock price. In the Screener, you can filter for stocks with yields above or below a certain level. Yield is helpful, but not enough on its own. A yield that looks too good can reflect a weak business or a soon-to-be-cut payout. Use yield as a starting point, not a final answer.
Dividend Per Share Growth
TIKR lets you screen on the Dividend Per Share % Change YoY for specific years. You can also review the historical dividend per share on the financials side. This shows you whether a company raises its dividend, keeps it flat, or cuts it. A healthy dividend stock often indicates a history of steady increases and positive growth in forward estimates. When you combine current yield with growth, you get a better picture of future income.
Payout Levels And Coverage

The Screener includes fields such as Common Dividends Paid and dividend yield metrics that link to cash flow. To judge safety, you want to know whether the dividend looks supportable by earnings and cash flow. On the Ratios or Cash Flow tabs for a company, you can compare dividends paid to free cash flow and earnings. A payout that consumes almost all cash in normal years leaves little room for shocks. A payout that uses only a portion of the money gives more comfort.
Dividend Stability And Specials
Some companies pay regular dividends plus occasional special dividends. TIKR lets you see these separate fields, such as Special Dividend Per Share and Special Dividend Paid. This helps you avoid mistaking a one-time special payment for a sustainable yield. A strong dividend stock is usually defined by its regular dividend pattern. Specials are a bonus, not the core story.
Forward Dividend Estimates

TIKR also has a Dividend per Share estimate field. This uses analyst expectations for the next year or two. While estimates can change, they give helpful context. If analysts expect dividends to rise, that supports a dividend growth story. If they expect flat or falling payouts, you may want to understand why before you commit.
Cash Flow Statement: Are Profits Backed by Cash?
The Cash Flow Statement tab answers a simple question. Does this company turn its accounting profits into real cash? Many beginners focus only on net income, but a company can report profits while still burning cash due to heavy investments, rising receivables, or other working capital needs.
Look first at cash from operations. In TIKR, this line appears near the top of the cash flow table. A healthy company tends to show positive cash from operations in most years, ideally trending upward over time. If cash from operations is negative again and again, the business may be struggling to support itself.
Next, look at capital expenditures, often labeled as capital expenditure or purchase of property, plant, and equipment. This is the money the company spends to maintain or grow its asset base. When you subtract capital expenditures from cash from operations, you get a rough idea of free cash flow. TIKR often shows a free cash flow line in the supplementary data section, which makes this even easier. Positive and rising free cash flow over time is one of the strongest signs of financial health.
Further down the cash flow statement, you can see whether the company is paying down debt, issuing new debt, buying back shares, or paying dividends. A business that consistently needs to borrow or issue shares to stay afloat looks weaker than one that can fund itself from its own operations.
Review dividend data for thousands of stocks in less than 60 seconds with TIKR (It’s free) >>>
Building a Simple Dividend Screen In TIKR
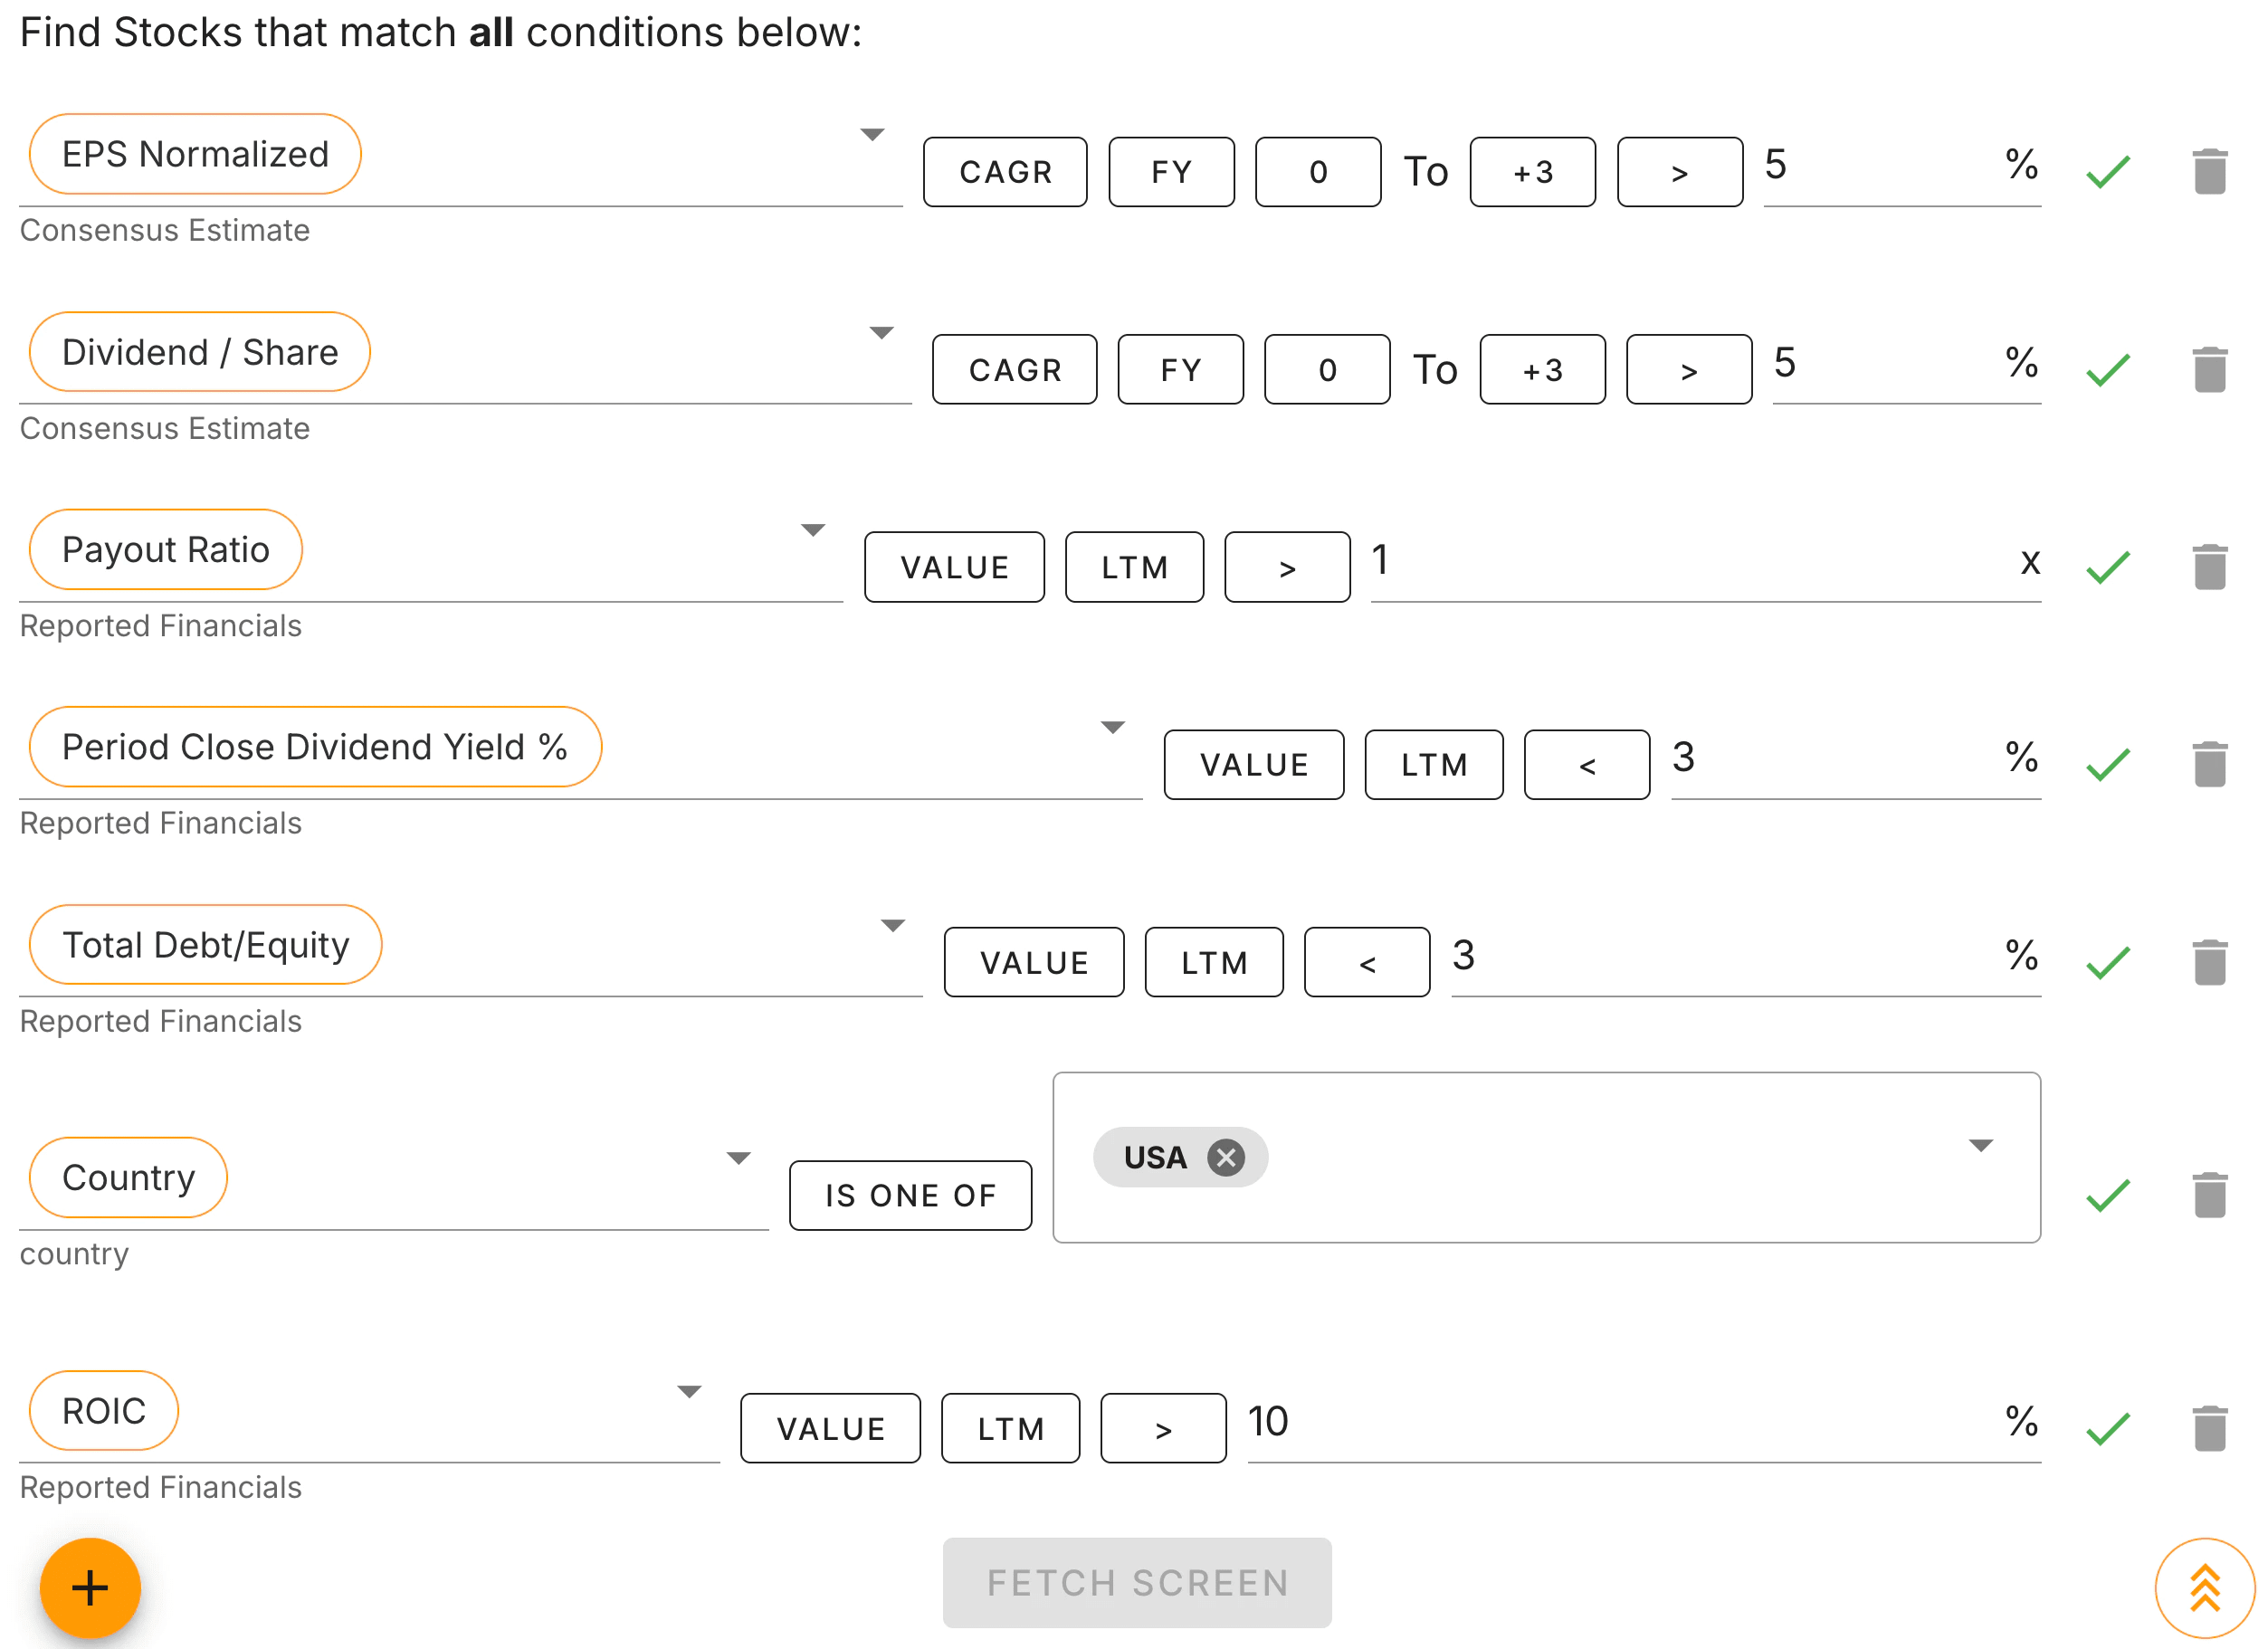
Once you know which factors matter most, you can build a focused dividend screen in TIKR to surface stronger candidates faster. The example above uses fields from the screenshots and keeps the process tight and practical.
Start with growth. Add EPS Normalized CAGR and Dividend Per Share CAGR, and set each to greater than 5% over the next three fiscal years. This forces the list to include companies that are steadily growing both earnings and dividends.
Then add quality checks. Set the payout ratio to greater than 1 to avoid companies with unsustainably low distributions. Add a rule for Period Close Dividend Yield less than 3% to filter out yield traps and keep the list centered on companies with balanced income and growth.
Next, add balance sheet strength. Set Total Debt to Equity to less than 3%. This screens out highly leveraged businesses and keeps the focus on companies with healthier capital structures.
Finally, narrow by region and returns. Select the United States under Country. Add ROIC with a minimum of 10% to make sure only companies with strong profitability remain.
After running the screen, TIKR gives you a clean list of results with EPS growth, dividend growth, payout ratios, yields, leverage, and ROIC all visible in one place. You can sort by any column and quickly move from a long list to a focused set of dividend names worth deeper research.
Using Dividend Data to Shortlist Your Favorite Stocks

The Screener gives you a pool of candidates, but you still need to choose the best ones for your portfolio. This is where you click into individual tickers and connect dividend data to basic financial health metrics.
For each stock that looks interesting, open it in TIKR and visit the Financials tab. Check that revenue is stable or rising, margins are positive, and cash from operations is healthy. Confirm that dividends are supported by free cash flow and not by constant borrowing. Look at the payout ratio in the Ratios tab to see how much profit is paid out as dividends. A moderate payout, backed by cash, usually feels safer than an aggressive payout that leaves no cushion.
Then return to the dividend data. Study the history of dividend per share, not just the last year. A pattern of steady increases over many years is usually more important than a single year with a large jump. Glance at the Dividend per Share estimates to see whether growth appears likely to continue. If both history and estimates point in the same direction, that is a good sign.
A Simple Checklist for Dividend Screens
To keep this process from feeling overwhelming, use a short checklist every time you run a screen and review a stock.
- Yield in a reasonable range, not at extreme highs.
- Dividend per share growing, or at least not shrinking, over several years.
- Positive dividend growth expected in the near term.
- Dividends covered by free cash flow and earnings with room to spare.
- Underlying business with stable or improving revenue and margins.
If a stock passes most of these points, it often deserves a closer look as a dividend candidate.
Track your favorite stocks’ dividend history on TIKR (It’s free) >>>
TIKR Takeaway
Finding good dividend stocks is not about chasing the highest yield on a list. It is about filtering for income, growth, and safety simultaneously. TIKR’s Screener and dividend data give you that structure.
You can search across the global market using clear rules, then drill into each company’s dividend history, forward estimates, and financial strength without leaving the platform.
For dividend-focused investors, that combination saves time and cuts out guesswork. You move from random lists to a repeatable process that you can run whenever you want fresh ideas. Over time, that kind of routine is what helps build a more reliable dividend portfolio.
Value Any Stock in Under 60 Seconds with TIKR
With TIKR’s new Valuation Model tool, you can estimate a stock’s potential share price in under a minute.
All it takes is three simple inputs:
- Revenue Growth
- Operating Margins
- Exit P/E Multiple
If you’re not sure what to enter, TIKR automatically fills in each input using analysts’ consensus estimates, giving you a quick, reliable starting point.
From there, TIKR calculates the potential share price and total returns under Bull, Base, and Bear scenarios so you can quickly see whether a stock looks undervalued or overvalued.
See a stock’s true value in under 60 seconds (Free with TIKR) >>>
Looking for New Opportunities?
- Discover which stocks billionaire investors are purchasing, so you can follow the smart money.
- Analyze stocks in as little as 5 minutes with TIKR’s all-in-one, easy-to-use platform.
- The more rocks you overturn… the more opportunities you’ll uncover. Search 100K+ global stocks, global top investor holdings, and more with TIKR.
Disclaimer:
Please note that the articles on TIKR are not intended to serve as investment or financial advice from TIKR or our content team, nor are they recommendations to buy or sell any stocks. We create our content based on TIKR Terminal’s investment data and analysts’ estimates. Our analysis might not include recent company news or important updates. TIKR has no position in any stocks mentioned. Thank you for reading, and happy investing!