


Key Takeaways
- Home Depot grew Q2 sales 5.7% to $47.9 billion, with comparable sales up 1.7% and adjusted EPS of $4.92.
- Average ticket rose 2.8% while customer transactions fell 1.0%, as shoppers kept spending on “smaller projects.”
- Excluding $1.4 billion from GMS, sales growth was closer to 2.6%, and guidance calls for flat to 4.0% EPS growth.
- Q3 results in November will show whether transactions stabilize and whether pro and large project demand improves.
Home Depot (HD) keeps finding ways to grow in a housing market that refuses to move.
Q2 sales beat expectations, adjusted EPS rose 5.1%, and management reaffirmed its full-year outlook. Yet the stock closed at $320 on October 23, down 2.4% on the day and 14.6% over the past year.
One line in the report explains the disconnect. Customers are spending more per trip and making fewer trips.
That works for a few quarters. It gets harder to sustain while housing turnover stays near historic lows and homeowners keep pushing out big remodels.
Bigger baskets, fewer visits
Q2 sales rose 5.7% to $47.9 billion, ahead of the roughly $47.3 billion consensus. Comparable sales grew 1.7%, and U.S. comps rose 1.3%.
The mix is what matters:
- Comparable average ticket rose 2.8%.
- Comparable customer transactions fell 1.0%.
- Online comps rose 11%, the fifth straight quarter of double-digit growth.
CFO Richard McPhail said customers “continued to engage in smaller projects.” Thirteen of 16 merchandising departments posted positive comps.
Net earnings came to $4.8 billion, or $4.79 per share, while adjusted EPS reached $4.92 against $4.68 a year earlier.
Here’s the quarterly revenue picture…

Growth has held up, though part of it was acquired.
How much growth is bought
Home Depot bought GMS, a specialty building products distributor, in September 2025. GMS added $1.4 billion of sales in Q2, so organic growth was closer to 2.6%.
That is still respectable. It also shows where Home Depot sees its future, because GMS and SRS, which runs more than 1,340 locations, push the company deeper into the professional contractor market.
Pros tend to spend on repair and maintenance work that cannot wait. So the business gets steadier when homeowners delay discretionary projects, although distribution sales carry thinner margins than store sales.
Q2 gross margin still rose about 25 basis points to 33.7%. McPhail also flagged that the timing of tariff refunds could shift some margin between Q2 and Q3.
Lowe’s (LOW) has leaned harder on DIY shoppers, which makes the two strategies easier to compare. How do they stack up on operating margin?
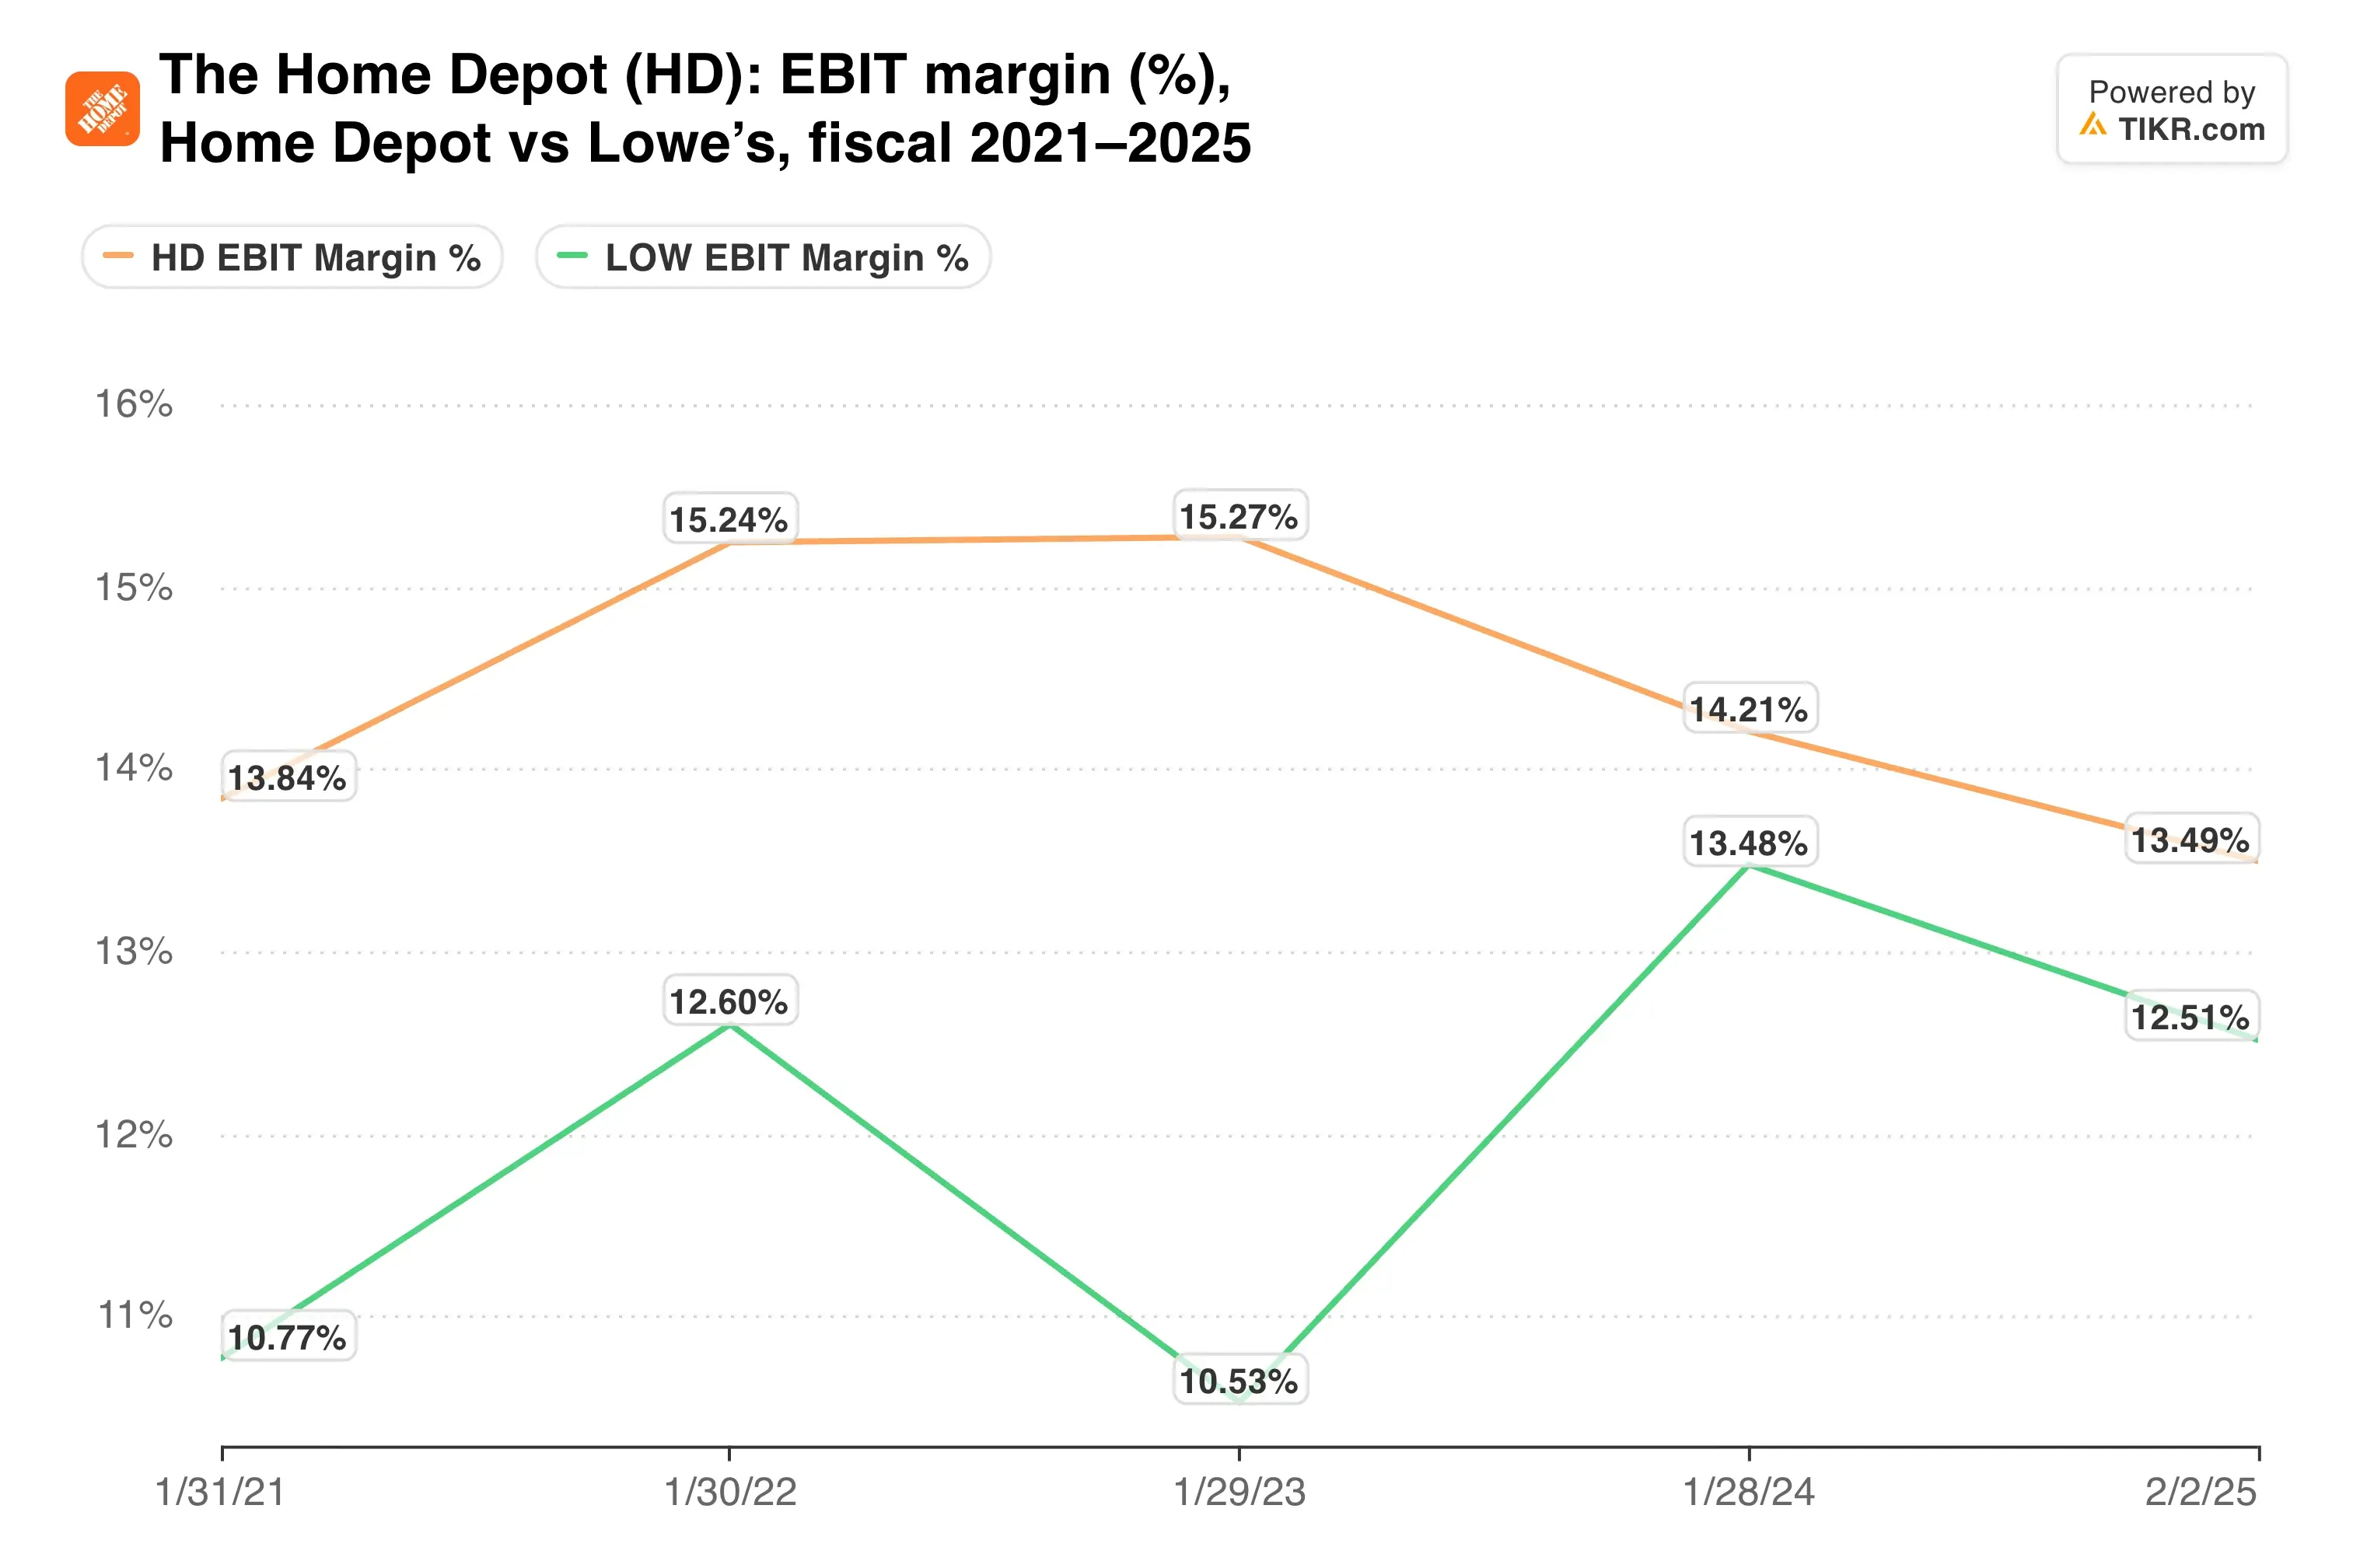
Margin is the metric to watch here, since Home Depot’s LTM EBIT margin of 12.0% now absorbs a growing share of distribution revenue.
TIKR tracks 36 analysts on Home Depot. How many say “Buy”?
See the full breakdown of Buy, Hold, and Sell ratings on Home Depot, along with Wall Street’s revenue and earnings estimates, all in one place. More than 500,000 investors use TIKR to research stocks like this one. See Home Depot’s Analyst Ratings
Paying 21x for 4% growth
Guidance leaves little room for upside. Home Depot expects 2.5% to 4.5% sales growth, comps of flat to 2.0% and adjusted EPS growth of flat to 4.0% from $14.69. The adjusted operating margin target is 12.8% to 13.0%.
That earnings path is slow for a stock at 20.8x NTM earnings. Analysts expect EPS to grow about 4.3% a year over the next two years, after it fell about 4.2% a year over the last three.
Investors used to pay more for Home Depot:

The multiple has already compressed, which is why the Street target of $380 sits about 19% above today’s price.
My take: Home Depot is executing well in a bad market, and the 3.0% dividend yield pays investors to wait. Still, I see little reason for a re-rating until transactions turn positive. A housing thaw would change that quickly, though nobody can time it.
The November Q3 report is the next checkpoint. Transactions are the number to watch, followed by any sign that large project demand is finally coming back.
So what is Home Depot stock actually worth?
TIKR lets you forecast the future price of any stock in less than a minute. Just enter a few assumptions into TIKR’s valuation model and see what Home Depot could be worth. Start from Wall Street consensus estimates, or adjust the inputs to reflect your own view of the business. It’s free to use.
Disclaimer:
Please note that the articles on TIKR are not intended to serve as investment or financial advice from TIKR or our content team, nor are they recommendations to buy or sell any stocks. We create our content based on TIKR Terminal’s investment data and analysts’ estimates. Our analysis might not include recent company news or important updates. TIKR has no position in any stocks mentioned. Thank you for reading, and happy investing!


