
Key Takeaways
- Disney reports before the open on Nov. 17, after a 29% climb from its late-March low on CEO Josh D’Amaro’s cost cuts.
- The cuts need to show up in the margin and in a fiscal 2027 outlook that at least holds double-digit growth.
- Peers point to strong cruise bookings, a soft patch at theme parks and slower streaming ad growth.
- At about 16x forward earnings, Disney can clear the bar if the outlook carries a savings figure.
Disney (DIS) reports its fiscal fourth quarter before the open on Nov. 17, Josh D’Amaro’s first full-year report since he became CEO on March 18. The stock has climbed 29% from its late-March low on his efficiency drive, and on Nov. 2 Bloomberg reported that Disney is weighing thousands more job cuts, with some managers asked to find 20% in annual savings. Disney declined to comment.
Three peers already reported. Netflix (NFLX) built the cost of its own headcount cuts into its guidance, Comcast (CMCSA) flagged a soft patch at its theme parks, and Royal Caribbean (RCL) says 2027 cruise bookings are running ahead of the usual pace.
Disney’s Fiscal 2027 Bar Is Higher Than It Looks
Analysts expect normalized EPS of $6.93 for fiscal 2026 and $7.49 for fiscal 2027, about 8% higher.
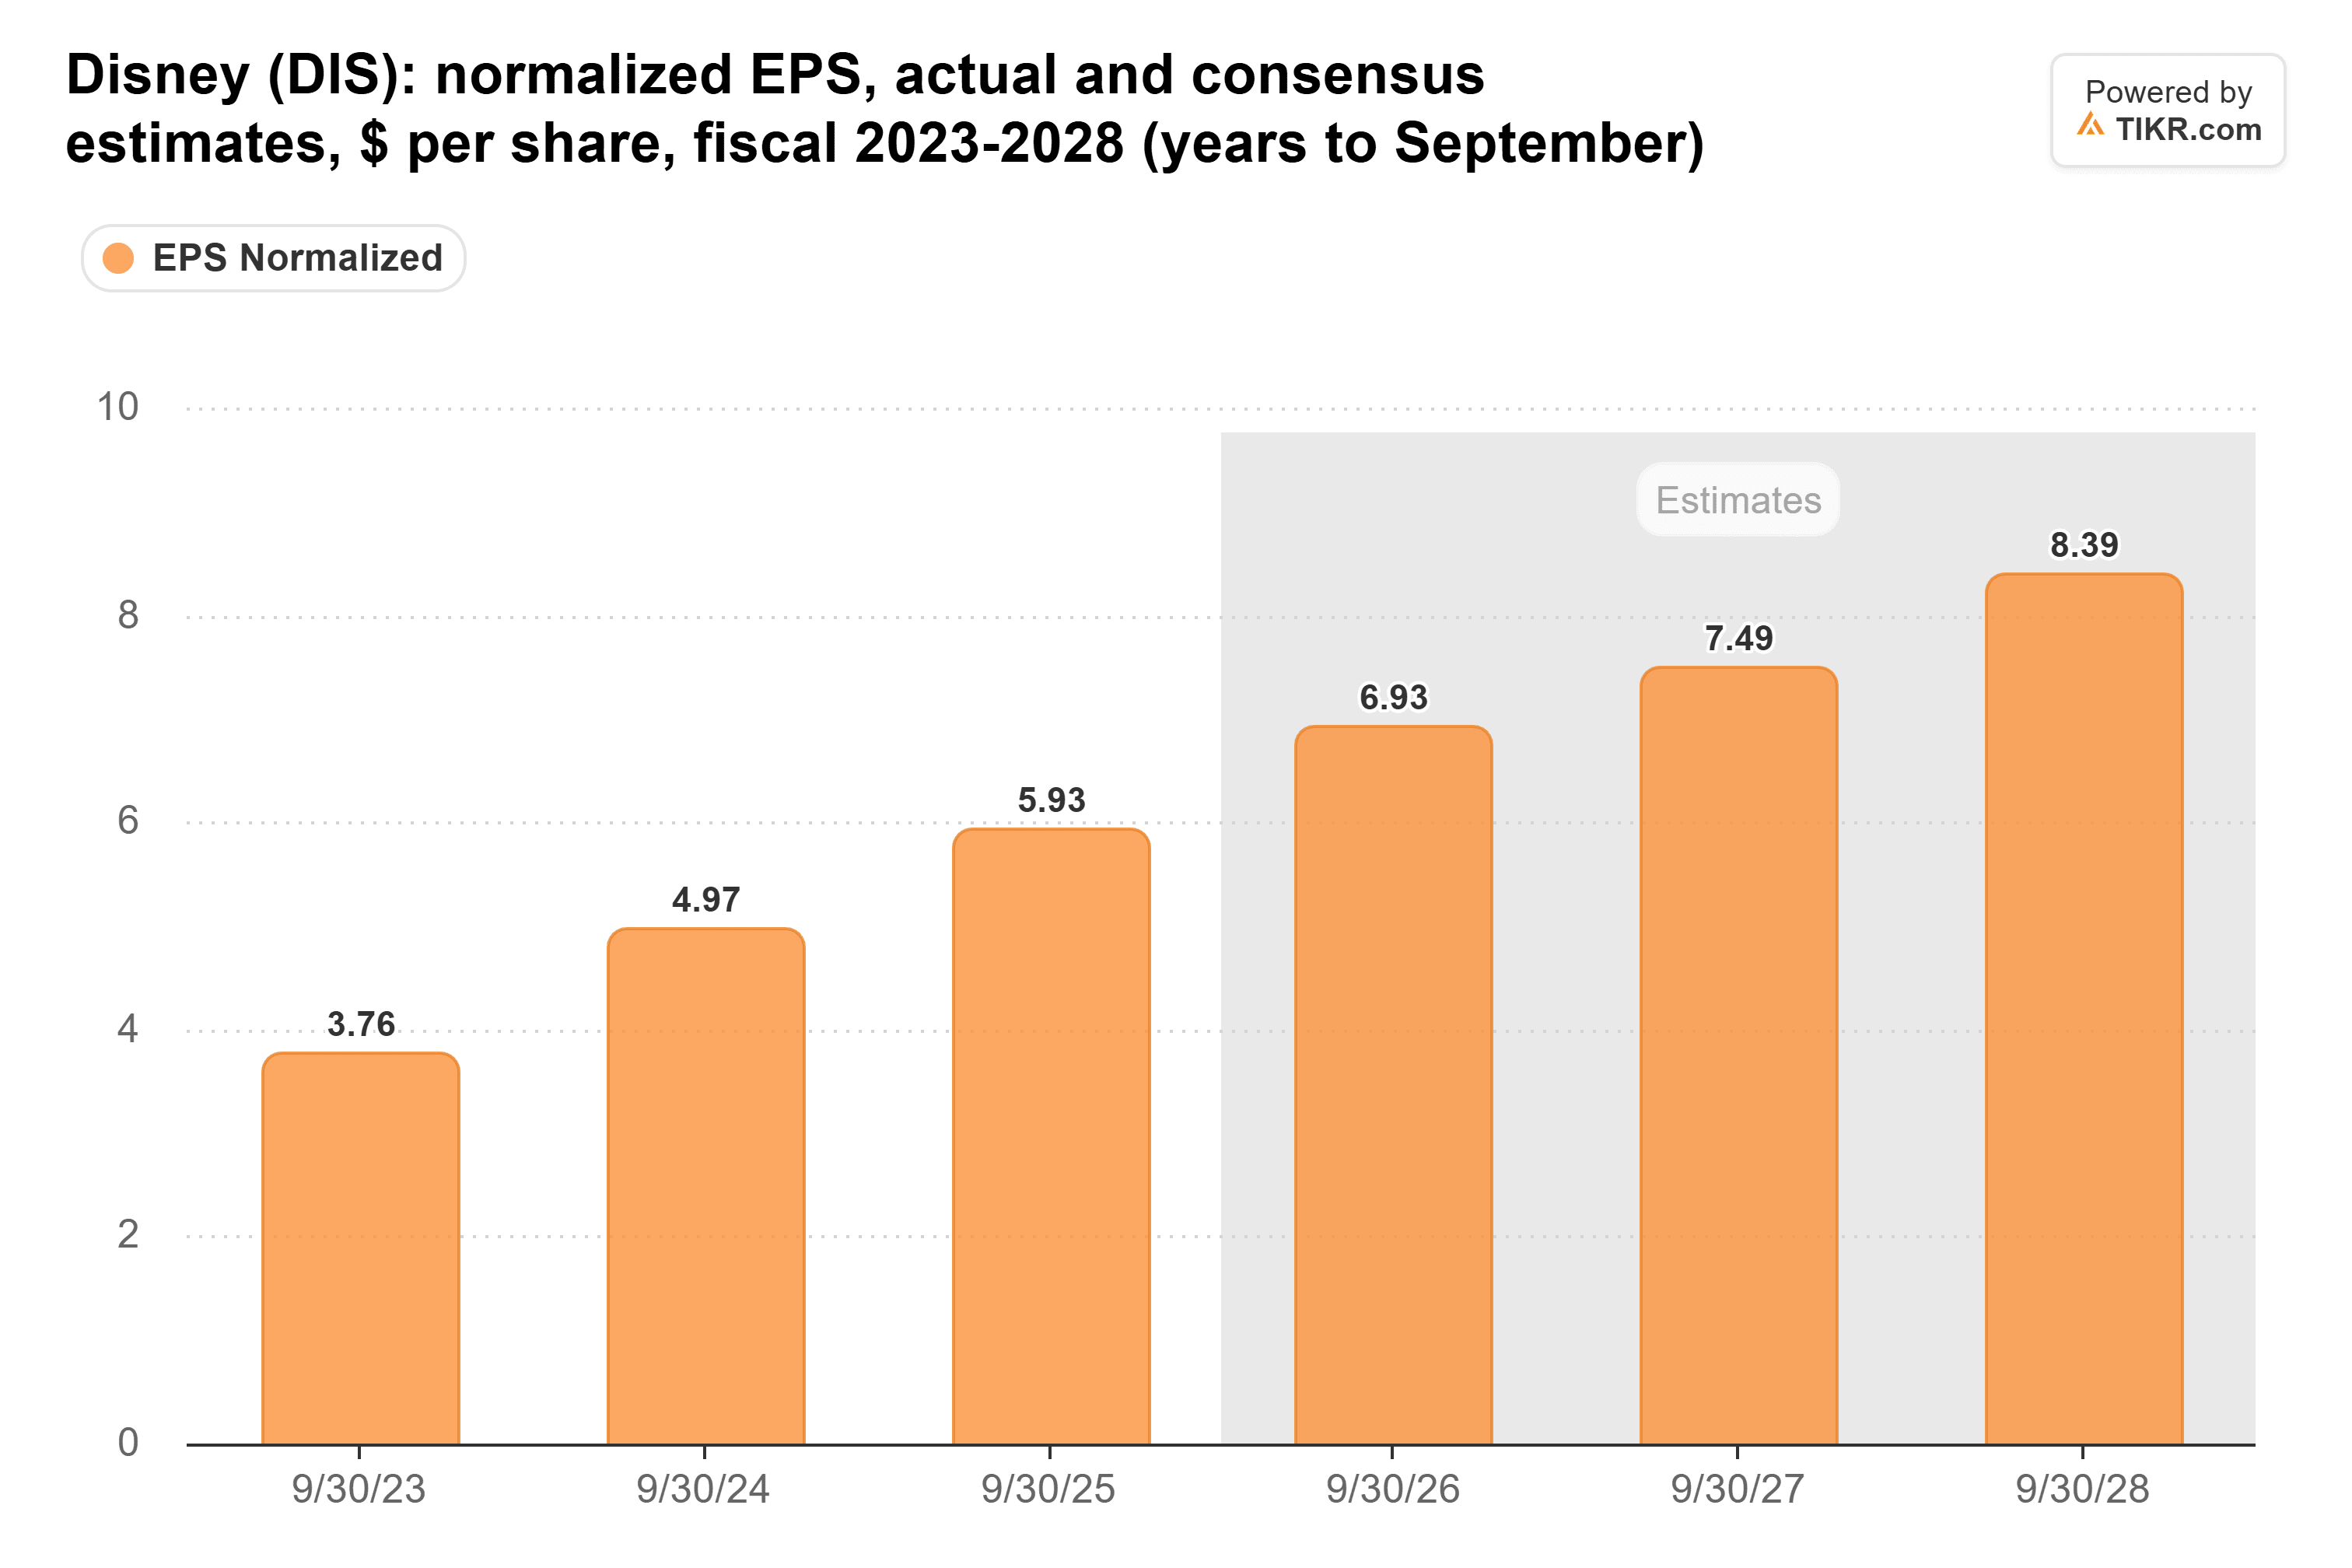
That understates the step, because fiscal 2026 has a 53rd week that won’t repeat. Management guides about 16% EPS growth this year with the extra week and about 12% without it, which implies about $6.64 of adjusted EPS excluding the extra week. Against that base, $7.49 is roughly 13% growth, in line with the double-digit guidance. Holding that line is the minimum; a dollar savings figure is the clearest way to beat it.
Watch the Margin
Disney’s operating margin hit 19.3% in the June quarter, its widest in at least three years.
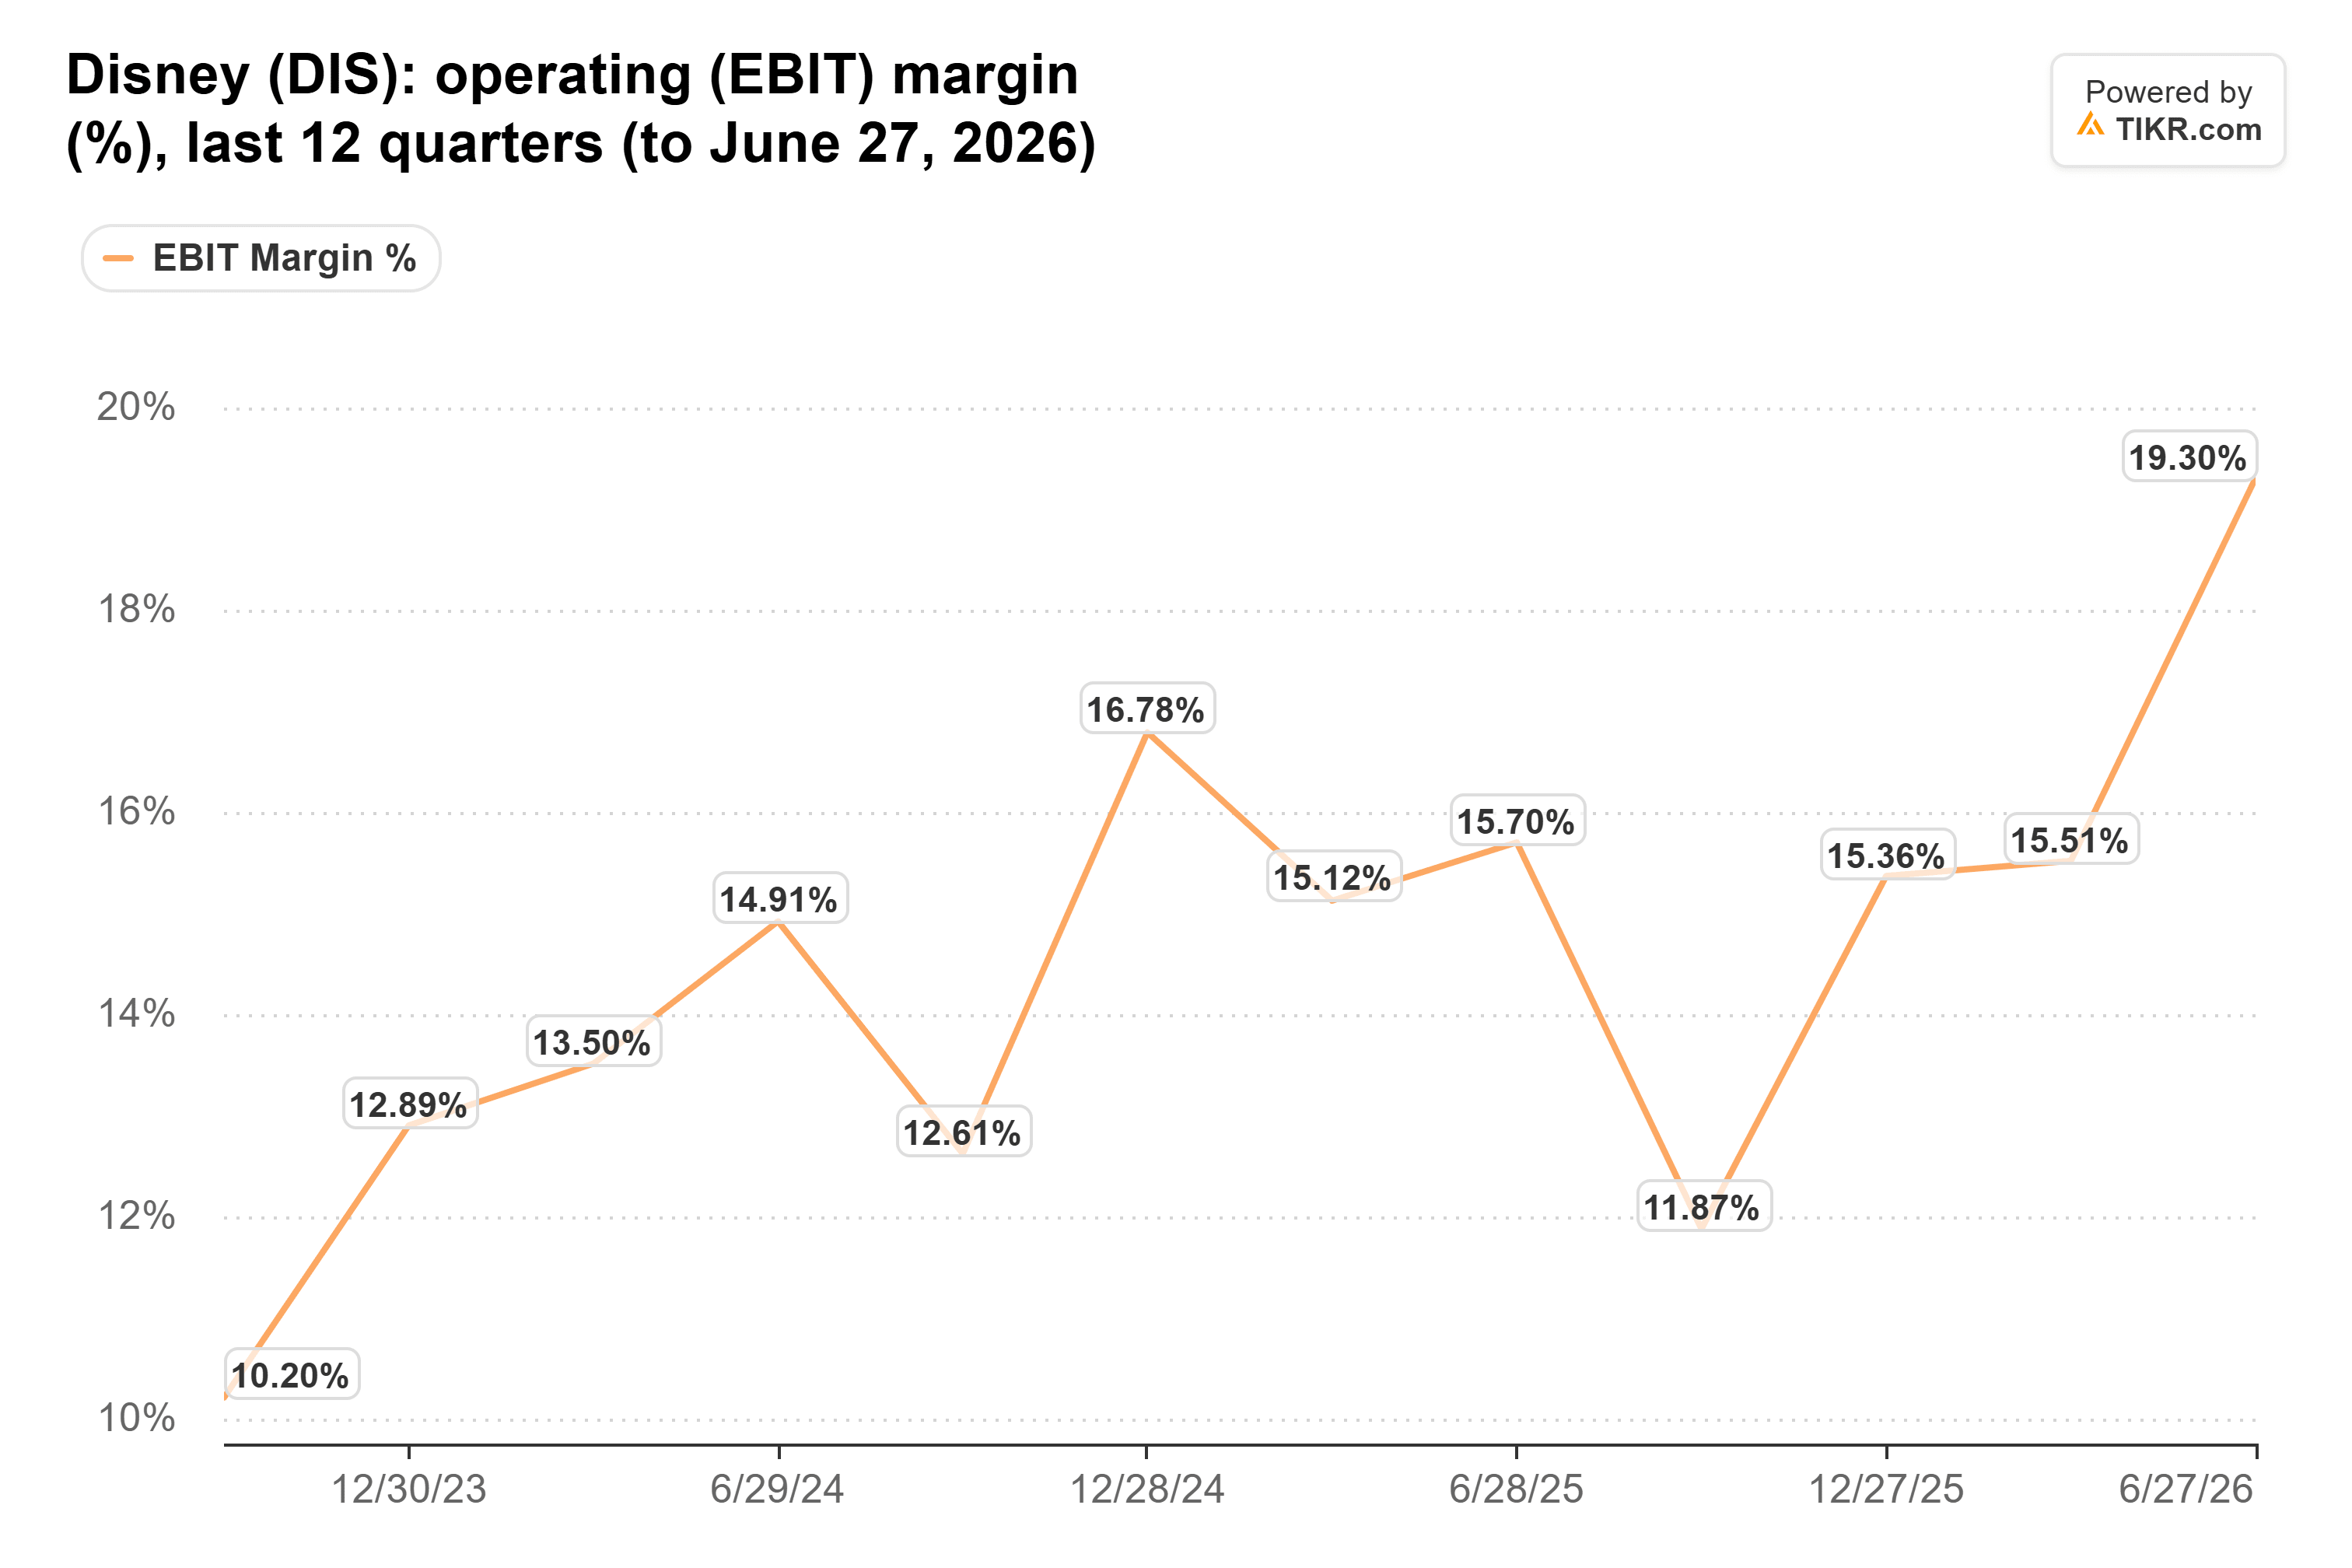
But the September quarter is always Disney’s thinnest: 11.9% last year and 12.6% the year before. Management has guided about $4.9 billion of segment operating income for the quarter, including the extra week, against $3.5 billion a year earlier.
Streaming is the line to watch. Disney+ and Hulu earned a 12.9% operating margin in the June quarter, up from 6.6%, though Disney’s third-quarter release said the timing of marketing and programming spending helped. Netflix’s October letter guided a 26% fourth-quarter operating margin despite about 1.2 percentage points of headcount costs, but cut its 2026 ad forecast to about $2.7 billion from $3 billion as some ad products rolled out more slowly than expected. Disney’s streaming ad revenue rose just 3%.
TIKR Tracks 32 Analysts on Disney. How Many Say “Buy”?
See the full breakdown of Buy, Hold, and Sell ratings on Disney, along with Wall Street’s revenue and earnings estimates, all in one place. More than 500,000 investors use TIKR to research stocks like this one. See Disney’s Analyst Ratings
Parks and Cruises Can Still Swing the Stock
Experiences earned 57% of segment operating income in fiscal 2025, so a soft travel outlook could outweigh any savings. Domestic park attendance rose 3% in the June quarter, but international parks earned 13% less.
Comcast’s co-CEOs cited “near-term cyclical headwinds in Theme Parks” after its theme parks adjusted EBITDA fell 17% to $780 million. Cruises look stronger: Royal Caribbean raised its guidance in October, and CEO Jason Liberty said “2027 bookings are pacing ahead of historical levels at higher rates.”
Disney Can Clear This Bar
Even after the run, Disney trades at about 16x forward earnings, below its five-year average of 21x and just under Netflix’s 17x.
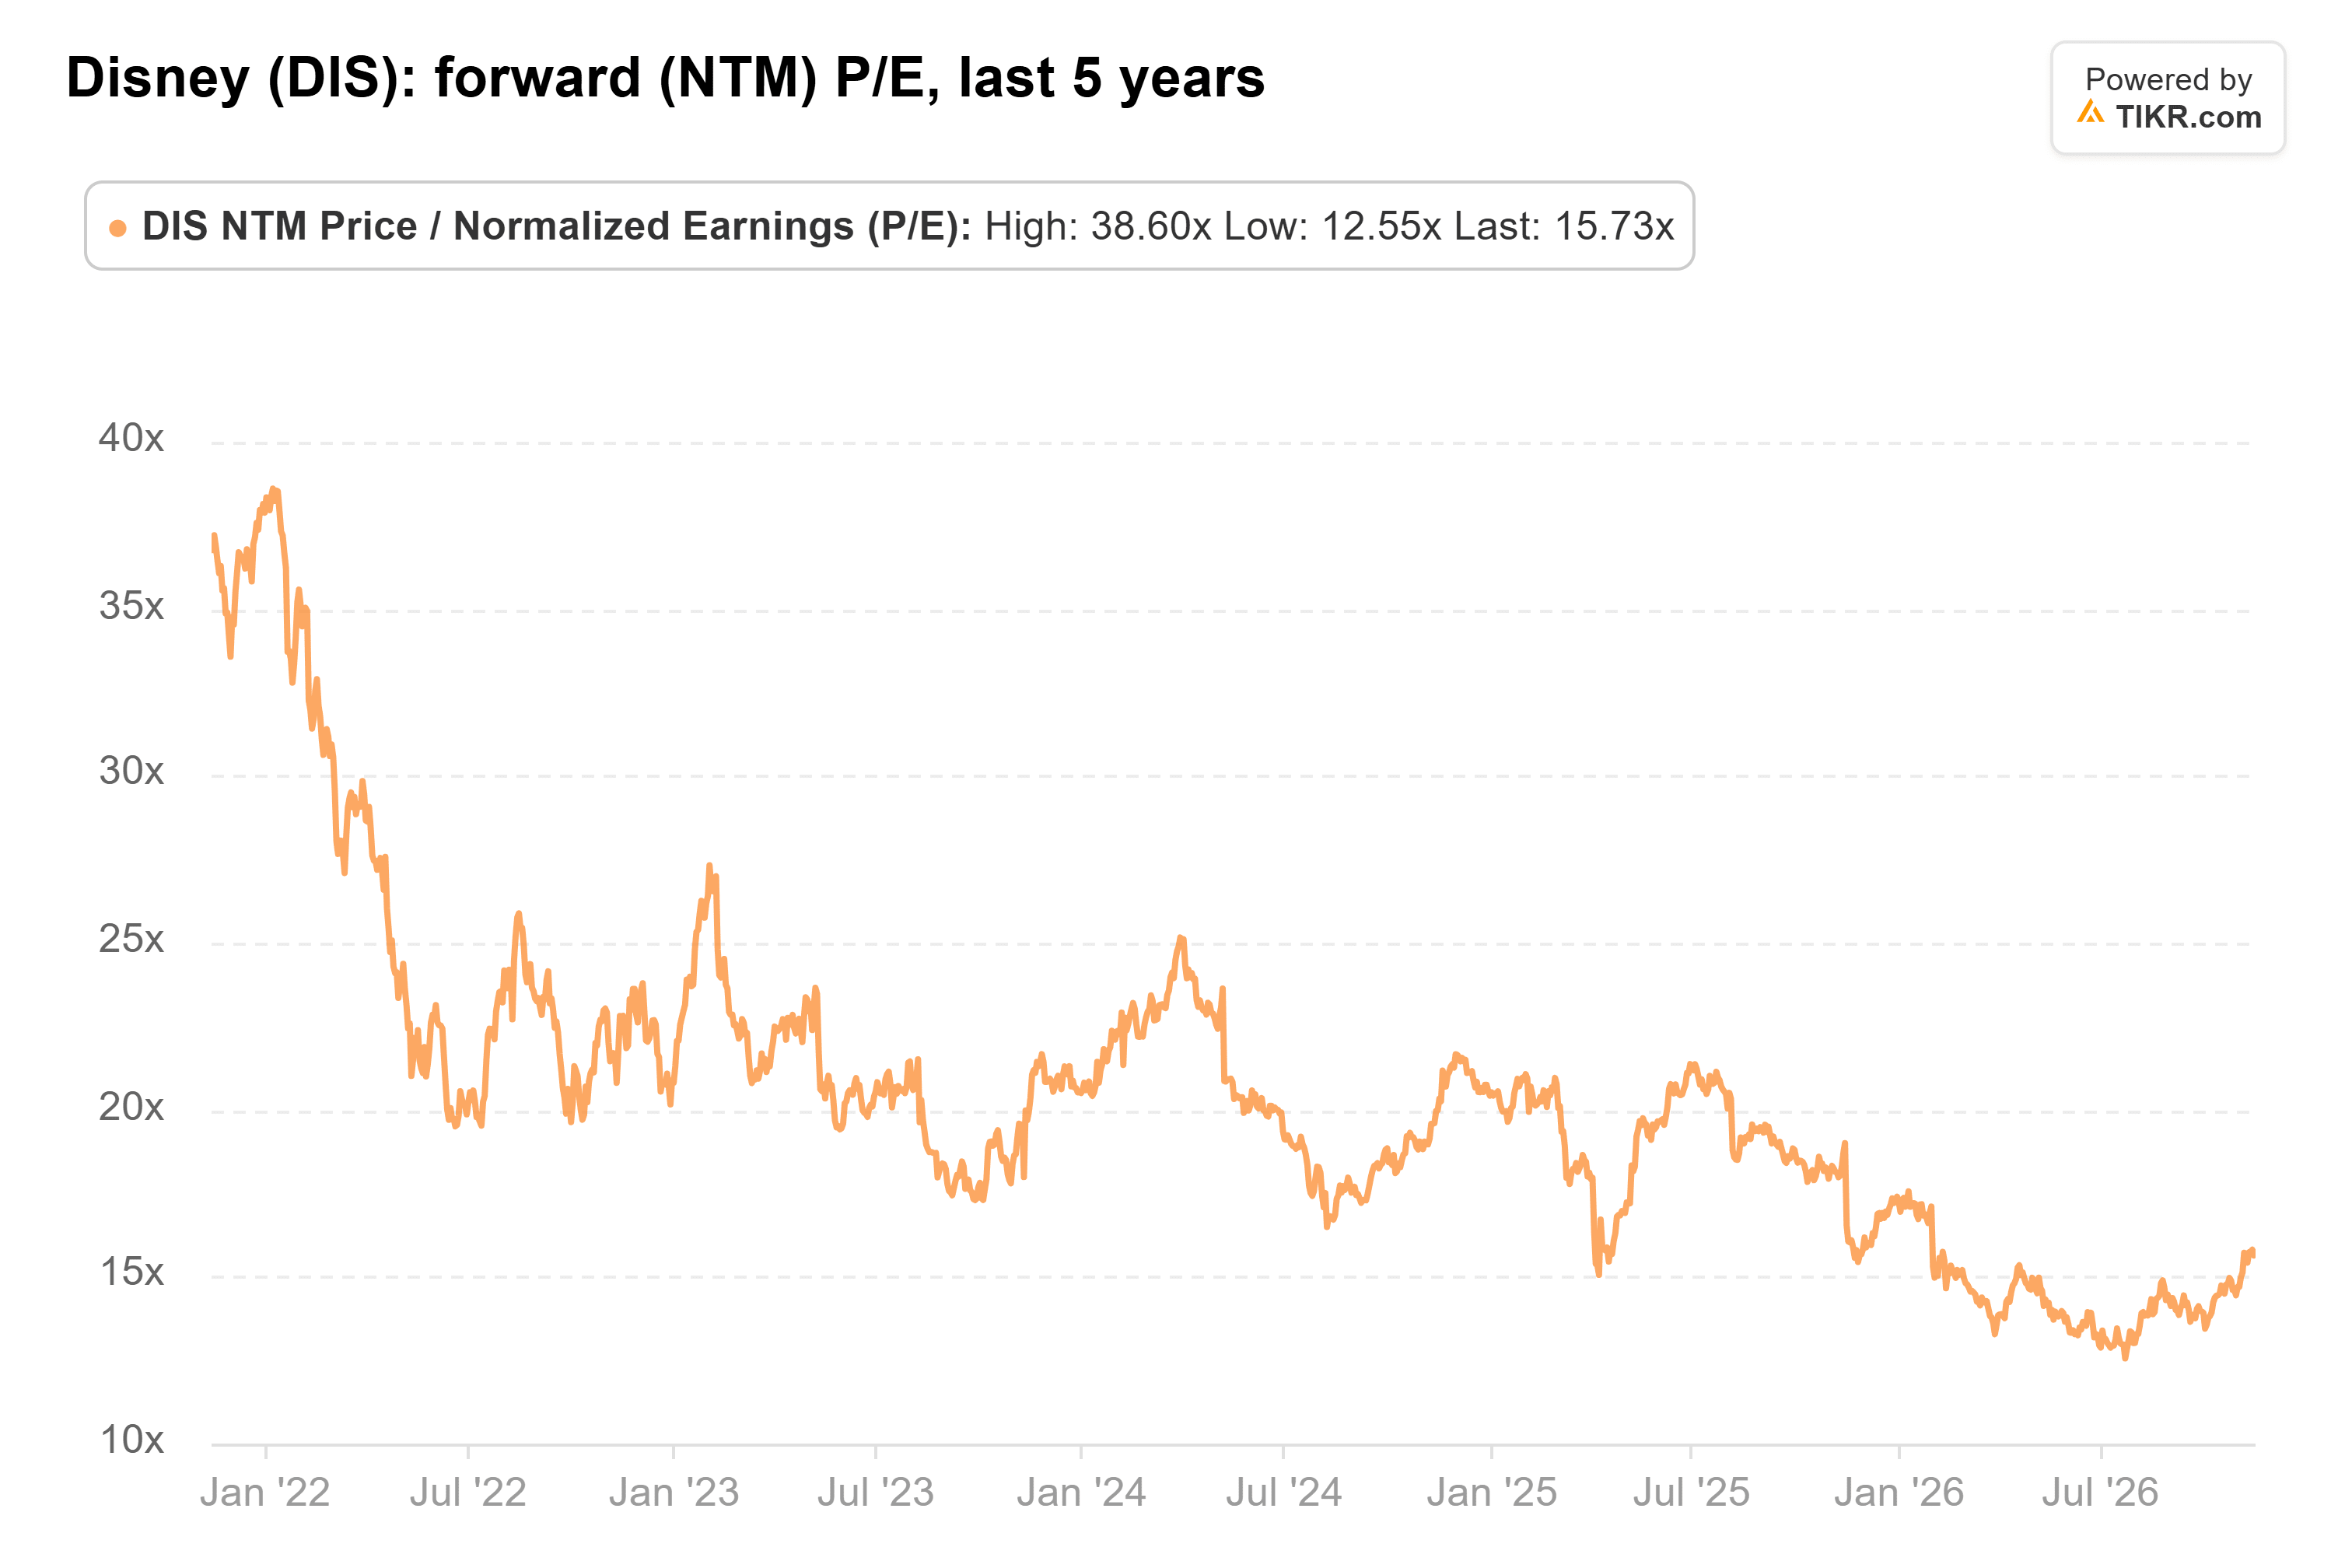
The double-digit promise is already in, the summer quarter showed the margin can move, and 16x doesn’t price in much beyond the Street’s numbers. But after a 29% run, an outlook that only repeats the guidance with no savings figure would likely give back some gains. Nov. 17 is the first test; the first-quarter report expected in early February is the fuller one.
So What Is Disney Stock Actually Worth?
TIKR lets you forecast the future price of any stock in less than a minute. Just enter a few assumptions into TIKR’s valuation model and see what Disney could be worth. Start from Wall Street consensus estimates, or adjust the inputs to reflect your own view of the business. It’s free to use.
Disclaimer:
Please note that the articles on TIKR are not intended to serve as investment or financial advice from TIKR or our content team, nor are they recommendations to buy or sell any stocks. We create our content based on TIKR Terminal’s investment data and analysts’ estimates. Our analysis might not include recent company news or important updates. TIKR has no position in any of the stocks mentioned. Thank you for reading, and happy investing!