Return on Equity (ROE) is a financial ratio that reflects a company’s profitability in relation to the equity invested by shareholders. It basically measures how effectively a company utilizes investors’ funds to generate profits.
The ratio is vital in assessing a company’s financial performance and comparing it to that of its industry peers. In this article, we delve deeper into the nuances of ROE.
We aim to help you understand what constitutes a ‘good’ return on equity ratio, how it is measured, and why it should be an essential part of your investment decision-making process.
What is Return on Equity (ROE)?
The Return on Equity (ROE) ratio can offer insights into a company’s operations. It helps to analyze a firm’s profitability and efficiency in utilizing shareholder equity.
The ROE is calculated using the below formula:
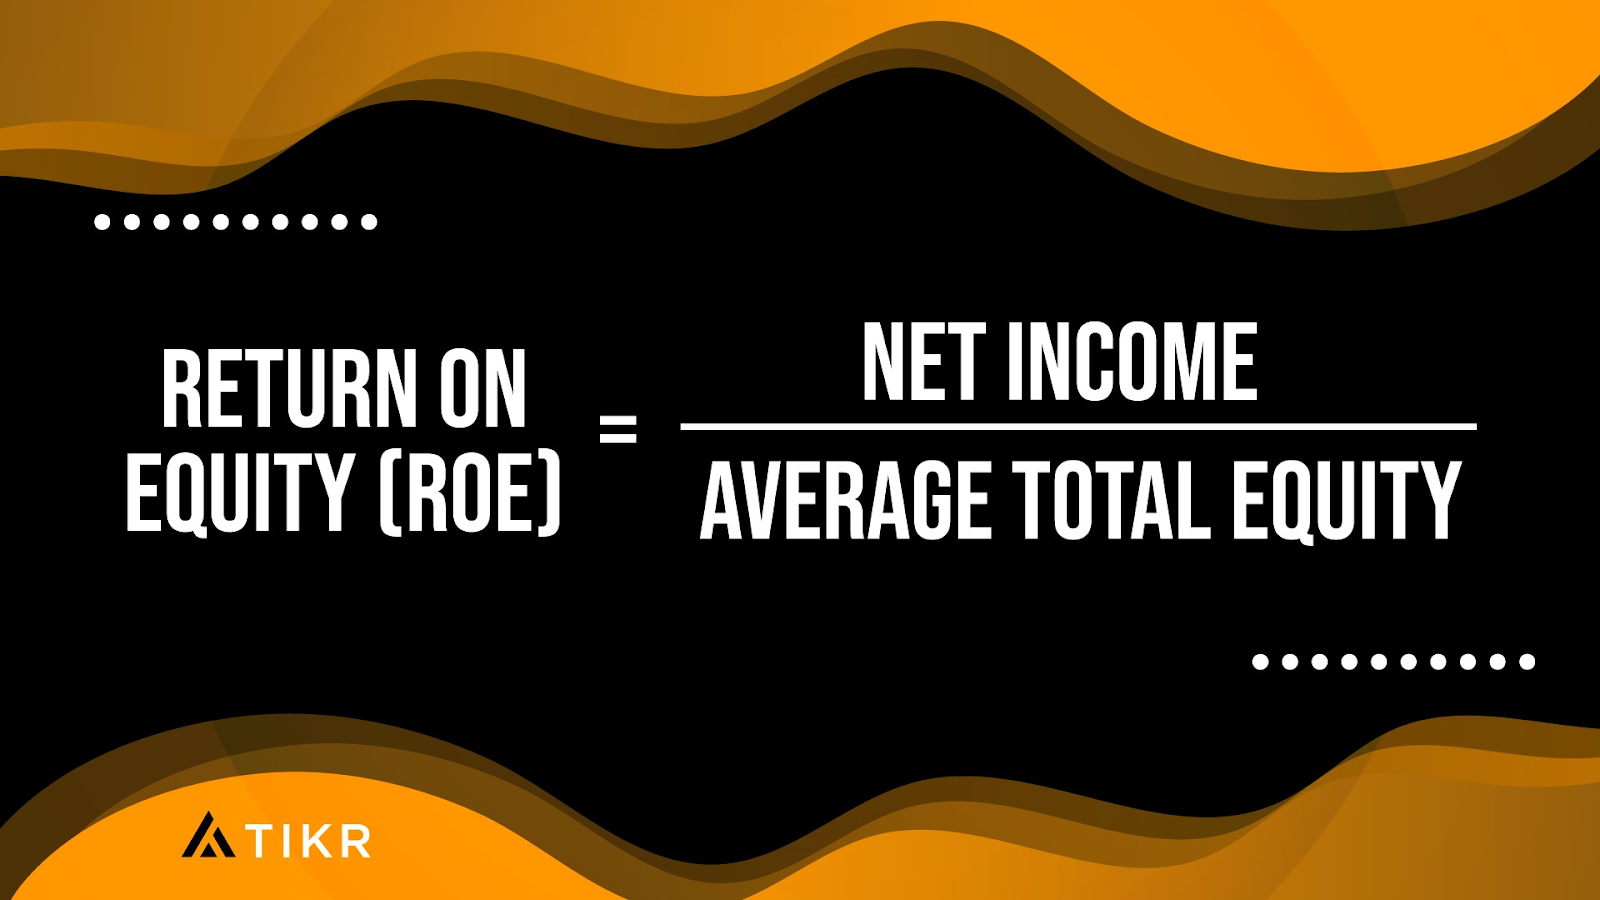
In this equation:
- Net Income represents a company’s profit after accounting for all expenses and taxes
- Shareholder’s Equity, or net assets, is the capital that owners have invested in the company. You can calculate shareholder’s equity by subtracting total liabilities from total assets
A high ROE typically signifies that a company is proficient at generating high profits without requiring much capital. Conversely, a low ROE can suggest the company is less efficient at converting investments into profits.
You can breakdown the ROE also using the DuPont formula which is:
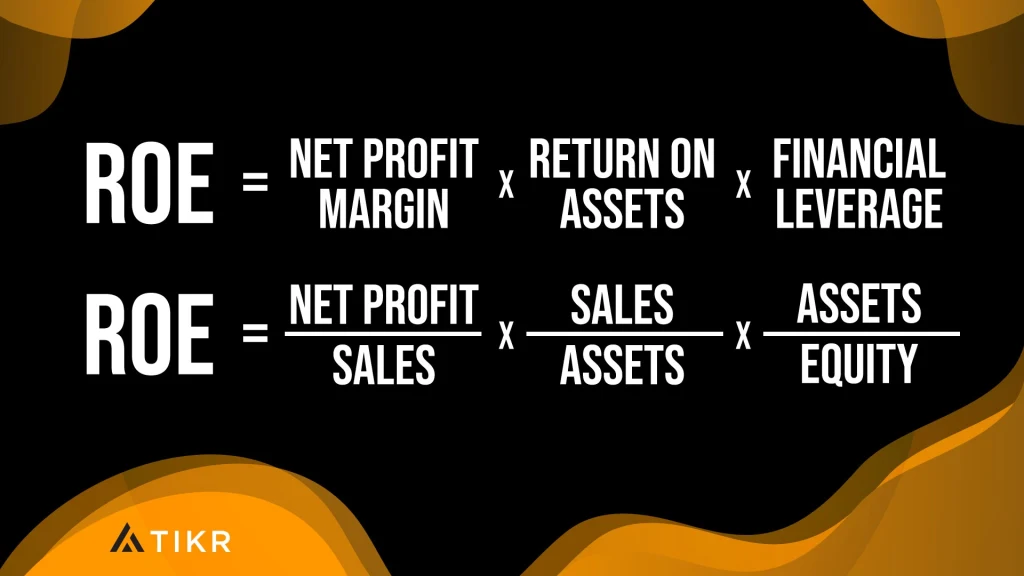
The DuPont formula provides a more granular view of the drivers of Return on Equity. Let’s take a look at each of these components:
- Net profit margin: It is calculated by dividing net income by total sales. A higher net margin will contribute positively to the ROE as it suggests a company can control costs effectively, thereby transforming a higher percentage of revenue into profits
- Asset turnover: It measures how effectively a company uses assets to generate sales. Calculated as Total Revenue divided by Total Assets, a higher ratio indicates a company efficiently uses assets to earn revenue
- Financial Leverage: Also called the equity multiplier, financial leverage analyzes how a company uses debt to finance assets. Here, you divide Total Assets with Shareholder’s Equity. A high multiple suggests that the company uses a higher percentage of debt to finance its assets instead of equity
The DuPont formula is an expanded version of ROE, providing insights into how a company drives the latter. Is it via profitability, high leverage or the efficient use of assets?
Pro tip: TIKR.com offers detailed financial data including Return on Equity, Net Profit Margins, Asset Turnover, and Financial Leverage on 100,000+ stocks globally.
The Importance of ROE in Investment Decisions
Investors should pay close attention to the ROE metric of a company when making investment decisions. The ratio helps to:
Assess profitability: The ROE is a vital indicator of a company’s profitability as it explains how effectively the company converts equity funding into profits.
Compare peer companies: You can use the ROE to compare companies in the same sector. It is a standardized metric used to compare peers and helps identify companies generating higher returns on equity.
Identify trends: You can compare the ROE over time and measure how efficiently the company’s management reinvests earnings to fuel growth.
Assess risk: While a high ROE multiple is favorable, you need to delve further if it’s extremely high. For instance, a company might be using debt to fund expansion plans which might not be sustainable.
What is a Good Return on Equity Ratio?
A good return on equity ratio depends on the sector in which the company operates. You need to identify a set of entities with similar business models and analyze them further.
The ROE ratio will vary across industries due to factors such as:
Capital Intensity: Some industries are more capital-intensive than others. For example, companies in sectors such as utilities, industrials, and manufacturing require a significant asset and equity base to operate. Alternatively, the tech sector is asset-light and requires less capital to generate profits and therefore tends to have higher Returns on Equity.
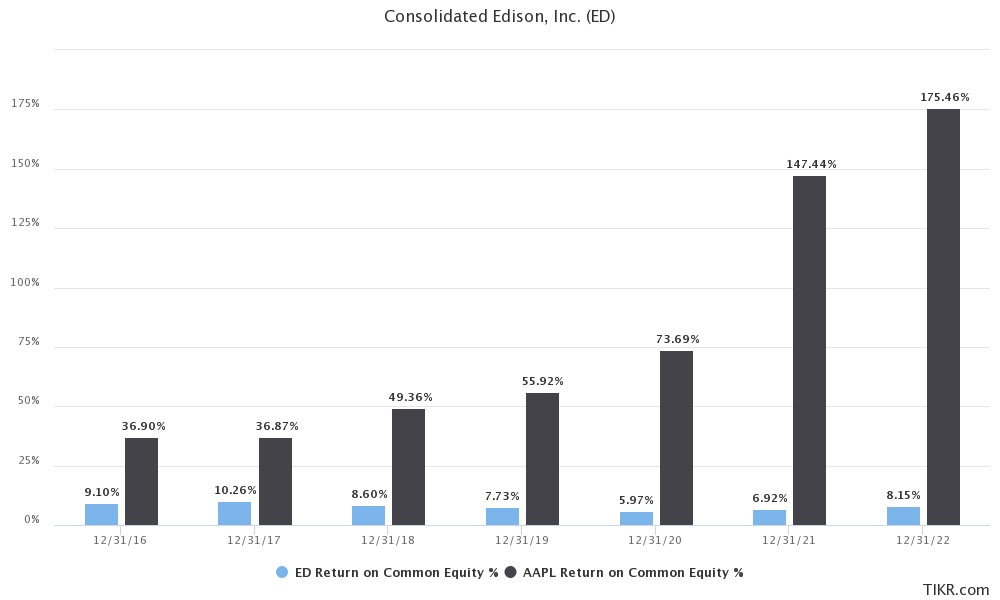
Profit margins: Tech and pharma companies generally have higher ROEs as they have higher profit margins. For example, the ROE for tech company Apple currently stands at 175.5%, but this ratio for utility company Consolidated Edison is much lower at 8.15% (Figure 1).
Financial leverage: Debt-heavy companies may exhibit higher ROEs as leverage can amplify earnings both to the upside and downside. Debt can positively impact earnings in the short-term, but also increases business risk long-term as the use of financial leverage cuts both ways. Debt on its own is not necessarily a bad thing, but it’s important to evaluate whether the company is using a prudent amount of financial leverage.
Growth prospects: High-growth companies usually reinvest most of their earnings back into the business, reducing the net income and resulting in a lower ROE. On the other hand, mature businesses generate consistent profits and tend to have higher ROEs.
Regulations: Highly-regulated industries like banking and insurance have minimum liquidity requirements, impacting future growth plans and cash flows.
While a good return on equity ratio depends on the sector in which the company operates, a useful benchmark is that the average U.S. company has a 16.5% ROE.
Return on Equity Company Examples
Comparing Apple to Consolidated Edison illustrates how ROEs can differ meaningfully by industry. The ROE for technology company Apple currently stands at 175.5%, but this ratio for utility company Consolidated Edison is much lower at 8.15% (Figure 1). We can further use the DuPont Formula to break down these ROEs and understand the drivers better.
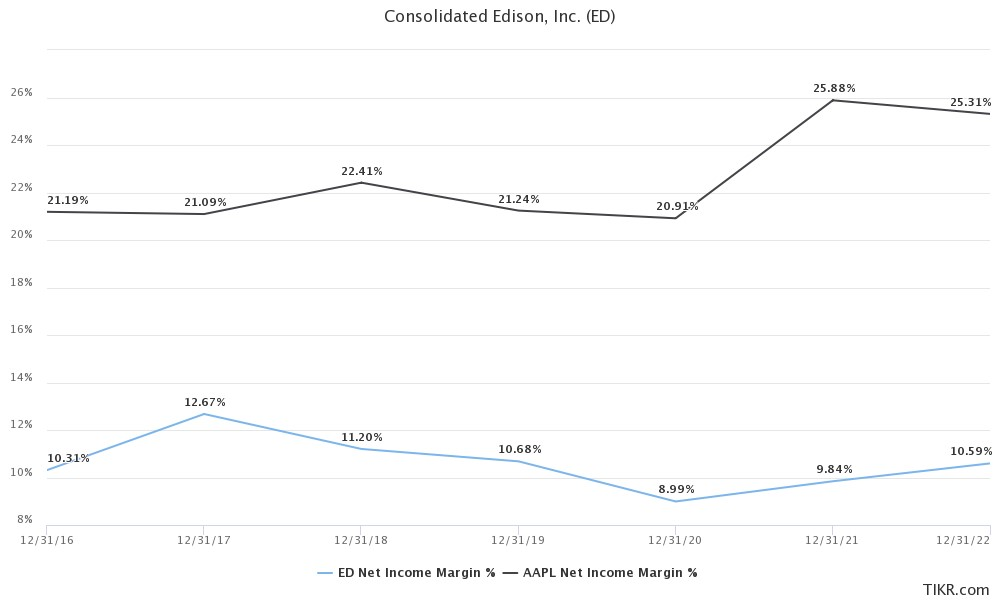
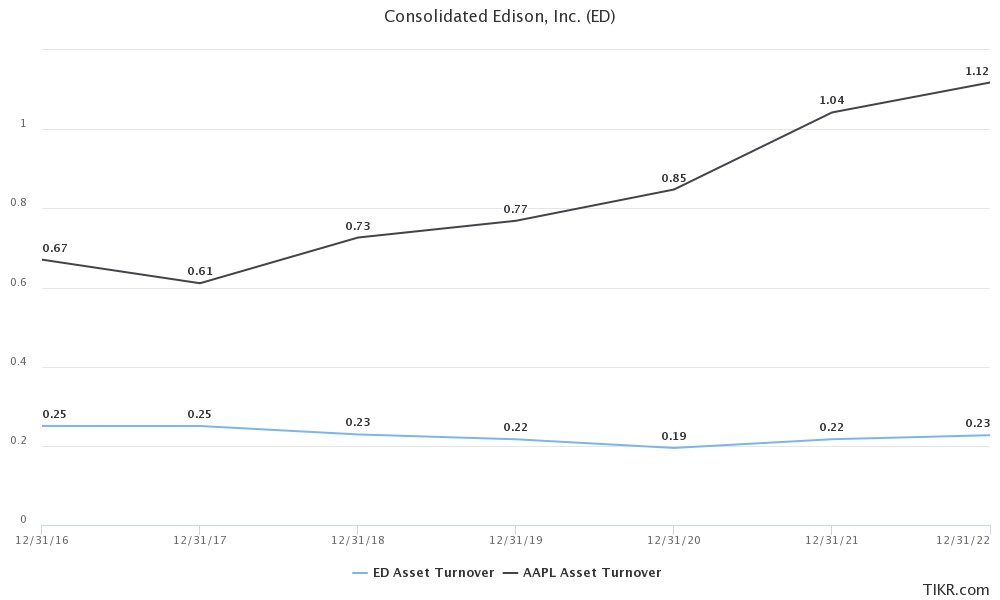
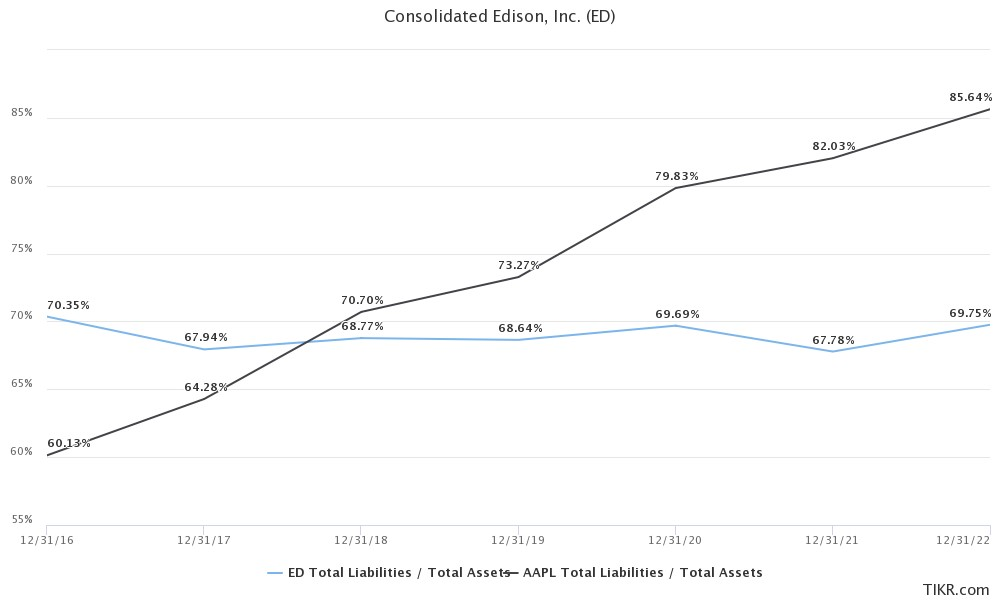
Starting with Net Profit Margins, we can see that Apple (AAPL) has higher margins at 25.31% versus Consolidated Edison (ED) at 10.59% margins. Next, we can see that AAPL also has higher asset turnover at 1.12x than ED at 0.23x. Finally, AAPL also has higher financial leverage than ED. All of this combined leads to much higher ROEs for AAPL than ED.
Final Thoughts
While Return on Equity is an important financial metric used to measure a firm’s profitability, it should not be used in isolation.
Now that you have a solid understanding of Return on Equity and its crucial role in analyzing a company’s financial health, it’s time to put this knowledge to use. There’s no better place to start your ROE analysis than by leveraging the power of TIKR.com.
TIKR’s platform equips you with institutional-quality financial data at your fingertips, offering you a competitive edge in your investment journey. Whether you’re examining ROE or any other financial metric, TIKR.com simplifies complex data saving you valuable time and effort. Analyze stocks quicker with TIKR!