Financial analysts and investors look at various metrics before deciding whether a stock is a buy. One of the metrics is the price-to-earnings ratio (P/E ratio).
The P/E ratio tells you whether a company’s stock price is overvalued, fairly valued, or undervalued. It also gives insight into a stock’s value compared to its industry peers.
But what is a good P/E ratio? In this post, we’ll look at what the P/E ratio means, how to calculate it, and how to use it to analyze stocks. We’ll also share some of the metric’s limitations.
What Is the P/E Ratio?
The PE ratio is a metric that measures the company’s current stock price relative to its earnings per share (EPS). Simply put, the PE ratio tells you how much investors are willing to pay for every dollar of a company’s earnings.
How to Calculate the P/E Ratio?
To calculate the P/E ratio, divide the current stock price by the Earnings Per Share (EPS). The result tells you how much you’ll pay for every dollar of the company’s earnings.
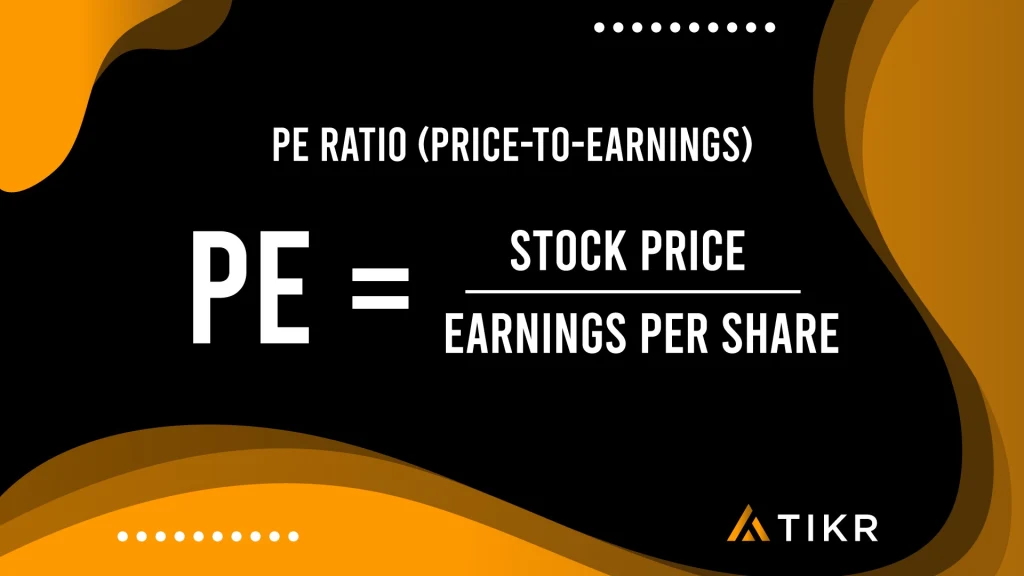
For example, a P/E ratio of 20x shows that you’re willing to pay $20 for $1 of a company’s earnings. This is why the P/E ratio is sometimes referred to as the P/E multiple.
Types of P/E Ratios
There are two primary types of P/E ratios with the main difference being in the denominator as current stock price is in the numerator for both ratios:
- Trailing P/E Ratio: Also known as trailing twelve months (TTM), this ratio uses company earnings over the last 12 months in the denominator. Since it factors in historical earnings rather than future projections, the trailing P/E ratio can gives a more objective picture of a company’s current valuation
- Forward P/E Ratio: Unlike the trailing P/E ratio that uses past earnings, the forward P/E ratio is derived using future earnings. This ratio isn’t as objective as it’s based on future estimates. However, it can be useful in evaluating stocks where future projections are more reliable than recently reported results. For example, this may be the case for companies that are likely to experience meaningful growth soon. The most common forward P/E ratio is the NTM or Next Twelve Months ratio. NTM P/E uses the estimated next twelve months Earnings Per Share (EPS) in the denominator
Pro tip: TIKR.com offers detailed valuation data including both Trailing P/E as well as Forward P/E ratios on 100,000+ stocks globally

Figure 1: Meta Platform’s Trailing P/E and Forward P/E over the last 5 years
What Is a Good P/E Ratio?
All else equal, the lower the P/E ratio the better. A stock with a low P/E ratio might be a good investment because you’re spending less on every dollar of a company’s earnings. On the other hand, a stock with a high P/E ratio can be seen as a poor investment since you spend more to purchase a share.
However, the P/E ratio on its own can be misleading. A stock with a lower P/E ratio doesn’t necessarily mean it’s a good investment. For example, the company may be generating unsustainably high profits in the short-term, artificially lowering its P/E ratio.
Conversely, a stock with a higher P/E ratio doesn’t mean it’s a bad investment. A high P/E ratio may suggest that investors have high expectations of the company’s future growth rate and are willing to pay more for the stock. If the company exceeds those expectations, it could still be a good investment.
As such, don’t rely on the P/E ratio alone when picking investments. For the P/E ratio to be effective, you should use it only as a benchmark to determine a company’s valuation if the underlying earnings number in the denominator is reliable and sustainable. Therefore, the P/E ratio is generally more helpful for mature companies with steady profits.
So what is a good P/E ratio? Generally, the P/E ratio is a reflection of the growth and risk of the underlying business. One helpful benchmark when investing is to consider that the average forward P/E ratio of the S&P 500 for the last 25 years is 16-17x.1
Therefore, assuming the stock you are looking at has similar or better growth and risk versus the average S&P 500 company, buying at anything less than 16x is likely a bargain. A stock that is trading above 17x P/E can still be a great investment, if it has above average growth characteristics.

Figure 2: Average forward P/E ratio of the S&P 500 for the last 25 years is 16-17x
How To Use P/E Ratio to Analyze Stocks
The P/E ratio is a useful metric for analyzing stocks. One helpful way to use the P/E ratio to analyze stocks is to compare the stock’s P/E ratio to itself over time. If it’s trading below its 3-year or 5-year average P/E it could be a bargain, assuming its fundamentals haven’t deteriorated over time.
Another way is to compare the stock’s P/E ratio to that of its peers. All else equal, if the stock you are analyzing has a lower P/E ratio than its peers, then it could potentially be a bargain.
Growth stocks typically have high P/E ratios, while investments with a below-industry-average P/E ratio would be classified as a value stock.
Pro Tip: TIKR allows you to compare any stocks’ P/E ratios to its own history over the last 10+ years. It also lets you compare P/E ratios against competitors!

Figure 3: Walmart vs. Target P/E ratios over the last 10+ years
Limitations to the P/E Ratio
Although the P/E ratio can help tell you if a stock is undervalued or overvalued, you can’t use it alone to make investment decisions. You should use the P/E multiple along with other financial ratios to get a clearer picture of a company’s valuation. It’s also important to keep its limitations in mind.
For one, for the P/E ratio to be useful, the EPS needs to be an accurate representation of normalized or sustainable earnings on a go-forward basis. However, this may not always be the case. For instance, if a company is reinvesting in growth, its margins will be temporarily depressed. So it’s important to normalize or remove one-time items to get a true understanding of the economic earnings of the business.
Besides, some companies may report negative or no earnings at all which is not useful for stock valuation. For example, this is commonly the case with companies that are rapidly growing and may be reinvesting all of their profits back into the business.
Another limitation of the P/E ratio is its difficulty to use when comparing companies across different industries. Different sectors have wildly different P/E ratios. For example, Apple (AAPL) and Walmart (WMT) might have very different P/E ratio since they operate in different industries with different risk and growth characteristics.
Final Thoughts
The P/E ratio is a metric that helps put into context the company’s current stock price versus its earnings per share (EPS). For the P/E ratio to be useful it’s important that the EPS in the denominator is an accurate representation of normalized or sustainable earnings on a go-forward basis. All else equal, the lower the P/E ratio, the better the investment opportunity.
While you can calculate the P/E ratio for every stock, that can be overwhelming! With tools like TIKR, you can access P/E ratios for 100,000+ stocks globally. This makes it easy to value stocks while putting into context their industry peers and the company’s own history. Get started for FREE today at TIKR.com. Analyze stocks quicker with TIKR!
Frequently Asked Questions (FAQ)
What Is a typical PE Ratio?
There’s no clear answer, as P/E ratios vary by industry. A typical P/E ratio is the average P/E ratio of its industry. However, a useful benchmark is that the average forward P/E ratio of the S&P 500 for the last 25 years has been 16-17x.
What Is a High P/E Ratio?
A high P/E ratio usually means that investors expect higher future earnings growth and are willing to pay more for each dollar of a company’s earnings.
Is a Higher or Lower P/E Ratio Better?
All else equal, a low P/E ratio is much better than a higher P/E ratio. However, the reality is more nuanced as P/E multiples are a reflection of the growth and risk expectations of the underlying business.
Higher ratios usually tell you that investors expect higher company growth in the future than the overall market. As such, they’re willing to pay more to buy a share of the stock. However, if growth ends up underperforming expectations, then high P/E ratios can mean the stock is overvalued and may not be worth the price.
A lower P/E ratio can mean that the stock is undervalued. But again the reality is more nuanced, as a low P/E stock can still be a poor investment if earnings decline rapidly in the future. Ultimately what matters most is the future trajectory of earnings over the long-term.
What Does a Negative P/E Ratio Mean?
A negative P/E ratio means a company reported no earnings or negative Earnings Per Share. This can happen if the company is losing money.
While a negative P/E ratio indicates a loss, it doesn’t necessarily mean the company is going bankrupt. There are several reasons a company may report a negative P/E ratio:
- The company is still in its growth stage
- There’s a change in accounting policies
- One-time or non-recurring expenses
Is a Negative P/E Ratio Bad?
A negative P/E ratio is generally a bad sign. When a company reports a negative P/E ratio, it’s either losing money or going through periods of unprofitability.
However, not all companies that have negative P/E ratios are bad investments. Even the best companies may be unprofitable at some point in their operations, especially if they are focused on growth and are therefore reinvesting back into the business. As such, looking at past P/E ratios is crucial. The most important thing is the long-term profitability of the company.
How Can I Analyze P/E Ratios?
Individually calculating P/E ratios for stocks is a huge challenge. The better way to do it is to use TIKR.com’s software which automatically calculates P/E ratios over 10+ years for 100,000+ stocks globally.
Easily compare P/E ratios across companies to find winning stocks. Analyze stocks quicker with TIKR!